≡ Menu

Super Bowl Champions and First Round Contributors

The only skill position player in Super Bowl XLIX drafted in the first round

The only skill position player in Super Bowl XLIX drafted in the first round

On offense, the Patriots have one player on the entire roster who was selected in the first round: tackle Nate Solder.  On defense, starters Chandler Jones, Dont’a Hightower, Devin McCourty, and Vince Wilfork were chosen by New England in the first round. And let’s not forget Darrelle Revis, a first round pick of the Jets; those are five of the best players on New England’s defense right now.  The Patriots defense also features Jerod Mayo and Dominique Easley, two former first round picks now on injured reserve.

But most of New England’s key contributors were not first round picks. Tom Brady, of course, was a 6th round pick. Rob Gronkowski was a 2nd, Julian Edelman was a 7th, Brandon Lafell was a 3rd, Rob Ninkovich was a 5th, and so on. Every year, Pro-Football-Reference generates an Approximate Value rating for each player in the NFL. This year, former first round picks of the Patriots generated just 23% of the team’s Approximate Value. [continue reading…]

{ 2 comments }

2015 Hall of Fame Candidates

Tomorrow, the newest members of the Pro Football Hall of Fame will be announced.  There are three first-year candidates that are finalists: Junior Seau, Kurt Warner, and Orlando Pace. This year, the Seniors’ Committee was only allowed to select one candidate, and that was Mick Tingelhoff; the former Vikings center will receive a simple up or down vote, and will not take a space from any of the 15 modern-era candidates (of which a maximum of five will be selected).

In addition, the Hall will open its doors to a special class of Contributors, who, like the Seniors’ choices, will receive a yes or no vote where 80% is required for induction. The choices this year are Bill Polian and Ron Wolf.   So we could have as many as eight members in the Class of 2015, and there’s a very good chance that we’ll have exactly that many.  While the Seniors’ Committee selection is not guaranteed induction, Tingelhoff is a strong candidate and I doubt he would have been chosen if they didn’t think he would be selected; ditto Polian and Wolf, and my guess is the “Contributor” choices will have a pretty easy time gaining entry most years.  Let’s take a look at all 18 candidates, courtesy of Pro-Football-Reference: [continue reading…]

{ 19 comments }

The Patriots SRS rating has been inflated in the postseason

The Patriots true SRS rating is deflated if you only use regular season data.

It has always seemed a little strange to me that we think about the regular season and the playoffs separately when evaluating a team’s season. At least, that’s usually what happens in terms of the numbers. We think about a team’s regular season record and we think about where they were eliminated in the playoffs. A team’s Simple Rating System (SRS) rating is based just on their regular season performance. [1]Note that Football Outsiders’ DVOA does update for the playoffs. When we evaluate a team or a matchup, it might make more sense to think about their whole body of work including the playoffs when calculating ratings.

In the table below, I have calculated the SRS of Super Bowl teams according to Pro Football Reference’s (PFR) method that considers just the regular season. [2]It looks like I get the same numbers as PFR in a bunch of cases, but I have not checked all of them. In any event, it looks like my program works. I have also added adjusted ratings that include the playoff games leading up to the Super Bowl. These set of adjusted ratings help to identify the Super Bowls that were the closest and best matchups based on teams’ performances over the entire season including the playoffs. [continue reading…]

References

References
1 Note that Football Outsiders’ DVOA does update for the playoffs.
2 It looks like I get the same numbers as PFR in a bunch of cases, but I have not checked all of them. In any event, it looks like my program works.
{ 10 comments }

Are NFL Playoff Outcomes Getting Less Random?

In September 2012, Neil Paine wrote a great article at this website titled: Are NFL Playoff Outcomes Getting More Random? In it, Neil found that randomness had increased significantly in the NFL playoffs, with “recently” defined as the period from 2005 to 2011.

In fact, while 2005 was a pretty random postseason, 2006 was one of the more predictable playoff years.  But the five-year period from 2007 to 2011 was a really random set of years. Consider that:

  • In 2007, the Giants won three games as touchdown underdogs, including the Super Bowl as a 12.5-point underdog.  The Chargers also won a playoff game against the Colts as an 11-point dog.
  • In 2008, five of the eleven playoff games were won by underdogs! That list was highlighted by the Cardinals winning in Carolina as a 10-point underdog in the divisional round.
  • The following year, five of the eleven playoff games were upsets, including the Jets winning as 9-point underdogs in San Diego.
  • In 2010, for the third straight year, there were five playoff upsets, including two huge ones: the Jets as 9.5 point dogs in Foxboro, and the Seahawks as 10-point home dogs against the Saints.
  • Noticing a trend? Well, in 2011, five of the playoff games were again won by the underdog. The two big upsets here were the Tim Tebow-led Broncos against the Steelers, and the Giants winning in Lambeau Field against the 15-1 Packers.

[continue reading…]

{ 10 comments }

This week at the New York Times, a look at the Patriots trick formations, and how New England has creatively worked around the NFL’s rules on eligible pass receivers.

In the divisional round of the N.F.L. playoffs, the New England Patriots dived deep into their playbook for a series of trick plays. What the Patriots did surprised even rule book aficionados, to say nothing of the team’s opponent, the Baltimore Ravens. It was also entirely legal, and the result of Coach Bill Belichick’s limitless ingenuity and deep understanding of the N.F.L. rules.

The N.F.L. publishes a rule book each year titled the “Official Playing Rules of the National Football League.” Rule 7, Section 5 of the 2013 edition covers eligibility. It is that section that contains one of the most basic elements of N.F.L. play, a rule so commonly adhered to that it goes unnoticed by most observers: There must be at least seven players on the line of scrimmage at the snap of each play.

Of those seven players, only the two outside players are eligible to catch a pass on a play; the inside five players on the line of scrimmage are, by definition, ineligible. But not only are the two outside players the only ones on the line of scrimmage eligible to catch a pass, those players must be eligible receivers.

You can read the full article here.

{ 0 comments }
There's a flag on Brandon Browner

There’s a flag on Brandon Browner

In 2013, Brandon Browner started eight games for the Seattle Seahawks. And while ended the year on the NFL’s suspended list, he still received a ring when Seattle went on to win Super Bowl XLVIII.

Now with the Patriots, Browner could pull off the rare trick of winning back-to-back Super Bowls with different teams. This has been done only four times before in NFL history:

  • Defensive back Derrick Martin played in five games for the Packers in 2010 and 14 for the Giants in 2011. Sure, Martin totalled just 1 interception and 14 tackles during those two years, but it counts!
  • Guard Russ Hochstein was drafted by Tampa Bay in 2001 and played in one game in 2002; he was waived in October and signed by the Patriots a week later. He stayed in New England through 2008, so Hochstein picked up a Super Bowl ring for his cup of coffee with the Bucs and then earned two more the next two seasons in New England. Hochstein was also a freshman with Nebraska in 1997, when the Cornhuskers were named national champions by USA Today and ESPN.
  • The two more famous members of the club pulled off this trick in 1994, as members of the San Francisco 49ers, and in a surrounding year with Dallas Cowboys. One was Deion Sanders, who left Atlanta for San Francisco in 1994, and then San Francisco for Dallas in ’95. The other was Ken Norton, Jr., who spent the first six years of his career with Dallas, and won the Super Bowl in 1992 and 1993. Norton then joined the 49ers in ’94, where he spent the final seven seasons of his career.  Hochstein and Norton are the only two players to win Super Bowls in three consecutive seasons.

Norton has been the Seahawks linebackers coach since 2010, so he’s looking to pick up his fourth career ring on Sunday.

{ 2 comments }

Rams/Raiders was the Least-Conforming Game of 2014

50/50 chance these guys show up

50/50 chance these guys show up

They’re baaack! In November 2013, the St. Louis Rams blew out the visiting Indianapolis Colts in what was the least-conforming game of the 2013 season.

In November 2014, the Rams blew out the visiting Oakland Raiders in what was the least-conforming game of 2014 (although for my money, the runner-up game between the Titans and Chiefs was probably still the strangest result of the year). The Rams finished the season with a -0.8 SRS rating, eight points better than the 2014 Raiders SRS rating of -8.8. Given that the game was in St. Louis, we would have expected the Rams to win by around 11 points.

In reality, the Rams shut out the Raiders, 52-0. That gave St. Louis a single-game SRS score of 40.2, meaning the Rams were 40.2 points better than average that day. [1]Technically, this bit of information is superfluous for the main point of this post, but I always err on the side of including interesting data. Since St. Louis won by 52 when the Rams were expected to win by 11, they exceeded expectations by a whopping 41 points.

That 41-point total — the amount by which St. Louis exceeded expectations — was the highest of any game in 2014. The table below lists all relevant information from every regular season game this year, with the “diff” column showing the difference between the expected and actual margins of victory. I have also included a link to the boxscore of each game embedded in the “Wk” cell. Note that the table, by default, lists only the top 10 games, but you can view more using either the dropdown box, the search bar, or the previous/next buttons at the bottom of the table. [continue reading…]

References

References
1 Technically, this bit of information is superfluous for the main point of this post, but I always err on the side of including interesting data.
{ 1 comment }

super-bowl-squares-xlixFor the last two years, I’ve written about Super Bowl squares. Well, it’s that time of year again, so here’s your helpful cheat sheet to win at your Super Bowl party.

Every Super Bowl squares pool is different, but this post is really aimed at readers who play in pools where you can trade or pick squares (surely no pool has a prohibition on this!) I looked at every regular season and postseason game from 2002 to 2013. [1]Yes, this means your author was too lazy to update things for the 2014 season, because frankly, the extra work isn’t worth it. The table below shows the likelihood of each score after each quarter, along with three final columns that show the expected value of a $100 prize pool under three different payout systems. The “10/” column shows the payout in a pool where 10% of the prize money is given out after each of the first three quarters and 70% after the end of the game; the next column is for pools that give out 12.5% of the pool after the first and third quarters, 25% at halftime, and 50% for the score at the end of the game. The final column is for pools that give out 25% of the pot after each quarter — since I think that is the most common pool structure, I’ve sorted the table by that column, but you can sort by any column you like. To make the table fully sortable, I had to remove the percentage symbols, but “19, 6.7, 4.1, 2” should be read as 19.0%, 6.7%, 4.1%, and 2.0%. [continue reading…]

References

References
1 Yes, this means your author was too lazy to update things for the 2014 season, because frankly, the extra work isn’t worth it.
{ 0 comments }
Madden cover curses don't scare Sherman

Madden cover curses don’t scare Sherman

The Seahawks had three players named to the Associated Press’ first-team All-Pro roster: inside linebacker Bobby Wagner, safety Earl Thomas, and cornerback Richard Sherman. The Patriots had two such players: tight end Rob Gronkowski and cornerback Darrelle Revis.

It is no surprise that Revis and Sherman were named first-team All-Pros. This is the fourth such time Revis has been so honored, while it’s the third straight year for Sherman. Once deflategate goes away, [1]Just kidding, that will never happen. I expect the media to realize that hey, the teams with the top two cornerbacks in the NFL are in the Super Bowl! That might be a story worth covering! [2]Of course, with Thomas in Seattle, one could extend the story beyond just the cornerback position to the defensive back grouping. In addition, both Patriots safety Devin McCourty and Seattle’s … Continue reading [continue reading…]

References

References
1 Just kidding, that will never happen.
2 Of course, with Thomas in Seattle, one could extend the story beyond just the cornerback position to the defensive back grouping. In addition, both Patriots safety Devin McCourty and Seattle’s other safety, Kam Chancellor, received first-team All-Pro votes, with Chancellor actually being just two votes shy of making the first team, and the leading vote-getter on the second team.
{ 2 comments }

Quite the clickbait title, I know. But given where this post is going, I thought precision was more important than anything else.

Over the last three seasons, Seattle has allowed 15.2 points per game. That’s really, really good. How good?

pa2012

There are flaws with using points allowed as a measure of defensive play, of course. Seattle is known for its long drives on offense, which limits the number of possessions an opponent might have. And the Seahawks offense generally puts the team’s defense in pretty good situations. Using points allowed per drive might be preferable, or using DVOA, or EPA per drive, or a host of other metrics. And adjusting these results for strength of schedule (or, at least, removing non-offensive scores) would make sense, too.

But hey, it’s Friday, and I wanted to keep things relatively simple. [1]In about ten minutes, we can all have a good laugh at this line. Points allowed is a number we can all understand. Given our era of inflating offenses, it’s quite possible that Seattle’s 15.2 points per game average doesn’t stand out as particularly impressive to you. After all, the ’76 Steelers once allowed 28 points over a nine-game stretch! But consider that since 2012, the NFL average has been 22.6 points per game, which means the Seahawks have allowed 7.4 fewer points per game than the average defense.

How good is that? [continue reading…]

References

References
1 In about ten minutes, we can all have a good laugh at this line.
{ 11 comments }

The physicist Werner Heisenberg (this guy, not this guy) found that observers affect the systems they attempt to measure, something that is related to but actually separate from his Uncertainty Principle. Even if Heisenberg was thinking about submicroscopic particles whizzing around, his ideas can still apply to writing about NFL betting. Writing about my bets could change the sequence of events that follow, at least in theory, just like all the other actions people take everywhere that put the world on a different course. The NFL season that just unfolded was just one of an infinite number of potential seasons that could have happened. In what share of the possible seasons did my pick for the NFL’s worst team start the season 9-1? Am I just the worst predictor ever, someone dumb enough to underestimate the great Arians and the new great HC of the NYJ? Or was I tempting fate by writing about real bets?

Since I am supposed to be a coldly-rational, data-driven guy, I am going to chance it and review my NFL betting this year. This is risky since my betting year could still be saved by events yet to be determined. Before I get to all that, I am hoping that maybe my writing about football can influence something much more plausible, namely whether I attend the Super Bowl next week. Apologies for this distraction, but I could really use some help.

***HUMBLE REQUEST BEGIN***

If you have read any of my stuff here or on Football Outsiders, you may know that I am a Patriots fan. Sufficiently dedicated to have flown from Los Angeles to Boston for the Ravens game, then back to LA for the first week at Loyola Marymount, before flying back to Boston for the Colts game. Now I am hoping to obtain two tickets to the Super Bowl. Here is what I can offer: [continue reading…]

{ 6 comments }

This week at the New York Times, a look at the second straight “historically great offense vs. historically great defense” Super Bowl:

Last year’s Super Bowl pitted one of the greatest single-season offenses in N.F.L. history against one of the greatest single-season defenses. Using slightly different time frames, this year’s Super Bowl can boast similar claims.

Both the New England Patriots and the Seattle Seahawks had slow starts in 2014. After New England’s 41-14 loss to the Kansas City Chiefs in Week 4, pundits wondered if we were witnessing the end of the Tom Brady/Bill Belichick-era Patriots. But since that game, the offensive line emerged as a cohesive unit, Rob Gronkowski’s health improved and Brady became red-hot. Since that game, New England has averaged 35.3 points per game, including the playoffs (but excluding the meaningless Week 17 finale, in which the Patriots benched many starters).

From Games 5 to 15 of the regular season, New England scored 379 points, the seventh most during such a stretch of any team since 1970. Then, the Patriots scored 35 points in the team’s first playoff win over the Baltimore Ravens, and 45 last weekend against the Indianapolis Colts. New England joins the 1994 San Francisco 49ers and the 1990 Buffalo Bills as the only Super Bowl participants to average 40 points per game through multiple playoff games before the Super Bowl.

You can read the full article here.

{ 2 comments }

Guest Post: Marginal YAC, 2014 in Review

Adam Steele is back to discuss Marginal YAC, this time in the context of the 2014 season. You can view all of Adam’s posts here.


Manning is more of a downfield thrower than you think

Manning is more of a downfield thrower than you think

Back in September, I posted a three part series introducing Marginal Air Yards and Marginal YAC. Today, I’m going to update the numbers for 2014 and analyze some interesting tidbits from the just completed season. [1]A big thanks to Chad Langager at sportingcharts.com for helping me compile this data.

League-wide passing efficiency reached an all-time high in 2014 with a collective 6.13 Adjusted Net Yards per Attempt average. However, this past season was also the most conservative passing season in NFL history; 2014 saw the highest completion rate ever (62.6%), the lowest interception rate ever (2.5%), and also the lowest air yards per completion rate ever (5.91 Air/C). Passing yards were comprised of 51.4% yards through the air and 48.6% yards after the catch, the most YAC-oriented season in history. [2]Even though YAC data only goes back to 1992, I feel safe in using the phrase “all-time” with regard to YAC dependency. The offensive schemes of yesteryear emphasized downfield passing, which … Continue reading This trend shows no sign of reversing itself, so expect more of the same in 2015.

Here are the 2014 Marginal Air Yards (mAir) and Marginal YAC (mYAC) for quarterbacks with at least 100 pass attempts. The 2014 leader in Marginal Air Yards is…Peyton Manning? Yes, the noodle-armed, duck-throwing, over-the-hill Peyton Manning averaged 4.54 Air Yards per pass Attempt; given that the average passer on this list averaged 3.70 Air Yards per pass Attempt, this means Manning averaged 0.84 Air Yards per Attempt over average. Over the course of his 597 attempts, this means Manning gets credited with 500 marginal Air Yards, the most of any quarterback in the NFL. [continue reading…]

References

References
1 A big thanks to Chad Langager at sportingcharts.com for helping me compile this data.
2 Even though YAC data only goes back to 1992, I feel safe in using the phrase “all-time” with regard to YAC dependency. The offensive schemes of yesteryear emphasized downfield passing, which generated far less YAC than the short passing games of today.
{ 12 comments }

Probably was picked off

Probably was picked off

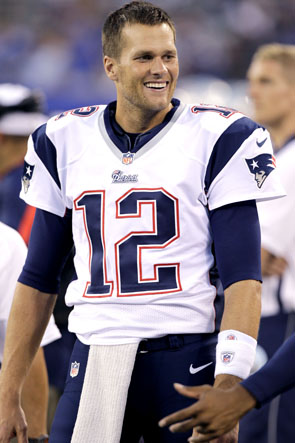
I still can’t quite comprehend what happened. Leading 19-7 with less than three minutes remaining, Green Bay somehow lost the NFC Championship Game. It was the most remarkable comeback in conference championship game history since at least 2006, when Peyton Manning and the Colts came back from the dead against the Patriots.

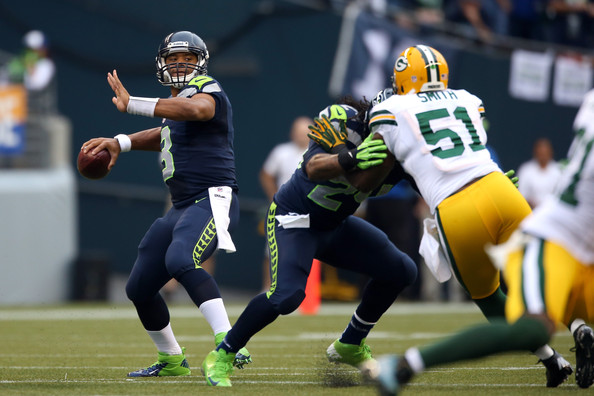
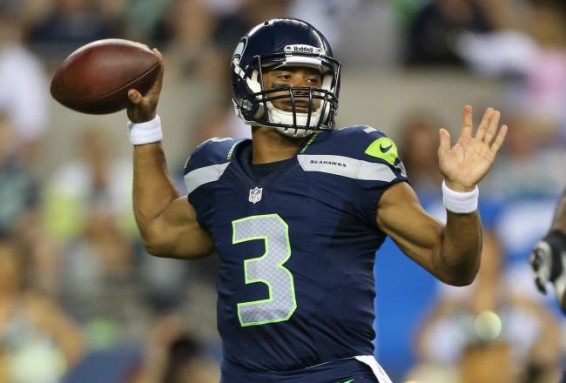
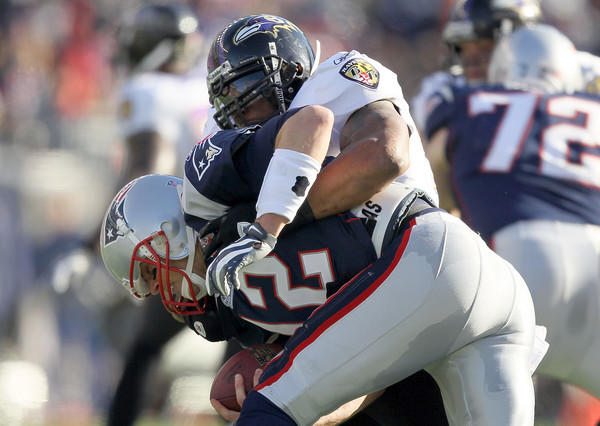
But this game had the added element of Russell Wilson looking like he had no idea what he was doing out there. With four minutes remaining, Wilson had one of the ugliest stat lines in playoff history: he was 8/22 for 75 yards with no touchdowns, four interceptions, and four sacks for 24 yards. He was averaging -4.96 Adjusted Net Yards per Attempt. It was worse than Ryan Lindley against Carolina, a performance that would rival Kerry Collins in the Super Bowl against the Ravens for worst playoff passing performance ever.

Wilson’s stat line was straight out of a 1976 boxscore featuring a rookie quarterback against the Steelers. Yet, somehow, minutes later, the game would be in overtime. Wilson ended regulation with a still miserable stat line of 11/26 for 129 yards, with 0 touchdowns (to be fair, he did run one in), 4 interceptions, and 4 sacks for -24 yards. That translates to an ANY/A average (which gives a 45-yard penalty for interceptions, and a 20-yard bonus for touchdowns, while penalizing for sacks) of -2.50.

If the Seahawks returned the overtime kickoff for a touchdown, the game would have easily gone down as the worst performance by a playoff-winning quarterback in history. But in overtime, Wilson did his best work: first, he found Doug Baldwin for ten yards. Then, after taking a one-yard sack, he hit Baldwin on 3rd-and-7 for 35 yards. The next play, Wilson hit Jermaine Kearse for a 35-yard touchdown, and Seattle was headed back to the Super Bowl.

Wilson finished 14/29 for 209 yards, with 1 touchdown, 4 interceptions, and five sacks for -25 yards. That translates to an anemic ANY/A average of +0.71. How does that compare historically? I thought it would be worthwhile to compare the ANY/A average of every winning quarterback in a playoff game to the league average ANY/A that season. So, in 2014, the NFL averaged 6.13 Adjusted Net Yards per Attempt per pass. This means Wilson finished 5.42 ANY/A below average. And given that Wilson had 34 dropbacks, it means that Wilson produced -184 Adjusted Net Yards over average. As it turns out, that’s only the … third worst ever by a winning quarterback. [continue reading…]

{ 19 comments }

Thoughts on the Championship Games

On conference championship Sunday, it’s easy to pick the home teams, particularly when they are the number one seeds and touchdown favorites. That logic is further supported in a case like 2014, where the favorites have histories of success against these particular underdogs.

But conference championship game Sunday is not immune to upsets. The graph below shows the average point spread of each winner in a conference championship game since 1978. Based on the line data I have (which comes from PFR), there have been a pair of touchdown underdogs in recent memory: the 2012 Ravens and 2007 Giants.

ccg hist

In recent history, conference championship games have been viewed as much closer than what we see in 2014, where the Seahawks are 8-point favorites and the Patriots are currently at -6.5. To find a semifinal weekend where both favorites were giving at least six points, you have to go back to 2007, when the Patriots and Packers were also playing. That day, the Giants pulled off the huge upset in Green Bay, while New England handled San Diego. [continue reading…]

{ 0 comments }
The Seahawks have met high expectations this year, thanks to #3

The Seahawks have met high expectations this year, thanks to #3

Nobody is surprised to see the New England Patriots or the Seattle Seahawks hosting games on championship Sunday. The Patriots are in the AFC title game for the 9th time in 14 years — NINE times! That is insane. Only six other teams — the Steelers, 49ers, Cowboys, Raiders, Broncos, and Rams — have been to nine conference championship games since 1970, a feat New England has matched since 2001.

Perhaps even more incredibly: on Sunday, Foxboro will be the site of the AFC title game for the 7th time in 14 years. Since 1970, just two other cities — Pittsburgh and San Francisco — can match that claim. For some perspective, New York has hosted just two conference title games — the Giants in ’86 and ’00.

Oh, and if you’re counting at home, this will also be the fourth straight year with the Patriots in the AFC Championship Game. Ho hum.

As for Seattle? The Seahawks are the defending champions, and were arguably the top team in football by the end of the 2012 season, too. Seeing Seattle in the NFC Championship Game is no surprise to any football fan.

The Packers and Colts are only slightly more surprising participants. At the start of the season, Green Bay was tied with New Orleans for having the third best odds (behind Seattle and San Francisco) for winning the Super Bowl; the Colts were a distant third behind the Denver/New England tier in the AFC, but still, no other AFC team was as clear a Super Bowl contender after the Broncos and Patriots as Indianapolis. The table below shows the odds (from Bovada) each team was given to winning the Super Bowl at various points in the off-season; the final two columns display what percentage those odds convert to, both before and after adjusting for the vigorish: [continue reading…]

{ 0 comments }

Guest post: Expected Touchdowns

Munir Mohamed, a reader of Football Perspective, is back for another guest post. And I thank him for it.


Methodology: I looked at the expected touchdown rate on each yard line from inside the five-yard line in goal-to-go situations, then assigned touchdowns over expectation based on the number of scores above or below average the expected rate. For example, passes from the 1-yard line score a touchdown 50% of the time. Therefore, if a quarterback throws a touchdown when the line of scrimmage is the one, he receives +0.5 touchdowns over expectation. If he didn’t throw a touchdown, he is credited with -0.5 touchdowns over expectation. The numbers in this article are from 1998-2014. Note that touchdowns, like nearly every other statistic in football, is a reflection of not just a player, but his team. A player who scores highly in this metric may simply be great at scoring touchdowns, may have played with coaches or teammates who significantly aided his production, may be lucky over a small sample size, or a combination of several of those factors. But we can discuss the reasons behind the data in the comments: let’s get to the data, and begin with passing touchdowns. [continue reading…]

{ 1 comment }
Brady was happy to have the game put in his arm on Saturday

Brady was happy to have the game put in his arm on Saturday

Every week during the season, I compile Game Scripts data, which measures the average points margin during every second of every game. Since most people don’t have a chance to watch every game, it’s helpful to have this information.

During the playoffs, most of us are watching each game, so we know what’s going on. But after two weeks, I thought it was still worthwhile to check in on the numbers. There have been two big comebacks during the playoffs: the Cowboys against the Lions during the wildcard round, and the Patriots against the Ravens last weekend.

The Dallas comeback against Detroit would rank as the 4th biggest comeback of 2014, or the 4th worst Game Script produced by a winning team. Those with longer memories may recall that in 2011, the Lions beat the Cowboys despite having a Game Script of -9.4, and last year, the two teams scored 41 combined fourth quarter points. In other words, don’t turn off the game early when the Lions and Cowboys are playing.

The Patriots also pulled off a big comeback. New England trailed 14-0 and for most of the first half, and entered the locker room down seven. The Patriots are no strangers to these sorts of comebacks, though: since 2001, New England has the third best winning percentage when trailing at halftime by between 7 and 14 points.

Here are the full numbers from the first two rounds of the playoffs:

TeamH/ROppBoxscorePFPAMarginGame ScriptPassRunP/R RatioOp_POp_ROpp_P/R Ratio
INDCINBoxscore2610167.8452564.3%382164.4%
CARARIBoxscore2716115.8333945.8%321568.1%
SEACARBoxscore3117145.8242747.1%382956.7%
BAL@PITBoxscore3017134.6302554.5%531973.6%
IND@DENBoxscore2413113.8432860.6%482070.6%
GNBDALBoxscore26215-0.4362955.4%232845.1%
NWEBALBoxscore35314-4.8531380.3%452861.6%
DALDETBoxscore24204-8.1372163.8%452267.2%

[continue reading…]

{ 0 comments }

John Fox went 13-3 in 2012, 13-3 in 2013, and then 12-4 in 2014 as head coach of the Denver Broncos. But with a 2-3 playoff record during that time, John Elway shockingly fired the head coach.

As Bill Barnwell noted, it’s very rare for a coach as successful as Fox to be fired. While Barnwell took a big picture view, I thought it would be interesting to look at coaches who were fired immediately after a successful season: in this case, winning 12 or more games. As it turns out, it’s happened just two times before in NFL history. Marty Schottenheimer was fired by San Diego after going 14-2 in 2006, but losing in the team’s first playoff game to New England. And Jimmy Johnson was allowed to move on despite going 12-4 and winning a second consecutive Super Bowl in 1993.

The table below shows all coaches who won at least 10 games (or had a winning percentage of at least 0.625) in a season from 1970 to 2013, but who were not patrolling the same sidelines a year later: [continue reading…]

{ 14 comments }

This week at the New York Times, a look at the two matchups this weekend, arguably pitting the most valuable quarterbacks against the most talented teams.

At Stanford, Andrew Luck was immensely hyped as the next great quarterback prospect. The Indianapolis Colts selected him with the first overall pick in 2012, and remarkably, Luck has managed to meet even the highest of expectations. After helping turn a 2-14 team in 2011 into a playoff team in 2012, Luck won his first playoff game during the 2013 season and has now guided the Indianapolis Colts to the A.F.C. championship game.

Just 25 years old, Luck threw for a league-high 40 touchdowns during the regular season. On Sunday, against the heavily favored Denver Broncos, he delivered another strong performance, throwing for two touchdowns and guiding an offense centered on the passing game.

Luck is perhaps the most important person to his franchise of any player in the N.F.L. But it is Green Bay quarterback Aaron Rodgers, and not Luck, who is likely to be named the league’s most valuable player this month. Rodgers averaged 7.68 net yards per attempt during the regular season, the highest in football. Rodgers also led the N.F.L. in interception rate (a minuscule 1.0 percent) and finished second to Dallas’s Tony Romo in touchdown rate (7.3 percent).

You can read the full article here.

{ 2 comments }

Guest Post: Are Interceptions Overrated?

Guest contributor Adam Steele is back again. You can read all of Adam’s articles here.


Are Interceptions Overrated?

There’s nothing worse than throwing an interception. Everyone seems to agree on this, from fans to media to advanced stats guys. But is it really true? In this quick study, I looked at the tradeoff between interception avoidance and aggressive downfield passing to see which strategy has a larger impact on winning. To measure this, I created two categories of quarterbacks: Game Managers and Gunslingers.

First, the Game Managers, which includes all post-merger quarterback seasons with an INT%+ of at least 110 [1]Which means the player was at least 0.67 standard deviations better than league average at avoiding interceptions. and a NY/A+ of 90 or below (min 224 attempts). [2]Which means the player was at least 0.67 standard deviations worse than league average in net yards per attempt. These guys avoided picks but failed to move the ball efficiently, the hallmark of a conservative playing style.

[continue reading…]

References

References
1 Which means the player was at least 0.67 standard deviations better than league average at avoiding interceptions.
2 Which means the player was at least 0.67 standard deviations worse than league average in net yards per attempt.
{ 27 comments }

Manning returns to face his former team

Manning returns to face his former team

Today, Peyton Manning will face off against his former team, the Indianapolis Colts, in a playoff game. This is actually the 3rd time Manning has played in a Colts/Broncos playoff game — Manning is 2-0 — but the first time he is facing his former team in the playoffs. This will be just the 4th time that has happened in NFL history.

In 1960 and 1961, Jack Kemp quarterbacked the Chargers to the AFL Championship Game, ultimately losing both times to the Houston Oilers. Then, in 1964 and 1965, Kemp reached the AFL Championship Game again, only this time, the San Diego Chargers were his opponent! Both times! That’s right, in four of the first six seasons, Kemp started in the AFL title game either for or against the Chargers. And in all four games, San Diego went 0-4, as Kemp’s Bills defeated the Chargers, in both games, on the strength of some dominant Buffalo defenses. San Diego did win the AFL title in 1963, otherwise that would go down as one of the saddest stretches in championship game history. [continue reading…]

{ 1 comment }

My from-the-gut thoughts on this weekend’s games, which of course will also flavor my fantasy decisions.

Seattle/Carolina: It’s easy to get burned by being too cute. Sometimes, things are so obvious that we start to look for contrarian takes. To review: Seattle finished with the best record in the NFC, atop the 538 Elo Ratings, and first in Football Outsiders’ DVOA ratings. As the defending champions, the Seahawks obviously pass the eye test. The defense seems to be playing at 2013 levels, while the offense remains quietly effective.

Carolina is one of the worst playoff teams in NFL history. The Panthers won a terrible division with a 7-8-1 record; Carolina went two full months without winning a game. It is hard to come up with a larger mismatch, at least on paper. Seattle is favored by “only” 10.5 points, but that’s a reflection of Seattle not being a high-scoring team, not indecision about the Seahawks ability.

There have been 25 games in NFL playoff history where a team was favored by double digits and the over/under was also less than 45 (the over/under here is actually quite a bit lower, at 40). The favorites have gone 23-2 in those games, with both upsets being memorable: the 2001 Patriots winning in the AFC Championship Game against the Steelers, and the Jaguars shocking the Broncos in the second round of the ’96 playoffs. That is the sort of enormous upset it would be if Carolina could win, and let’s not forget that the Seahawks are also 24-2 at home over the last two years.

These home teams are 17-8 against the spread, too. I’ll be taking Seattle, and frankly, a blowout win is much more likely, in my opinion, than a Panthers win. The only question that remains: do you take Russell Wilson or Marshawn Lynch in your FanDuel lineups? Wilson has more paths to success, of course, and Lynch has struggled against Carolina over the past three years. On the other hand, a dominant home win typically means big numbers for Lynch. In tournaments, you probably don’t want both, but in 50/50s or cash games, I don’t have a huge issue with that strategy. The other must-play in FanDuel this week, due to salary, is the Seattle D. The Seahawks are $5200, and every other defense is at least $4500; given that Seattle is such a strong play this week, it’s hard to imagine it making sense to keep them out of a lineup. [continue reading…]

{ 0 comments }
Tom Brady has been known to wear Suggs

Tom Brady has been known to wear Suggs

Disclaimer: Quarterbacks don’t have records, teams do. A quarterback’s “record” is simply shorthand for saying “the record of a quarterback’s teams in all playoff games started by that quarterback.” Please forgive me for using that shorthand for the remainder of this post.

Eight years ago, Doug Drinen wrote a fun post in advance of the 2006 AFC Championship Game. At the time, Peyton Manning had gone 0-2 in playoff games against Tom Brady, so Doug looked at quarterbacks who had gone winless against another particular quarterback in the postseason.

Manning wound up beating Brady in that game, and evened his record against Brady in the 2013 playoffs. No pair of quarterbacks have ever met as starters five times in the playoffs, so Brady/Manning are tied for the most playoff meetings. Joining them on Saturday will be Brady and Joe Flacco. This weekend’s game will be the fourth time since 2009 that the Ravens have traveled to Foxboro in the postseason, and Brady and Flacco have been under center for each game. [continue reading…]

{ 7 comments }

It’s Time for the Cowboys To Fire Jason Garrett

Garrett should be handing in his letter of resignation if he had any honor

Garrett should be handing in his letter of resignation if he had any honor

I waited patiently all week, but it appears no one else has the guts to write what needs to be written: it’s time for the Cowboys to fire Jason Garrett.

On Sunday, the Dallas Cowboys hosted the Detroit Lions in the first round of the playoffs. The Cowboys were the more talented team, and were favored by 6.5 points to win the game. And, despite Garrett’s best efforts, the Cowboys did manage to escape with a victory. But Garrett’s blunders nearly cost the team not once, but twice, and there’s little evidence to indicate that Garrett has learned from his mistakes.  If the Cowboys ever want to win a Super Bowl, the team needs to move on from Garrett.

Mistake #1

With just under four minutes left in the 3rd quarter, the Cowboys trailed the Lions, 17-7. On 3rd and goal from the 1-yard line, Garrett called a running play for DeMarco Murray, who was stuffed by Ndamukong Suh for no gain. Given that the Lions have the best run defense in football, this isn’t too surprising.

Trailing by 10, the Cowboys obviously still needed two scores, so the correct move, of course, is to take the three points. Yet despite this being the sort of basic math that a third grader could decipher, Garrett essentially took the three points off the board and chose to go for it on 4th down. [continue reading…]

{ 61 comments }

The Steve Smith Postseason Post

Today’s guest post comes from Adam Harstad, who is also part of the Smitty Fan Club. You can follow Adam on twitter at @AdamHarstad.


One of the greatest playoff receivers ever

Smith considers letting the chip roll off his shoulder.

IS STEVE SMITH THE GREATEST POSTSEASON WR IN HISTORY?

Prior to this last weekend’s slate of games, I remarked to several friends what a treat it was that we got to watch Calvin Johnson, Larry Fitzgerald, and Steve Smith all playing on the same weekend. In addition to being three of the best receivers of the last decade, all three could lay claim to the best per-game postseason numbers in history, depending on where you set the cut-offs.

Calvin Johnson had only appeared in one postseason game prior to this season, but he made it count with 12/211/2 receiving in a losing effort. Calvin was actually the fourth player in history to top 10 receptions, 200 yards, and 2 touchdowns in a single playoff game, [1]Oddly, all four receivers to reach those marks were active this past weekend; in addition to Calvin Johnson, they were Reggie Wayne, Steve Smith, and T.Y. Hilton. but each of the three previous have played additional games to bring their per-game numbers down. Among players who appeared in at least one playoff game, Calvin’s 211-yard “average” was the best by a mile.

If you moved the cutoff to 6 games, Larry Fitzgerald’s postseason averages took over the spotlight. Following the 2008 NFL season, Fitzgerald had arguably the greatest postseason run by a wide receiver, hauling in 6/101/1, 8/166/1, 9/152/3, and 7/127/2 in his four games, including what would have been the Super Bowl-winning touchdown and a likely MVP performance if not for some heroics from Ben Roethlisberger and Santonio Holmes. Fitzgerald followed that up with a strong showing in the 2009 playoffs, catching 12/159/2 over two games. All told, Fitzgerald had 53/705/9 receiving in just six postseason appearances, for a per-game average of 8.8/118/1.5. [continue reading…]

References

References
1 Oddly, all four receivers to reach those marks were active this past weekend; in addition to Calvin Johnson, they were Reggie Wayne, Steve Smith, and T.Y. Hilton.
{ 1 comment }

Packers, Cowboys, and Undefeated Home/Road teams

The Packers went 8-0 at home this year. Green Bay scored 318 points in home games in 2014, the 3rd most by a team in NFL history. Aaron Rodgers threw 25 touchdowns and 0 interceptions in those games, and his 133.2 passer rating at home is the highest in a single season in NFL history.

A couple of minor notes for the anti-Green Bay crowd: the 2011 Packers scored 321 points en route to an 8-0 home record, while Rodgers’ 128.5 home passer rating is now the second highest ever. And the Packers lost their first playoff game, at home, to the NFC East champion that season.

This year, the NFC East champion Cowboys scored 275 points in road games, the 4th most ever. Dallas also went 8-0 on on the road, making this weekend’s matchup just the 3rd time in NFL history that an undefeated road team traveled to the site of an undefeated home team for a playoff game. [continue reading…]

{ 9 comments }

It is not a reach to predict Beckham taking home OROY despite missing three games.

It is not a reach to predict Beckham taking home OROY despite missing three games.

Odell Beckham was the best rookie in the NFL this year despite missing a quarter of the season. Over the last eleven weeks of 2014, he led the NFL in receiving yards, and finished second in receptions and receiving touchdowns. He will very soon be named the Offensive Rookie of the Year, which made me wonder: how often has a player won a major award despite missing at least three games in a season?

If we exclude the Walter Payton Man of the Year, the Super Bowl MVP, and Comeback Player of the Year awards, [1]For those curious, Tedy Bruschi, Greg Ellis, Doug Flutie, Tommy Kramer, Jim McMahon, Joe Montana, Jim Plunkett, and Michael Vick have all won that award despite missing games — or, perhaps in … Continue reading my database identifies six players who have won an award despite missing at least three games. [2]This excludes the 1987, when just about every player missed three games due to the players’ strike. Four of them won the defensive rookie of the year award, while the other two were quarterbacks.  In reverse chronological order… [continue reading…]

References

References
1 For those curious, Tedy Bruschi, Greg Ellis, Doug Flutie, Tommy Kramer, Jim McMahon, Joe Montana, Jim Plunkett, and Michael Vick have all won that award despite missing games — or, perhaps in some cases, because of missing those games.
2 This excludes the 1987, when just about every player missed three games due to the players’ strike.
{ 5 comments }

This week at the New York Times, an early look at the division round of the playoffs:

In 1990 the N.F.L. switched to its current playoff format, featuring six teams from each conference, with the top two seeds earning first-round byes.

For the first 15 years, this structure appeared to provide an enormous edge for the top two seeds: Teams coming off byes won 81.7 percent of all games in the division round of the playoffs from 1990 to 2004.

Then, over the next six seasons, the rested teams were 12-12 and it seemed as though being “hot” negated any advantage teams gained from a week off. In the last three postseasons the pendulum has swung back, with three bye teams winning each year. Last year, all four favorites were victorious in the division round of the playoffs, with the road 49ers winning at Carolina as 1-point favorites.

This year projects to mark a return to the old days. For the first time since 2007 all four home teams in the division round are favored by at least 4 points, and any more than one upset would qualify as shocking. So while the home teams are heavily favored this weekend, here is one tidbit to keep in mind for each game.

You can read the full article here.

{ 0 comments }
Ryan  Lindley imploded against the Panthers in the Wildcard Round

Ryan Lindley imploded against the Panthers in the Wildcard Round

Ryan Lindley had a very, very bad day against the Carolina Panthers on Saturday. He completed 16 of 28 passes for just 82 yards, with one touchdown and two interceptions. He was also sacked four times and lost 31 yards. Assigning 20 yards per passing touchdown and -45 per interception, and including the sack data, this means Lindley produced -19 adjusted net yards. Given his 32 dropbacks, that translates to a -0.59 ANY/A average.

Which, of course, is really bad. The fact that it came in the most pass-friendly era in history makes it look even worse, although that’s slightly tempered by the fact that the Panthers have an above-average defense. We can combine the era- and SOS-adjustments in one step by noting that Carolina allowed 5.84 ANY/A to opposing passers this year. As a result, this means Lindley fell 6.45 ANY/A short of what we would expect, given the Panthers defense and this era. Over the course of 32 dropbacks, that means Lindley produced 206 Adjusted Net Yards below expectation.

Using that methodology for every playoff game since 1950, Lindley’s mark is the 9th worst in playoff history. The worst? That belongs to Kerry Collins in Super Bowl XXXV. Here’s how to read the table below. Collins averaged -2.19 ANY/A against the Ravens over the course of 43 dropbacks; the Baltimore defense, of course, was very good against the pass, allowing just 3.88 ANY/A. Still, that means Collins fell 6.07 ANY/A short of expectation. Over 43 dropbacks, that’s -261 ANY below what we would expect given the Ravens defense, the worst ever.

One final note: in the table below, you can click on the “Year” cell for each player to go to the boxscore for that game. [continue reading…]

{ 13 comments }
Previous Posts