≡ Menu

Passing Distribution Through Three Weeks

A good comment by reader Mark Growcott this week noted that running backs are catching a lot of passes so far in 2018. Mark noted that running backs have more catches through three weeks than in any season since 2010.

I went ahead and calculated the receptions per game by running backs, tight ends, and wide receivers for the first three weeks of each season since 2002. Since not every team played three games in the first three weeks of each season, the data is presented on a per-game basis. As you can see, 2018 is a great year for running backs in the receiving game, but… it’s also a great year for every position in the receiving game: [continue reading…]

{ 0 comments }

Championship Leverage, Part 2


Back in June, I wrote about Championship Leverage in the NFL. My particular interest was determining the value of a postseason game relative to that of a regular season game (and vice versa). In the original formula, I used a figure for wildcard games that was not intuitive to me. After careful consideration and discussing it with my readers, I have tweaked the formula to change the 8.33% odds in the wildcard round to 6.25% odds. This means seasons since 1978 now have a higher weight for postseason games. Nothing else has changed yet.

Championship Leverage

Read the table below thus: In the 2017 NFL, there were 11 playoff games, 16 scheduled regular season games per team, and 32 teams. That means a generic regular season game changes a team’s odds of a title by 0.244%, and a first round playoff game is worth 25.60 times more than a regular season game (in this case, that’s the wildcard game. Relative to a regular season game, the divisional round is worth 51.20, the championship round is worth 102.40, and the championship is worth 204.80. [continue reading…]

{ 0 comments }

Cam Newton And Rushing First Downs

Building on yesterday’s post, one reason the average football fan undervalues quarterback running is because yards per carry for quarterbacks is misleading.  It’s natural to want to compare a quarterback’s yards per pass average to his yards per rush attempt average; in almost all cases, the Y/A number will be higher, so it doesn’t feel like having 30 pass attempts and 5 runs is better than 35 pass attempts.

But yards per carry also undersells the value of the average quarterback run. Russell Wilson, for example, has 585 career runs for 3,296 yards, a 5.63 average.  But 84 of his career rushing attempts were actually kneel downs that lost 95 yards; remove those, and Wilson’s yards per carry average jumps to 6.77.  Wilson has also picked up a first down on 39% of his runs, which is extremely valuable, as no offense averages such a high first down rate.  By comparison, Wilson has averaged 7.8 yards per pass attempt and a 37% first down rate on pass attempts, which drops to 6.65 and 34% once you include sacks. [1]I note that it gets into a gray area here: if we include scrambles as runs, but only include sacks in the pass attempts column, we are biasing things in the direction of runs. [continue reading…]

References

References
1 I note that it gets into a gray area here: if we include scrambles as runs, but only include sacks in the pass attempts column, we are biasing things in the direction of runs.
{ 0 comments }

Cam Newton and Modified Completion Percentage

Since entering the league in 2011, Cam Newton has been one of the better quarterbacks in the NFL. But you wouldn’t know it if you looked at his completion percentage, which ranks as just the 36th best out of the 40 passers with the most attempts since the start of 2011 through week 3 of 2018.

In the past, I have offered up the idea that, in some instances, it may be appropriate to consider categorizing rushing attempts as equivalent to pass attempts completed to the quarterback. There are a couple of reasons for that. One, a mobile quarterback may scramble while an immobile quarterback would throw a check down to a running back; in other words, the plays are equivalent, but the immobile quarterback will have his completion percentage increased. Two, the perceived benefit to a quarterback with a high completion percentage is lower variability; rushing plays have lower variability, too, so labeling a rushing attempt as a pass to the quarterback helps reflect that.

One issue with this, though, is you need to remove kneels from the data. Thanks to Bryan Frye, we can do that. Let’s look at Newton. Since 2011, he’s completed 2,065 passes out of 3,515 attempts, a 58.7% completion rate. But he also had 783 carries for 4,545 yards (after removing kneels); if you count those as completed passes, his modified completion percentage would be 66.3%. If you want, you can also label his sacks as incomplete pass attempts. That would drop him down to 62.5%.

The table below shows the 40 quarterbacks with the most pass attempts since 2011. [continue reading…]

{ 1 comment }

Week 3 (2018) Game Scripts: Minnesota Sets A New Record

Previously:

The Buffalo Bills pulled off one of the most remarkable upsets in NFL history in week 3, beating the heavily-favored Vikings 27-6. That game was notable for a lot of reasons on the Bills side, but here’s something interesting on the Minnesota side: the Vikings had just six rushing attempts all game, including just one in each of the final three quarters of the game. Minnesota running backs finished the day with just four carries:

 
Tm Opp
Quarter Time Down ToGo Location Score Detail Yds
Vikings Bills 1 7:24 1 10 MIN 25 0-10 Latavius Murray right guard for 2 yards (tackle by Matt Milano) 2
Vikings Bills 1 6:46 2 8 MIN 27 0-10 Mike Boone left tackle for no gain (tackle by Lorenzo Alexander and Jordan Poyer) 0
Vikings Bills 1 4:38 2 7 MIN 28 0-17 Mike Boone left tackle for 11 yards (tackle by Micah Hyde) 11
Vikings Bills 2 6:11 1 10 MIN 17 0-27 Latavius Murray left tackle for -1 yards (tackle by Tremaine Edmunds) -1
Vikings Bills 3 14:33 2 1 MIN 31 0-27 Kirk Cousins for 1 yard. Kirk Cousins fumbles, recovered by Kirk Cousins at MIN-26 1
Vikings Bills 4 15:00 1 10 MIN 31 0-27 Kirk Cousins left end for 2 yards (tackle by Micah Hyde) 2

The Vikings had 59 passing plays, on the other hand, which means over 90% of all Minnesota plays in week 3 were passing plays (in fact, the two Cousins runs were one scramble and one fumbled snap, so the Vikings ended the day with only four designed running plays). How remarkable is that? Well, it’s the first time in the history of the NFL that it’s happened! The Vikings ran on just 9.2% of all plays (again, generously counting the two Cousins runs as running plays), breaking the previously low of 10.3%, set by the Cardinals against the… 2006 Vikings.

Also super pass-happy in week 3: the Indianapolis Colts, despite (or because?) Andrew Luck setting a career low in yards per completion.  The Colts-Eagles game was tied after the 1st and 3rd quarters, with Philadelphia holding just a 3-point lead at halftime.  In other words, this was a really close game…. and yet Indianapolis passed on 77% of its plays!  That is quite unusual, and represents an extremely pass-happy game (albeit one where the passes were mostly short passes that operated as runs).

The full week 3 Game Scripts data: [continue reading…]

{ 0 comments }

Here was Matt Ryan’s stat line in week 3: 26 completions on 35 attempts, 359 passing yards, 5 TDs, 0 INTs, 146.3 passer rating, 12.08 ANY/A.

Somehow, Ryan’s Falcons lost. There have been 93 teams in NFL history to average at least 9.0 net yards per pass attempt, throw for 300 passing yards, and have a passer rating of at least 145. Those teams are now 91-2, with Atlanta on the winning side of things in a game against Pittsburgh in 2006.

Or how about this stat: what do you think the record is of quarterbacks who average 10 yards per pass attempt, with 5 TDs, and 0 INTs? Try 50-2, with Ryan now joining Dan Marino in one of his crazy games against the ’80s Jets.

Or what about this: 300 passing yards, no interceptions, and a passer rating of 145? Teams were 117-0 when their quarterbacks did that, until Ryan became the first one to ever lose such a game on Sunday.

So yeah, Matt Ryan had a remarkable game on Sunday, but his Falcons somehow lost. The reason? They were facing Drew Brees, who was nearly as good. This was the second time in three weeks that Brees and the quarterback facing the Saints were two of the best three quarterbacks of the week. If we want to play with a bunch of endpoints, consider: there have been 5 games this season, where a quarterback threw for 370 yards and 3 TDs, with a passer rating of at least 115 and a completion percentage of at least 73%.  Four of those five games came with the Saints on the field.

In between the best (Ryan) and 3rd best (Brees) performances of the week was Ryan Tannehill.  The Dolphins star had a wonderful game, even if his numbers were inflated a bit by a 74-yard touchdown “pass” and an 18-yard touchdown “pass” where the ball traveled about one foot from Tannehill’s hands each time.  Add in an Albert Wilson touchdown pass — he had a remarkable game, too — and it was one of the most efficient passing games in Miami history.

As for the league as a whole?  It was a less remarkable passing week than the historic numbers we saw in week 2, but it was still pretty darn efficient.  The league averaged 6.38 ANY/A, a passer rating of 94.6, and 257 passing yards per game. The table below shows the full week 3 results: [continue reading…]

{ 0 comments }

Something is Wrong With Andrew Luck

Yesterday, Andrew Luck completed 25 of 40 passes for just 164 yards. That is an anemic 6.56 yards per completion average, making him just the 10th player to have such a low average on 25 completions. Once again, that’s Andrew Luck, who ranked 3rd in yards per completion as a rookie in 2012, ranked 5th in the metric in both 2014 and 2016.

Luck missed 9 games in 2015 with first a shoulder injury and then an abdomen/kidney laceration. In 2016, he had a frayed labrum in the preseason, but played in 15 games, missing just one game with a concussion. And in 2017, of course, Luck missed the entire year after shoulder surgery (to, you know, repair the shoulder that caused him to miss zero games in 2016).

Since he’s returned, Luck has had three of the worst games of his career in terms of yards per completion, culminating in yesterday’s career-low.  The graph below shows the yards gained per completed pass for each game of Luck’s career: [continue reading…]

{ 5 comments }

Buffalo/Minnesota Was Supposed To Be A Blowout: And It Was

The Bills/Vikings game today was supposed to be a blowout. Minnesota was favored by 16.5 points, which made a lot of sense: the Vikings are one of the best teams in the league, while Buffalo ranked 31st in scoring (11.5 points/game) and scoring defense (39.0) through two weeks.

Since 1978, there have been 67 games where a team was favored by more than 14 points, and a team won by more than 14 points. Today was the 67th such game, but it was the first where the winning team was the underdog. That’s right: Buffalo pulled the massive upset, winning 27-6 (and leading 27-0 for over 30 minutes until a late Vikings touchdown).

So yes, this is the first time in history (well, since at least 1978) a team has won by 15+ points while being an underdog of 15+ points. The graph below shows all games since 1978 where a team was an underdog of 14+ points. The point spread is on the X-Axis (and remember, an underdog of 16.5 points would be listed at +16.5). On the Y-Axis is the final points differential. As you would expect, much of data is bunched in the bottom right quadrant of the graph — this indicates a large positive point spread on the X-Axis and a large negative points differential on the Y-Axis.  But the Bills/Vikings game was the big outlier, at +16.5, +21. [continue reading…]

{ 1 comment }

Some Thoughts On Interceptions

On Thursday night, Sam Darnold had an ugly performance against the Browns in a 21-17 loss. Darnold completed 15 of 31 passes for 169 yards, with no touchdowns and two interceptions (he also took two sacks). Now, if you didn’t watch the game, you might think Darnold’s two interceptions were the worst part of his game, or the main reason the Jets lost. But that’s not true: Darnold two picks came on his final three passes of the game. With 90 seconds left, the Jets trailed 21-17 with the ball at their own 37-yard line. Darnold was 14 of 28 for 144 yards with no interceptions and two sacks — a still terrible stat line that translated to an average of just 4.5 Net Yards/Attempt.

Yes, Darnold’s interception on the next play cost the Jets a chance to complete a comeback (and his second interception was close to meaningless from a win probability perspective), but the main reason the Jets lost was the ugly play over the first 58:30, not the last 1:30.

Not all interceptions are created equally, and Browns fans know this well. In the season opener, Cleveland had the ball at the Steelers 43 with 23 seconds left in the game. It was tied 21-21, and the Browns had 1st-and-10. The Browns had a great chance of winning, but Tyrod Taylor threw an interception on the next pass, ending Cleveland’s chances of winning the game in regulation.

The next week, Cleveland led New Orleans 12-10 with 5 minutes left in the 4th quarter. The Browns had somewhere between a 3-in-5 and 2-in-3 chance of winning the game at this point, facing 2nd-and-4 from the Cleveland 30-yard line. A moment later, Taylor threw an interception, and now the Saints had a 60-66% chance of winning the game. One could argue that Taylor has thrown the two most impactful interceptions of the season thus far.

The best way to analyze the impact of interceptions is through win probability. But that’s not always easy to understand or readily available, so let’s use some quick workarounds. If nothing else, the analysis here should help provide some context around interceptions.

I looked at all passes that were intercepted over the prior three seasons. [continue reading…]

{ 1 comment }

It has been a horrendous start for the 2018 Arizona Cardinals.  On offense, the team is performing like an expansion team. Consider that through two weeks:

  • The Cardinals rank 31st in ANY/A, ahead of only the Bills.
  • Arizona ranks 31st in rushing yards, ahead of only the Saints.
  • The Cardinals rank 31st in yards per play, ahead of only the Bills.
  • Arizona ranks dead last in offensive yards, with just 350.

Things aren’t much better on defense.

  • Arizona ranks 31st in ANY/A allowed, ahead of only the Saints.
  • The Cardinals rank 28th in rushing yards per game allowed.
  • Arizona ranks 28th in yards per play allowed and 30th in total yards allowed.

But perhaps it’s easiest to see how poorly Arizona’s done this year with a graph. I have plotted each of the league’s 32 teams in the graph below, with their total yards of offense through two games on the X-Axis, and total yards allowed on defense through two games on the Y-Axis. Obviously you want to be low and to the right — gaining a lot of yards while allowing few. Arizona, plotted below in Cardinals colors, is high and to the left. And like, really high and to the left: [continue reading…]

{ 0 comments }

Week 2 (2018) Game Scripts: Los Angeles Domination

Previously:

In week 2, the two best Game Scripts belonged to the two Los Angeles. The Rams blanked the Cardinals 34-0 in the most lopsided game of the week. Arizona was never competitive, and Los Angeles outgained Arizona 432-137, and won the first down battle 24-5. Buffalo didn’t fare much better against the Chargers, falling behind 21-3 after 20 minutes, and trailing by 15+ points for all of the second half until the final minute. This is a good example of how Game Script can tell a more accurate story of a game than the final score: both of these games were blowouts, but the Chargers won by “only” 11 points.

The Titans were the league’s most run-heavy team of the week. Blaine Gabbert threw just 20 passes (he had a sack, and two non-QBs threw a pass for Tennessee), an extremely low number given that Tennessee actually trailed in the 4th quarter of this game. But the Titans were happy to ride Derrick Henry (18 carries) and Dion Lewis (14 carries). Did it work? Not really — neither Gabbert no the running backs were particularly effective. Tennessee won the game on special teams, with a touchdown, winning the time of possession battle, and Houston missing a field goal.

The table below shows the full week 2 Game Scripts data: [continue reading…]

{ 0 comments }

Last week, the Buffalo Bills had the worst quarterback in the NFL. And after switching from Nathan Peterman to Josh Allen, Buffalo had… the second-worst quarterback in the NFL in week two.  Sam Bradford was bad in week 1, but he was really bad in week two: the journeyman quarterback averaged under 5.3 yards per completion, the lowest of any quarterback since 2009.

Meanwhile, Ryan Fitzpatrick and Patrick Mahomes were once again two of the top three passers in the league.  The big story, of course, was that the league as a whole averaged an NFL record 6.99 ANY/A in week two; that means when Matthew Stafford throws for 347 yards and 3 TDs with no interceptions on 53 dropbacks, and averaged 7.07 ANY/A, he was basically average.  That is going to take some time to get used to.

The full week two results, below:

RkQuarterbackTmOppResultAttYdsTDIntSkYdsANY/AVALUE
1Patrick MahomesKANPITW 42-3728326601415.24239
2Ryan FitzpatrickTAMPHIW 27-2133402412912.23183
3Kirk CousinsMINGNBT 29-2948425412138.9497
4Blake BortlesJAXNWEW 31-204537741009.1697
5Philip RiversLACBUFW 31-20272563021610.3497
6Jared GoffLARARIW 34-032354112129.3279
7Kevin ByardTENHOUW 20-1716610008679
8Ben RoethlisbergerPITKANL 37-4260452301108.2375
9Matt RyanATLCARW 31-242827221009.5471
10Derek CarrOAKDENL 19-203228810179.1270
11Andy DaltonCINBALW 34-234226540008.2151
12Deshaun WatsonHOUTENL 17-2032310214217.8932
13Dak PrescottDALNYGW 20-132516010007.25
14Matthew StaffordDETSFOL 27-3053347302187.074
15Cam NewtonCARATLL 24-3145335312177.094
16Tom BradyNWEJAXL 20-3135234202147.031
17Derrick HenryTENHOUW 20-1718000081
18Drew BreesNORCLEW 21-1835243203306.66-13
19Nick FolesPHITAML 21-2748334103136.69-16
20Blaine GabbertTENHOUW 20-172011710186.14-18
21Tyrod TaylorCLENORL 18-2130246113126.33-22
22Ryan TannehillMIANYJW 20-1223168204466-27
23Jimmy GaroppoloSFODETW 30-2726206206506.13-28
24Aaron RodgersGNBMINT 29-2942281104285.93-49
25Sam DarnoldNYJMIAL 12-2041334123145.68-58
26Alex SmithWASINDL 9-2146292003235.49-74
27Case KeenumDENOAKW 20-193522201154.78-80
28Russell WilsonSEACHIL 17-2436226216244.69-97
29Andrew LuckINDWASW 21-93117922123.97-97
30Joe FlaccoBALCINL 23-3455376224175.24-104
31Eli ManningNYGDALL 13-2044279106594.8-110
32Mitch TrubiskyCHISEAW 24-1734200222153.75-117
33Josh AllenBUFLACL 20-3133245125363.66-127
34Sam BradfordARILARL 0-34279001171.36-158
Total117389156521775306.990

This Week In Completion Percentage Is Meaningless

Eli Manning ranks poorly in ANY/A this week despite a sparkling 75% completion percentage.  Do you know why? Because the Giants had one of the worst performances for a team that completed 75% of their passes, at least as measured by simple net yards per pass attempt. New York’s first five drives ended in punts, and the sixth ended in a fumble. The 7th drive was a field goal and the 8th drive was a 3-and-out, before the Giants scored 10 points on their final two possessions. Even still, New York averaged just 3.81 yards per play, the third worst performance by the Giants since the start of the 2015 season.

{ 0 comments }

The Browns Are Favored on Thursday Night Football

Stop the presses: Cleveland is a favorite this week. The Browns host the Jets on Thursday night, and as of Tuesday evening, are 3-point favorites. That is breaking news, and it would really be breaking news if the Browns won. The 2015, 2016, and 2017 seasons, along with the first two games of 2018, give us a nice 50-game sample for Cleveland. And over the team’s last 50 games, they have been favored just four times, and won only one of those games: a win over the Blaine Gabbert/Jim Tomsula 49ers.

On that day, Johnny Manziel was the team’s quarterback.  So yeah, it’s been a long time.  Of course, the Browns have only won 4 (and tied a fifth, of course) of those games, with the last coming back on December 24th, 2016.  That day, Robert Griffin III was the team’s quarterback.

So yes, it’s been a rough few years… or decade… or two decades, for Cleveland.  Over the team’s last 58 games, the Browns have been favored to win and actually won just one time — that game against the 49ers.  There have been a lot of bad days in Cleveland over the years, of course: the graph below shows each Browns game since 2008, along with the pre-game point spread.  Remember, a positive number means the team was the underdog.  In the graph below, you can see that most of the dots are above the 0 line, meaning Cleveland was usually an underdog.   The games that Cleveland won are in white dots with orange borders; the games that Cleveland lost are in brown dots with orange borders.

Do the Browns have a reason to be optimistic since the game is at home and the Jets will have to travel to Ohio on short rest? From 2012 to 2017, there were 87 games played on Thursday night excluding week 1, when both teams have equal rest. In those games, the home team won 49 times (a 0.563 winning percentage), although the home team was favored 52 times and a pick’em once. Of the 52 home teams that were favored, 37 won (0.711) and 28 covered (with 24 failing to cover). When the spread has been tight — the home team favored by between 1 and 3 points — the home team has won 9 of 16 games.

If the Browns manage to win the game, it will be just the second time Cleveland has been favored to — and actually won — a game in primetime.  The second-to-last time the Browns won a primetime game they were favored to win? They did it against a team that doesn’t exist anymore, with Bill Belichick as the head coach.

{ 0 comments }

Yesterday Was The Greatest Passing Day In NFL History

Week 2 is not yet in the books, but NFL teams had the greatest regular season day of passing the league has ever seen.  There were 28 teams playing yesterday and the group completed 711 passes out of 1,006 attempts — an astounding 70.7% completion rate! Those passes gained 7,848 yards, for a remarkable 7.8 yards per attempt average. And these players threw for 55 touchdowns against just 16 interceptions. The average team throws about 550 passes per season. On a per-550 attempt basis, this means the NFL yesterday was at 389 completions for 4,291 yards with 30 TDs and 9 INTs. And remember: this is the average quarterback.

As a whole, the league produced a 105.1 passer rating. Week 2 is not yet in the books, and the Thursday Night game drags the rating down slightly to 103.4, but no matter: week 2 will go down as the best week in NFL history by passer rating.

How do we know? Because prior to this week, the best single week in NFL history by passer rating came in week 10 of the 2010 season, at 94.8. The next three after that: week 12 of 2016 (94.1), week 3 of 2014 (93.9), and week 2 of 2015 (93.8). This week will blow every other week out of the water, and it’s not hard to see why: NFL defenses have been neutered. Penalties are out of control, according to some defenders, and this impacts the passing game in two ways. Quarterbacks are safer than ever in the pocket, as defenders are wary of getting a flag for hitting quarterbacks too low, too high, or even in the middle (a new rule prohibits a defender from using “all or part of his body weight to land on the quarterback immediately after the ball was thrown”). As a result, what used to be a hurried pass or a sack is now an opportunity for a quarterback to stand tall in the pocket and deliver an accurate throw.

In the secondary, things are just as tough, as defensive backs can’t hit defenseless receivers (and a “receiver is considered defenseless throughout the entire process of a catch, up until the player is capable of avoiding or warding off impending contact.”) The NFL also decided to more strictly enforce the illegal contact rule, meaning “a defender cannot initiate contact with a receiver who is attempting to evade him” after five yards. In other words, it’s harder for defensive backs to stop receivers from getting open, and it’s harder for pass rushers to sack quarterbacks.

This didn’t quite show up in week 1 (teams had a passer rating of 82.4). But that just makes this all the more remarkable. Last season, the league average passer rating was 85.1. It was slightly below that in week 1. And then, all of the sudden, a league that never hit a 95.0 passer rating for a week suddenly has a week where teams have produced a 103.4 passer rating. This remarkable turn of events needs to be monitored, as now the average quarterback is putting up Aaron Rodgers numbers (no, really: Rodgers has a career passer rating of 103.9).

On Sunday, there were 28 quarterbacks who threw passes. If you had a passer rating under 105, you ranked outside of the top 14. A remarkable 16 of 28 quarterbacks had a passer rating over 100 (17 if you remove a Nick Foles spike to stop the clock), and 23 of 28 had a passer rating over 95!

Just 5 of the 28 quarterbacks had a passer rating below the 2017 average of 85.1, which might be the most remarkable of all these stats. Welcome to the 2018 NFL, September 16th edition, where over half of the quarterbacks completed over 70% of their passes.

The single most important question facing the NFL right now: is this new level of efficiency here to stay? If so, we are about to enter an era of football that is significantly different than the league that Tom Brady entered in 2000, where the average team completed 58.2% of their passers and had a passer rating of 76.2. But this is what I suspect the NFL wants: quarterbacks and receivers are less likely to get injured, teams will continue to shift towards passing over running, and quarterbacks will look like superstars with record-breaking numbers.

{ 1 comment }

Ryan Fitzpatrick Just Had Two Of His Best Three Games

In the last 8 days, Ryan Fitzpatrick — sorry, journeyman, Harvard graduate Ryan Fitzpatrick — just produced two of the best games of his career.  He had one of the best games in recent memory in week 1, completing 21 of 28 passes for 417 yards and 4 TDs with no interceptions or sacks.  Today, against the defending Super Bowl champions in week 2 of the 2018 season, Fitzpatrick went 27 of 33 for 402 yards with 4 TDs, although he did add one interception and two sacks for nine yards.

Fitzpatrick averaged 17.75 ANY/A in week 1 on 28 dropbacks; if we use the NFL average ANY/A from 2017 as our estimate of what the average will be in 2018, this means he produced 332 Adjusted Net Yards of Value over average. Today, he averaged 12.49 ANY/A on 33 dropbacks, which is a still remarkable 230 ANY over average.

Fitzpatrick started his career with the Rams in 2005, then the Bengals, then the Bills, Titans, and Texans. In Houston, Fitzpatrick had the other remarkable game of his career: he went 24 for 33 for 358 yards and 6 TDs, averaging 14.48 ANY/A in a game against one of his many former teams, the Titans. Given the league average in ’14 of 6.14 ANY/A, this means Fitzpatrick had 276 ANY of value over average.

Then Fitzpatrick went to the Jets, and while he had some good games, it also produced the worst game of his career: a 6-interception disaster against the Chiefs that produced -356 ANY over average.

The graph below shows — color-coded, of course — each game of Fitzpatrick’s varied career.

Are Fitzpatrick’s last two games a mirage? You take a look at the graph and tell me…

{ 0 comments }

Rushing Yards Before And After Turning 27 Years Old

Let Emmitt Smith always stand out as the counterexample to the idea that a heavy workload is bad for a player’s future. Smith is the only player in NFL history to record 2,000 carries before the end of his age 26 season (he also has a record 279 postseason carries through his age 26 season).  And yet Smith remains the only player in NFL history to pick up 9,000 rushing yards from age 27 through the end of his career.

Yesterday, I looked at the question of when is a player’s career half over.  The sample there was all retired players with at least 5,500 career rushing yards and at least 750 rushing yards in their best season.  The most common age to be the “midpoint” of a player’s career was his age 26 season. Today, a look at the amount of rushing yards gained by players through their age 26 season (on the X-Axis), and from their age 27 through the rest of their career (on the Y-Axis).

[continue reading…]

{ 1 comment }

When Is A Running Back’s Career Half Over?

Le’Veon Bell turned 26 years old in February, which means — if he winds up playing much in 2018 — he might be halfway done with his career by the end of this season.

Does that feel like an exaggeration to you?  I looked at all players who had at least one season with 750+ rushing yards, had at least 5,500 career rushing yards, and were retired. And about half of those players had rushed for at least half of their career rushing yards by the end of their age 26 season. That season was by far the most common mid-point, with 34 out 94 players hitting their 50% career mark during their age 26 season. This includes Walter Payton, Barry Sanders, LaDainian Tomlinson, Jerome Bettis, Eric Dickerson, and Marshall Faulk; it’s also where Adrian Peterson and Marshawn Lynch would be had they retired after 2017. [continue reading…]

{ 1 comment }

Week 1 (2018) Game Scripts

The Game Scripts are back! Below are the Game Scripts from week 1:

TeamH/ROppBoxscorePFPAMarginGame ScriptPassRunP/R RatioOp_POp_ROpp_P/R Ratio
BALBUFBoxscore4734424.4403454.1%402066.7%
WAS@ARIBoxscore2461812.9334244%361570.6%
NYJ@DETBoxscore48173111.5233639%521577.6%
NWEHOUBoxscore2720710.1413156.9%383452.8%
KAN@LACBoxscore3828109.2282750.9%522270.3%
TAM@NORBoxscore484087.6283445.2%461378%
MINSFOBoxscore241687.1393254.9%362559%
CARDALBoxscore16886293247.5%352261.4%
PIT@CLEBoxscore212104.7453556.3%473855.3%
JAX@NYGBoxscore201553.6342854.8%392362.9%
MIATENBoxscore272073.2292950%382956.7%
DENSEABoxscore272431.8403255.6%391670.9%
LAR@OAKBoxscore3313201.1342656.7%422265.6%
PHIATLBoxscore18126-0.5372757.8%471872.3%
CIN@INDBoxscore342311-3.1302060%552271.4%
GNBCHIBoxscore24231-9.3411869.5%392759.1%

[continue reading…]

{ 0 comments }

New Head Coaches Went 0-7 In Week 1

There are seven new head coaches this year: Jon Gruden in Oakland, Matt Nagy in Chicago, Pat Shurmur in New York, and Frank Reich  in Indianapolis.  On the defensive side, Mike Vrabel is in Tennessee, Steve Wilks is in Arizona, and Matt Patricia is in Detroit.  In week 1, all seven teams lost, and other than Nagy’s Bears (who nearly upset the Packers despite being 6.5-point underdogs), none of the teams even covered against the spread.  Five of the seven teams lost at home.

The table below shows the 15 teams that lost in week 1, and how they fared against the spread: [continue reading…]

{ 0 comments }

The Jets and Sam Darnold Have A Remarkable Debut

The savior

The Ravens blew out the Bills on Sunday, 47-3, giving Baltimore the biggest win of week one. Baltimore was a 7.5-point favorite, so the 44-point win means that the Ravens covered by 36.5 points.

That’s a lot. Last year, the Rams shocked the Colts with a 46-9 win, covering by 33.5 points.

Last night? The Jets began the Sam Darnold experience in the most ugly way possible: the rookie quarterback from USC threw a pick six on his first pass, something Jets fans are all too familiar with.

And then? It was a script for the ages for the Jets. Darnold went 16/20 for 198 yards with 2 TDs and 0 INTs the rest of the way. Free agent acquisition Isaiah Crowell rushed for 102 yards and 2 TDs on just 10 carries. Quincy Enunwa returned from a devastating injury and had 6 catches for 63 yards and a touchdown. 2016 first round pick Darron Lee, who has had an up and down career, recorded two interceptions, including a pick six. 2017 first round pick Jamal Adams picked up his first career interception. Trumaine Johnson, the team’s big acquisition at cornerback in free agency, had an interception; so too did the team’s big acquisition at cornerback in 2017, Morris Claiborne. Oh, and the Jets added a 79-yard punt return from Andre Roberts.

The Jets won 48-17, with the game ending as both team took knees near the Lions goal line. New York was a 7-point underdog, meaning the Jets covered by a whopping 38 points. That’s more than the Ravens this year or the Rams last year; in fact, it’s the fourth largest cover in opening week history!

In 1987, the Bucs, as 2-point home underdogs to Atlanta, beat the Falcons 48-10, covering by 40 points.

In 1998, in a game that is near and dear to Jets fans’ hearts, New York stunned Seattle 41-3 as 6.5-point underdogs (44.5 point cover) in the opening game of the Bill Parcells era.

Finally, in 1989, the Browns shut out the Steelers 51-0 despite being just 2-point favorites.

For New York, it was the 4th-largest cover in franchise history (or, at least, going back to 1978), behind the Seattle game in ’98, this upset over Houston in 1988, and this upset over the 2002 Chargers.

It was a game that was shocking on just about every level.  The Jets hadn’t scored a defensive or special teams touchdown since 2013; they did both on Monday night.  Since 2000, the Jets had thrown 5 or more interceptions in a game three times, but hadn’t done so to an opposing quarterback since 1999.  They did that to a Pro Bowler in Matthew Stafford (4 INTs) and his backup (Matt Cassel) on Monday Night. The Jets draft history has been disappointing in recent years, but then the team’s last three first round picks all had big nights.

Will this last for the Jets? Probably not. But for one night, it was the game Jets fans dream about. [continue reading…]

{ 0 comments }

If you knew before today that Ryan Fitzpatrick and Nathan Peterman were going to have historic performances today, you probably would have guessed that they would have been historically bad. In that case, you’d be half right.

Let’s start with Peterman, one of the least pedigreed and deserving week 1 starters in recent memory.  Well, against the Ravens, he completed 5 of 18 passes (27.8%) for just 24 yards with 0 TDs and 2 INTs. That’s a -3.67 AY/A average, since interceptions are worth -45 yards. Add in Peterman’s 3 sacks for 12 sacks, and his ANY/A average is -3.71 (sidenote: it’s remarkable that adding 3 sacks of -4 yards each barely moves the needle! That’s how bad Peterman was). It was just the second time since 2016 that a quarterback had at least 14 pass attempts and an AY/A of -3.5 or worse; the first was Peterman in his first start last year against the Chargers.

Perhaps more “impressive” is that even if we ignores the interceptions and the sacks, Peterman was flat out horrible. He gained 24 yards on his 18 attempts, a pitiful 1.33 Y/A average. In 1997, Tony Graziani of the Falcons also threw for 24 yards on 18 attempts (and also threw 0 TDs and 2 INTs); in fact, since 1982, Graziani and Peterman are the only two quarterbacks to throw 18+ passes and average under 1.35 yards per attempt.  Change the thresholds a little bit — say, 15 passes, 1.50 Y/A — and Peterman is still the only quarterback to hit that mark since the end of the 2009 season (and the games in 2009 both involved significant weather).

Buffalo mercilessly pulled Peterman after 10 drives. Those drives yielded one first down and just 21 yards! The Bills opened the season with seven straight three-and-outs!

Given the modern passing environment, I’m not sure a quarterback can do much worse than what we saw yesterday in Baltimore.

On the other hand, we have Ryan Fitzpatrick.    He completed 21 of 28 passes for 417 yards and 4 TDs. He didn’t take any sacks or throw any interceptions, giving him a yards/attempt average of 14.9 and an ANY/A and AY/A average of 17.75!

How good is that? Since 1970, just five quarterbacks have thrown for 400+ passing yards and also averaged 17.7 AY/A or better.  One was Joe Namath against the Colts in 1972, a game that might be the best passing performance game ever considering the era and opponent.  Mark Rypien had a memorable 6-TD game against the Falcons in 1991 and Nick Foles had a 7-TD game against the Raiders; both of those games make the 400/17.7 AY/A cut-off.  The fourth game was Steve McNair in 2003, and the fifth was Fitzpatrick on Sunday.

Fitzpatrick picked up a first down on 17 of his 28 dropbacks. How remarkable is it to gain a first down on 61% of your pass plays? No team did it last season, and just two (2016 Falcons, 2016 Cowboys; one time each) did it the year before.

It remains to be seen how good the Saints are, but let’s say (perhaps optimistically) that New Orleans allows 5.3 ANY/A again this year in all other games. That would mean Fitzpatrick, who had a 17.75 ANY/A average over 28 dropbacks, would have been 12.45 ANY/A above expectation, which translates to 349 Adjusted Net Yards above expectation. That would rank in the top 15 all-time.

So yeah, it was a pretty darn good day for Fitzpatrick and the Bucs offense. And it’s not the only remarkable game of his career: don’t forget the 6 TD, 0-sack, 0-INT game in 2014 where he averaged over 10 yards per pass.

For now, Bucs fans can sit back and enjoy this remarkable drive chart.

{ 0 comments }

Pittsburgh could use this running back.

Things got really ugly this week in Pittsburgh, as Le’Veon Bell remains in a dispute with the Steelers over his franchise tag. Bell is currently refusing to play under the tag, and there is no immediate end in sight.

There is a long-term end in sight, tho: Bell will need to report for the final six games of the season in order to accrue another season of play; otherwise, Pittsburgh could just franchise Bell yet again for the same $14.5M tag after the season.

Bell will come back in November at the latest, which will also make him available to play in the postseason. And that’s where all of this could get interesting. Is it possible that Pittsburgh might wind up better off in the playoffs (assuming they get there, and an opening day tie against the Browns doesn’t engender confidence) if Bell doesn’t have a full workload behind him?

I’m thinking back to Bob Sanders and the 2006 Colts. The hard-hitting safety was one of the best defensive players in the NFL in his prime, but was rarely healthy. In 2005, he was an All-Pro safety; in 2007, he was the AP Defensive Player of the Year. In between? He missed most of the 2006 season due to injury, and the Colts defense suffered for it. Indianapolis ranked 21st in yards allowed, 23rd in points allowed, and 32nd in rushing yards allowed. [continue reading…]

{ 0 comments }

How Long Do Coaches Last After Adding First Round QBs?

Hue Jackson, Todd Bowles, Sean McDermott, Steve Wilks, and John Harbaugh all saw their teams use first round picks on quarterbacks in the 2018 Draft.  But does drafting Baker Mayfield, Sam Darnold, Josh Allen, Josh Rosen, and Lamar Jackson increase the security of the long-term future of those coaches?  How long of a leash does a coach have after adding a first round QB?

From 2002 to 2016, ignoring the three current situations [1]Carson Wentz was taken in the first round of the 2016 Draft, while Patrick Mahomes and Deshaun Watson were taken in the first round of the 2017 Draft. Their head coaches — Doug Pederson, Andy … Continue reading, there were 43 other quarterbacks drafted in the first rounds of those drafts. How long did those 43 coaches last?  As it turns out, most did not last very long.

In four cases — Ken Whisenhunt in 2015 (7 games), Jack Del Rio in 2011 (11), Josh McDaniels in 2010 (12), and Jeff Fisher in 2016 (13) — the head coach didn’t even finish the season! [continue reading…]

References

References
1 Carson Wentz was taken in the first round of the 2016 Draft, while Patrick Mahomes and Deshaun Watson were taken in the first round of the 2017 Draft. Their head coaches — Doug Pederson, Andy Reid, and Bill O’Brien — are all still around, so it’s too early to determine how long they’ll last with their current teams.
{ 1 comment }

The Opposite Trends of Field Goals and Turnovers

There are only a few statistics that have clear long-term trends. And two of them happen to intersect in a notable way.

The NFL used to have significantly more turnovers. Both fumbles lost and interceptions thrown have been declining since the merger, and for the decades before then, too.

Another trend: field goal accuracy has gone up, consistently, for generations. Field goal attempts rose for much of history until 1974 — when the goal posts were moved 10 yards from the front of the end zone to the back — and then began rising again. As a result, made field goals have increased significantly.

There have been varying numbers of teams and games on team’s schedules throughout history, so the best way to think of some statistics is on a per team basis. To avoid too many decimals, let’s look at things on a per-100 team game basis for the remainder of this post.

In 1950, teams made 51 field goals per 100 team games, or just over half a field goal per game (they attempted about 1.2). Also in 1950: teams averaged 373 turnovers per 100 team games! In other words, in a given game, if you picked a random play, it was over 7 times as likely to be a turnover than a successful field goal.

In 1960 (NFL data only), teams made 104 field goals per 100 team games, and committed 286 turnovers. So now a turnover was 2.74 times as likely as a field goal.

In 1970, teams made 131 field goals and committed 243 turnovers per team game, making turnovers 1.85 times as likely as successful field goal tries.

By 1980, we were back down to 107 field goals (remember, the goal posts were now 10 yards back) and 232 turnovers per 100 team games, for a ratio of 2.17 turnovers to every field goal.

In 1990, teams made 132 field goals per team game and had 199 turnovers, the first season where teams averaged fewer than two turnovers per game. This was a ratio of 1.51 to 1.

In 2000, teams kicked 147 field goals per team and and had 188 turnovers, meaning there was only 1.28 turnovers for every successful field goal.

In 2008, teams made 165 field goals per team game and committed just 155 turnovers, the first season where there were more field goals made than turnovers forced.

And last year, in 2017, teams averaged 169 field goals per team game and only 138 turnovers, for a rate of 0.82 turnovers per field goal, the single lowest rate in NFL history.

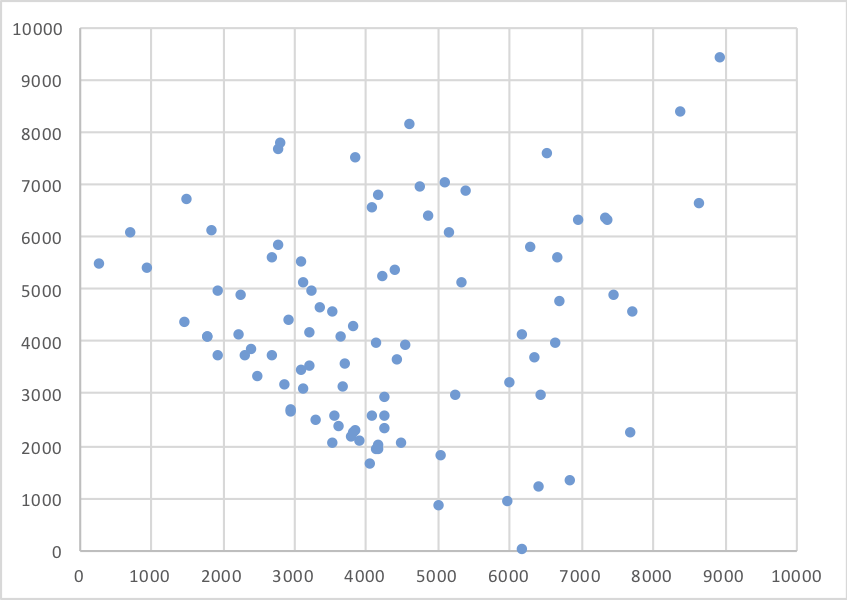
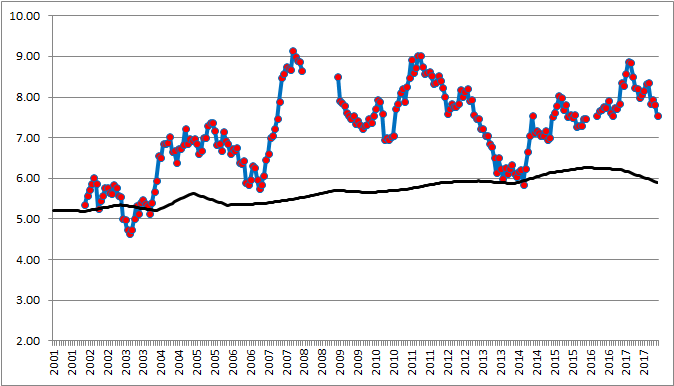
But despite all the words I just wrote, one picture is worth more than all of them. The graph below shows the turnovers committed and field goals made per 100 team games.

Pretty crazy, eh? Entertainment is subjective, of course, but declining turnover rates and increasing field goal rates do not seem like steps in the direction of a more entertaining game.

{ 1 comment }

2018 Super Bowl Odds: The AFC East Sandwich Strikes Again

With opening day kickoff just a few hours away, let’s look at the final pre-season Super Bowl odds.

The Patriots are the Super Bowl favorite for what feels like the 20th season in a row. New England is an 11/2 favorite to win it all, which means if you bet $100 (or $200) on the Patriots to win Super Bowl LIII, you would win $650 (or $1,100). That means the Patriots would need to have a 15.4% chance of winning the Super Bowl to make that an even bet (the result of 2 divided by (2 + 11)). But if you do that same calculation for every team, you’ll see that the total Super Bowl percentages equal 131%; that’s because of the vig, the amount that Vegas deflates the payout in order to make money.

If you divide each team’s percentage taken from their odds by 1.31, you get the implied odds of that team winning it all. For New England, this means the Patriots really have about a 12% chance of winning the Super Bowl, according to the oddsmakers.

The rest of the AFC East? The Bills have the worst chance in the league at 0.4%, while the Jets, Dolphins, and Cardinals are all at 150-to-1, for an implied percentage of 0.5%. In other words, the Patriots odds of winning the Super Bowl are more than 8 times greater than the odds of any other AFC East team’s of winning it all. As usual, we have an AFC East sandwich, with the Patriots on top of the league, the Jets/Bills/Dolphins at the bottom, and the rest of the NFL in between.

Here are the full odds for each team this year, courtesy of Bovada. [continue reading…]

{ 0 comments }

I like to run a contest where I ask you 38 questions, you answer them, and we all look silly after the season. This year, Adam Steele did the lion’s share of the work, and we thank him for that.

Below you will find 38 pairs of numbers. In each case, you tell me which number will be bigger. One point for each correct answer. Most points wins.

Ties — and I expect there to be a nontrivial number of them — go to the side that had fewer votes. For example, here is a pair:

Number of wins by the Lions
Number of wins by the Ravens

Let’s say 49 people take the Lions and 44 take the Ravens. If the Lions and Ravens end up with the same number of wins, then each Ravens-backer will get a point and each Lions-backer will not. Last year, JimZornsLemma won with 25 correct guesses out of 38; the average was just 19 correct guesses. Thanks to Jeremy De Shetler for an assist on some of this year’s questions.

GRAND PRIZE: the main prizes will be (1) honor and (2) glory. There may also be some sort of trinket to be named later. By the time this thing is over, more than five months will have passed, so that gives me some time to scrape something together. But you probably shouldn’t enter unless honor and glory are sufficient.

MORE RULES:

1. Everyone is limited to one entry per person. This will be enforced by the honor system. If caught breaking this rule, you, your children, and your children’s children will be banned from all future FP contests.

2. I won’t enter the contest myself, which will allow me to arbitrate any dispute impartially. Any ambiguity in the rules will be clarified by me in whatever way causes me the least amount of hassle.

3. While there are quite a few items that refer in some way to the NFL postseason, unless specifically stated, all the items below refer to regular season totals only.

5. You may enter until 1:00 p.m. Eastern time on Sunday, September 9th, 2018. However, there’s an incentive to entering early because…

6. In the event that the contest ends in a tie, the winner will be the person whose entry was submitted first. [continue reading…]

{ 0 comments }

Nathan Peterman is the Bills week 1 starter, beating out A.J. McCarron (who signed a 2-year, $8.1M contract with Buffalo in March, and received $4M from the Bills without ever taking a regular season snap before being traded to Oakland on three days ago) and rookie Josh Allen, taken with the 7th pick in the 2018 Draft.

Which is… well, unusual to say the least.  Peterman does not have a strong pedigree nor a track record of success. He was the 5th round pick in the 2017 Draft; as a rule of thumb, 5th round picks don’t start week 1 games for teams unless they have had some success. So, how did he do last season as a rookie?

[continue reading…]

{ 0 comments }

Tom Brady’s Career By Trailing 16 Game ANY/A

Last week, I looked at the Green Bay Packers passing offense since 2008 in trailing 16 game increments. I thought it would be fun to do the same thing today for Tom Brady.

The blue and red line shows Brady’s trailing 16 game Adjusted Net Yards per Attempt. The black line shows the trailing 16 game league average. As you can see, Brady was around league average for awhile, jumped way up prior to 2007, when he jumped way, way up.

The gaps in the line show his injury in 2008 and suspension in 2016. One interesting note is how Brady dipped just below average on his trailing 16 game average after the MNF game against the Chiefs in 2014.

What stands out to you?

{ 0 comments }

Khalil Mack had 41 points of AV over the last three years, tied for the 14th-most in the NFL, and 5th-most among defensive players. And after being traded to the Chicago Bears at the age of 27, making him the rare star defensive player to change teams in his prime.

How rare? I looked at players who met the following criteria:

  • Produced at least 35 points of AV over 3 consecutive years while playing for the same team;
  • Switched teams after the season and were 29 years or younger at the start of the new season

The last defensive player to fit those criteria was Ndamukong Suh, who joined the Dolphins as a mega free agent signing after an excellent run in Detroit. Suh signed a 6-year, $114M contract with Miami, and Suh wound up earning half of those contract over 3 years. Suh’s tenure with the Dolphins was disappointing, although mostly compared to the expectations created by his large contract.

Elvis Dumervil wound up in Baltimore after a fax machine mishap wound up in him being released from the Broncos. Dumervil had 17.0, 9.5, and 11.0 sacks in the three prior seasons (well, he missed one full season in between due to injury), and then had 9.5 sacks and 17.0 sacks his first two seasons in Baltimore.

Albert Haynesworth is the opposite end of the spectrum. He was an AP first-team All-Pro in both 2007 and 2008 with the Titans, and then joined Washington for his age 28 season. He is remembered as one of the worst blockbuster free agent signings in history.

Jared Allen was traded from the Chiefs to the Vikings just days before the 2008 Draft. The Chiefs traded Allen and their 2008 6th round pick (which turned out to be John Sullivan, who started 93 games at center for Minnesota) to Minnesota for the Vikings 1st round pick (KC traded up two spots to select Branden Albert), two third round picks (used to draft Jamaal Charles and DB DaJuan Morgan), and 2008 sixth round pick (WR Kevin Robinson). That might have been the rare win-win trade: Albert and Charles were stars, and Allen had a great career in Minnesota. He was a first-team All-Pro his last season in Kansas City and then three of his first four seasons in Minnesota.

The Raiders have also gone down this road before with Jon Gruden. In 1998, Gruden joined the Raiders and allowed DT Chester McGlockton to sign with the rival Chiefs.  McGlockton was a Pro Bowl each of the last four seasons, but left Oakland similar to Mack (but 18 months older).  After letting him leave, Oakland received the 31st and 59th overall picks in the draft as compensation.  Gruden responded by saying “We think we can get some players who can impact the team this year and for years to come… It’s going to be the bloodline of our organization.”   Suffice it to say, the 1998 Draft was not a good one for Oakland, other than using the 4th overall on a future Hall of Famer.

The table below shows all players who met the above criteria:

PlayerPosOld Tm3Yr AVN+1 YrNew TeamN+1 AgeN+1 AV
Khalil MackOLBOAK412018CHI27??
DeMarco MurrayRBDAL382015PHI276
Ndamukong SuhDTDET442015MIA287
Elvis DumervilLOLBDEN372013BAL293
Carl NicksLGNOR412012TAM274
Albert HaynesworthRDTTEN362009WAS286
Jared AllenRDEKAN362008MIN2617
Drew BreesQBSDG382006NOR2715
Steve HutchinsonLGSEA432006MIN299
Daunte CulpepperqbMIN412006MIA292
Edgerrin JamesRBIND552006ARI288
Randy MossWRMIN382005OAK288
Patrick SurtainLCBMIA382005KAN297
Jeremiah TrotterMLBPHI432002WAS256
Marshall FaulkRBIND391999STL2625
Dana StubblefieldRDTSFO371998WAS283
Ricky WattersRBPHI351998SEA2912
Curtis MartinRBNWE361998NYJ2513
Chester McGlocktonRDTOAK381998KAN295
Ricky WattersRBSFO491995PHI2611
Deion SandersRCBATL361994SFO2714
Pat SwillingROLBNOR571993DET2910
Charles HaleyLOLBSFO421992DAL288
Tim HarrisROLBGNB391991SFO273
Wilber MarshallRLBCHI401988WAS267
John JeffersonWRSDG361981GNB256
Lydell MitchellRBBAL631978SDG2912
Monte JacksonRCBRAM381978OAK256
Ted HendricksLLBBAL351974GNB2713
Paul WarfieldSECLE371970MIA2811
Miller FarrLCBHOU451970STL277
Homer JonesSENYG421970CLE293
Fran TarkentonQBMIN411967NYG2719
Abner HaynesHBKAN401965DEN284
Buddy DialSEPIT361964DAL272
Lou MichaelsLDEPIT361964BAL292

What do you think?

{ 0 comments }

It looks like Raiders All-Pro edge rusher Khalil Mack is being traded to the Chicago Bears.

Yesterday, Aaron Donald signed a record-setting contract at $22.5M per year with nearly $87M guaranteed. We can be sure that the Bears are about to give Mack something very similar, and likely slightly more rich, than what the Rams paid to Mack. After trading two first round picks plus something else (we should hear soon), Chicago is not going to fight with Mack over a few million dollars.

What are the Bears getting in Mack?
[continue reading…]

{ 0 comments }