≡ Menu

Cooks had a bad time in last year’s Super Bowl. Either he or the Patriots will repeat that fate this Sunday.

Wide receiver Brandin Cooks was in the Super Bowl last year with the Patriots, when New England was upset by the Eagles.  He was traded from New England to the Rams this offseason, and now his current team is up against his former team in Super Bowl LIII.  If the favorites win this time around, Cooks will have joined an exclusive club by playing in back-to-back Super Bowls with different teams… and losing both times.  And an even more exclusive club by starting in both games.

There are 8 players who have “ties” to the teams that lost in back to back Super Bowls (when they were different franchises).  Three of them have just loose ties: WR Kevin Norwood was on the 2014 Seahawks and also the 2015 Panthers for a game, but he did not make Carolina’s postseason roster. DB Anthony Madison was on the ’09 Colts roster for a hot minute, in between stints on the 2008 and 2010 Steelers. And WR Johnnie Barnes was on the ’94 Chargers (although he was inactive for the Super Bowl) and also the ’95 Steelers, but he was played on injured reserve in midseason.

Three other players were actually on the teams that made it to both Super Bowls, but did not actually play in both games.

  • TE Stephen Spach was a reserve on the 2007 Patriots and also the 2008 Cardinals. He was inactive in the Patriots/Giants Super Bowl, and tore his ACL in Arizona’s playoff win against Carolina, and was played on injured reserve before the NFC Championship Game that season.
  • QB Gale Gilbert made it to 5 straight Super Bowls with the ’90s Bills and then the ’94 Chargers. He was inactive for most of them, although he did make an appearance in the Chargers/49ers Super Bowl. Since he was on the roster for both games, I am including him here.
  • DT John Parrella was also on the ’93 Bills (inactive in the Super Bowl) and ’94 Chargers (active).

And that leaves just two players to actually play in and lose back-to-back Super Bowls with different teams. [continue reading…]

{ 1 comment }

You’ve probably heard more about Sean McVay over the last two seasons than you ever expected.  But here’s one thing about McVay that is entirely ordinary: he’s a 2nd-year coach taking his team to the Super Bowl. In fact, this is the third straight year the Patriots have made the Super Bowl and are facing a 2nd-year head coach, after facing the Eagles and Doug Pederson in 2017 and the Falcons and Dan Quinn in 2016. There have been 106 teams to make the Super Bowl, and 20 of them had second-year head coaches. That is the most common-year for a coach to make the Super Bowl:

Bill Belichick, meanwhile, is in his 19th year in Foxboro, and he joins Tom Landry as the longest-tenured coach to make a Super Bowl.

The table below shows the head coaches of the 106 Super Bowl teams, and how many years they were with that franchise when they made the Super Bowl:

CoachYearTeamYrs with Tm
Bill Belichick2018NWE19
Sean McVay2018LAR2
Bill Belichick2017NWE18
Doug Pederson2017PHI2
Bill Belichick2016NWE17
Dan Quinn2016ATL2
Ron Rivera2015CAR5
Gary Kubiak2015DEN1
Bill Belichick2014NWE15
Pete Carroll2014SEA5
Pete Carroll2013SEA4
John Fox2013DEN3
John Harbaugh2012BAL5
Jim Harbaugh2012SFO2
Bill Belichick2011NWE12
Tom Coughlin2011NYG8
Mike McCarthy2010GNB5
Mike Tomlin2010PIT4
Sean Payton2009NOR4
Jim Caldwell2009IND1
Ken Whisenhunt2008ARI2
Mike Tomlin2008PIT2
Bill Belichick2007NWE8
Tom Coughlin2007NYG4
Tony Dungy2006IND5
Lovie Smith2006CHI3
Bill Cowher2005PIT14
Mike Holmgren2005SEA7
Andy Reid2004PHI6
Bill Belichick2004NWE5
Bill Belichick2003NWE4
John Fox2003CAR2
Bill Callahan2002OAK1
Jon Gruden2002TAM1
Bill Belichick2001NWE2
Mike Martz2001STL2
Jim Fassel2000NYG4
Brian Billick2000BAL2
Jeff Fisher1999TEN6
Dick Vermeil1999STL3
Mike Shanahan1998DEN4
Dan Reeves1998ATL2
Mike Holmgren1997GNB6
Mike Shanahan1997DEN3
Mike Holmgren1996GNB5
Bill Parcells1996NWE4
Bill Cowher1995PIT4
Barry Switzer1995DAL2
George Seifert1994SFO6
Bobby Ross1994SDG3
Marv Levy1993BUF8
Jimmy Johnson1993DAL5
Marv Levy1992BUF7
Jimmy Johnson1992DAL4
Joe Gibbs1991WAS11
Marv Levy1991BUF6
Bill Parcells1990NYG8
Marv Levy1990BUF5
Dan Reeves1989DEN9
George Seifert1989SFO1
Bill Walsh1988SFO10
Sam Wyche1988CIN5
Dan Reeves1987DEN7
Joe Gibbs1987WAS7
Dan Reeves1986DEN6
Bill Parcells1986NYG4
Mike Ditka1985CHI4
Raymond Berry1985NWE2
Don Shula1984MIA15
Bill Walsh1984SFO6
Tom Flores1983RAI5
Joe Gibbs1983WAS3
Don Shula1982MIA13
Joe Gibbs1982WAS2
Bill Walsh1981SFO3
Forrest Gregg1981CIN2
Dick Vermeil1980PHI5
Tom Flores1980OAK2
Chuck Noll1979PIT11
Ray Malavasi1979RAM2
Tom Landry1978DAL19
Chuck Noll1978PIT10
Tom Landry1977DAL18
Red Miller1977DEN1
Bud Grant1976MIN10
John Madden1976OAK8
Tom Landry1975DAL16
Chuck Noll1975PIT7
Bud Grant1974MIN8
Chuck Noll1974PIT6
Bud Grant1973MIN7
Don Shula1973MIA4
Don Shula1972MIA3
George Allen1972WAS2
Tom Landry1971DAL12
Don Shula1971MIA2
Tom Landry1970DAL11
Don McCafferty1970BAL1
Hank Stram1969KAN10
Bud Grant1969MIN3
Don Shula1968BAL6
Weeb Ewbank1968NYJ6
Vince Lombardi1967GNB9
John Rauch1967OAK2
Vince Lombardi1966GNB8
Hank Stram1966KAN7

As for next year, Matt Nagy would be the overwhelming favorite to join this list among second-year coaches, with Frank Reich and Mike Vrabel also coming off winning seasons in their first years as head coaches.

{ 1 comment }

Since the Houston Texans entered the league in 2002, the Patriots have been the best team in the NFL. By, well, a lot. You won’t be too surprised to see that New England scored the most points from ’02 to ’18, followed by the Saints, Packers, Chargers, and Colts. The other three AFC East teams ranked in the bottom 10 in points scored during this time:

[continue reading…]

{ 0 comments }

There may only be room for one Patriots big man in Canton.

Tom Brady and Bill Belichick are going to the Hall of Fame. Randy Moss (who was arguably a Hall of Famer without his Patriots years) and the late Junior Seau (who was definitely a Hall of Famer without his time in New England) are already in Canton.  But who else from this nearly two-decade run of success will join them?

Darrelle Revis and Brian Waters each spent a season with the Patriots, and have good Hall of Fame cases.  Fred Taylor spent two half-seasons with the Patriots, and will have an uphill Hall of Fame battle.

But what about true Patriots — i.e., players who built the majority of their career in Foxboro in the Brady/Belichick era?  Who will one-day join then in Canton?

The Lock

Rob Gronkowski is the only Patriot of this era to be named 1st-team All-Pro at his position four times.  He is a future Hall of Fame player and will go in without much debate. He will likely be remembered as the best tight end of all time at his peak, and one of the greatest tight ends in league history.

The Near-Lock

Adam Vinatieri is, in some ways, more of a Colt than a Patriot at this point — 55% of his career points, 55% of his career field goals, and 75% of his career 50+ yard field goals have come as a member of Indianapolis.  However, what makes Vinatieri’s HOF case is his All-Pros (2 out of 3 came in New England) and postseason play (3 of his 4 Super Bowls, and all of his defining moments, came with New England).

It’s brutally difficult for kickers to make the Hall of Fame, however, and Vinatieri isn’t one of the most efficient kickers of all time, so he’s placed in the near lock category despite public perception assuming he’s already in. Five years ago, I would have placed him in the borderline category, but his sheer volume (he’s scored more points than anyone in NFL history) gives him an edge on some placekickers who were better for a shorter period of time. [continue reading…]

{ 0 comments }

The engineers driving football’s best offense

The 2018 Kansas City Chiefs had a remarkable offense.  Behind head coach Andy Reid and quarterback and MVP Patrick Mahomes, the Chiefs led the NFL in scoring with 565 points.  Kansas City joined the 2007 Patriots and 2013 Broncos as the only teams with 50+ passing touchdowns and 15+ rushing touchdowns, as the Chiefs scored a whopping 66 offensive touchdowns (and 5 more on defense/special teams).  But Kansas City’s offensive skill position players were not highly drafted, and that makes the Chiefs a pretty notable case.

A lot of great offenses are driven, unsurprisingly, by highly drafted skill position players. The 2007 Patriots had Randy Moss (1st round), and then Ben Watson (1st), Laurence Maroney (1st) and Jabar Gaffney (2nd) to go along with undrafted Wes Welker.

The Greatest Show On Turf Rams had high 1st round picks in Marshall Faulk and Torry Holt, along with #33 overall pick Isaac Bruce.

The Colts for much of the Peyton Manning era had 1st round picks in Marvin Harrison, Reggie Wayne, Edgerrin James, and Dallas Clark. And Manning’s 2013 Broncos had 5 players with double digit TDs: first round picks in Demaryius Thomas and Knowshon Moreno, and later picks in Julius Thomas (4th round), Eric Decker (3rd round), and undrafted Wes Welker.

The 1998 49ers had 1st round picks in Garrison Hearst, Jerry Rice, and J.J. Stokes. The ’94 49ers had Jerry Rice, Ricky Watters, Steve Young, and William Floyd. And the list goes on and on.

But there are some teams that the overwhelming majority of touchdowns came from 3rd round picks or later. For example, the 1984 Dolphins had Mark Clayton (18 TDs, 8th round), Woody Bennett (8 TDs, undrafted), Nat Moore (6 TDs, 3rd round) and Bruce Hardy (5 TDs, 9th round). Only Pete Johnson (9 TDs, 2nd round) and Mark Duper (8 TDs, 2nd round) were higher picks, among the team’s leading scorers.

The 2011 Saints top four leaders in touchdowns were Jimmy Graham (3rd round), Darren Sproles (4th), Marques Colston (7th), and Lance Moore (undrafted). The next four players were Pierre Thomas (undrafted), Robert Meachem (1st round), Mark Ingram (1st round), and Jed Collins (undrafted).

Still, the 2018 Chiefs stand out from this pack, at least if you group together all players taken in the 3rd round or later. [1]By the Jimmy Johnson Draft Value Chart, 83% of all draft value resides in the top 64 picks. Even in my draft value chart, which is more representative of actual value rather than trade value, 63% of … Continue reading A whopping 92% of Kansas City touchdowns came from such players, an almost unheard of margin for an elite offense. Take a look: [continue reading…]

References

References
1 By the Jimmy Johnson Draft Value Chart, 83% of all draft value resides in the top 64 picks. Even in my draft value chart, which is more representative of actual value rather than trade value, 63% of draft value comes from the top 64 picks.
{ 0 comments }

Yesterday, I looked at the evolving Patriots offensive line under Tom Brady in the 9 years that New England has made the Super Bowl.  Today, I want to look at the team’s receiving game.

The 2001-2004 Patriots passing attack was based around six players: Troy Brown, David Patten, Deion Branch, and David Givens at wide receiver, Daniel Graham at tight end, and the always dependable Kevin Faulk as the pass-catching back. Brown was the superstar in ’01, while Graham/Givens/Branch weren’t around that year but were big parts of the ’03 and ’04 teams.

The 2007 team was a bit of an outlier, in part because New England didn’t make the Super Bowl in the two years before or the three years after. Randy Moss, Donte’ Stallworth, Jabar Gaffney, and Ben Watson only appeared in one Super Bowl for New England: Super Bowl XII. The two notable players on the ’07 Patriots and other Super Bowl teams were Kevin Faulk (who was in New England forever, and was still the team’s top receiving back in ’07) and Wes Welker, who was a star on both the ’07 and ’11 teams. [continue reading…]

{ 1 comment }

Next Sunday, in the final game of the 2018 season, Tom Brady will be getting ready to play in his 9th Super Bowl, a number that is hard to comprehend. What’s also impressive is that various offensive linemen who have blocked for the Patriots Super Bowl teams. In Super Bowl LIII, from left to right, Trent Brown, Joe Thuney, David Andrews, Shaq Mason, and Marcus Cannon will be protecting him.

None of those offensive linemen were in the lineup four years ago when the Patriots faced the Seahawks to conclude the 2014 season.

And none of those offensive linemen were in the lineup for the 2007 Patriots team that went 16-0.

And only one of those offensive linemen — left tackle Matt Light — were on the field the first time the Patriots played the Rams in the Super Bowl. [continue reading…]

{ 0 comments }

Aaron Donald led the NFL in sacks this season, and his team is appearing in this year’s Super Bowl. That’s pretty rare: in the last 30 years, it’s happened just twice: Vic Beasley on the 2016 Falcons, and Kevin Carter on the ’99 Rams. If history repeats itself, it will mean that the two times the Rams have won the Super Bowl, it will have done so with the league’s sack leader, with no other team in the last 30 years having pulled off that feat even once.

The full list of sack leaders since the statistic began being officially tracked by the NFL in 1982, along with how that team’s season ended: [continue reading…]

{ 0 comments }

As regular readers know, I publish the Game Scripts data after each week of the regular season. Below are the results from each of the 10 playoff games so far:

TeamH/ROppBoxscorePFPAMarginGame ScriptPassRunP/R RatioOp_POp_ROpp_P/R Ratio
NWELACBoxscore41281317.2443456.4%531084.1%
IND@HOUBoxscore2171415323547.8%521676.5%
KANINDBoxscore31131813.8453357.7%391473.6%
LAC@BALBoxscore231768.4333350%362361%
LARDALBoxscore302286.5284836.8%332260%
NWE@KANBoxscore373164.9464848.9%351274.5%
DALSEABoxscore242222.1343450%282453.8%
PHI@CHIBoxscore161510.2412364.1%451871.4%
NORPHIBoxscore20146-4.2403156.3%311666%
LAR@NORBoxscore26233-5.6412661.2%432167.2%

[continue reading…]

{ 0 comments }

In the last 20 years of draft picks, you might be surprised to learn that just 2 of them have played in a Super Bowl: Eli Manning and Cam Newton. Just one more, Alex Smith, was on a team that made a Super Bowl (Smith started 9 games for the 2012 49ers, but did not appear in the Super Bowl as the backup to Colin Kaepernick). So that means Manning is the last #1 pick to win a Super Bowl, and his brother Peyton (now that’s a new one) is the second-to-last player to be drafted first overall and win a Super Bowl.

Jared Goff, the first overall pick in the 2016 Draft, will join the Mannings, Newton, and Smith when he starts for the Rams in Super Bowl LIII.   The cupboard is far from bare — Eric Fisher nearly made it this year, too, and Jadeveon Clowney and Andrew Luck were on playoff teams, while the Browns have the two most recent #1 picks and an exciting future to ponder.

The graph below shows all #1 overall picks since 1970, and how many Super Bowl they’ve appeared in: [continue reading…]

{ 0 comments }

In their final season under Jeff Fisher, the 2016 Los Angeles Rams scored 224 points, or just 14.0 points per game.  In their first year under Sean McVay, the 2017 Los Angeles Rams scored 478 points, or 29.9 points per game. That 15.9 points per game increase displaced what the ’99 Rams achieved and is the largest year-over-year increase by any team since 1950.

And yet, on Sunday, as the Rams made it to the Super Bowl with more than an assist from the referees, I wouldn’t blame you for thinking Fisher was still the coach of the Rams. McVay, the prototype for every new coaching hire, on the biggest stage of his life, made two of the most conservative coaching calls of his young career. [continue reading…]

{ 0 comments }

How The Rams Got Here: The Dream Offseason Was 2017

In 2013, the Rams traded up to draft Tavon Austin with the 8th pick and Alec Ogletree at the end of the first round; the franchise also used third round picks on T.J. McDonald and Stedman Bailey.  None of those players, or any other player drafted in 2013 by the Rams, is still on the team. In free agency, St. Louis signed Jake Long from Miami and Jared Cook from Tennessee, and neither of those players — or anyone else signed by the Rams that year — are still on the team.

The 2014 Draft didn’t get off to a better start — St. Louis drafted Greg Robinson with the 2nd overall pick, one of the largest draft busts in recent memory.  But Les Snead — the same GM who traded up for Austin, whiffed on the rest of the 2013 draft, and then drafted Robinson — has been on a very hot streak ever since.  An hour after taking Robinson, the team took Aaron Donald with the 13th pick that year.  Then the Rams drafted Todd Gurley with a 1st round pick in 2015, and traded up for Jared Goff with the 1st pick in 2016.  Those are the team’s best three players, but the bulk of the current roster was acquired in 2017.

Seven starters were added in 2017: wide receiver Robert Woods, offensive linemen Austin Blythe, John Sullivan, and Andrew Whitworth were all veteran acquisitions for the team, while the Rams used 3rd and 4th round picks on LB Samson Ebukam, S John Johnson, and wide receivers Cooper Kupp (8 starts) and Josh Reynolds (8 starts as Kupp’s replacement). It was not the star-studded, Kamara-esque class the Saints had that year, but seven starters is still seven starters.

The graph below shows the amount of AV on the 2018 Rams that was added each year, both via the draft and overall: [continue reading…]

{ 5 comments }

On Thursday, I looked at how the Patriots retooled their roster by using the 2015 Draft class. Yesterday, I showed that the Saints had a remarkable 2017 offseason, finding 7 starters in just one year.

If we do the same sort of analysis for the Chiefs, however, the results aren’t very interesting. There’s no one year that stands out for Kansas City; as you might suspect, the Chiefs have added a bunch of talent over the last three years, and were pretty good before then, too. Take a look at how much AV Kansas City added in each year to its 2018 roster, both via the draft (in black) and overall (in red): [continue reading…]

{ 0 comments }

The 2017 Draft replenished the Saints roster.  New Orleans roster drafted CB Marshon Lattimore with the 11th overall pick, OT Ryan Ramczyk with the 32nd pick, S Marcus Williams with the 42nd pick, Alvin Kamara with the 67th pick.  Those four players have been incredible additions for the team: Kamara and Ramczyk are two of the four Saints with 15+ points of AV in 2018, while the two defensive backs each started 16 games.  In addition, LB Alex Anzalone — taken with the 76th pick — started 7 games this year.

In the 2017 offseason, the Saints also signed ex-Lions guard Larry Warford, ex-Panthers linebacker A.J. Klein, and ex-Cardinals pass rusher Alex Okafor. Those three players were all regular starters on the 2018 Saints.  In fact, 7 of the 16 Saints players with 6+ points of AV this year were added in 2017.   The Saints, in some ways like the Patriots, are here because of their famous quarterback/head coach combo.  Sean Payton and Drew Brees both came to New Orleans in 2006, but the Saints had just completed back-to-back-to-back 7-9 seasons at the end of the 2016 season.  From 2014 to 2016, New Orleans had been outscored by 76 points.  As good as Brees and Payton are, they wouldn’t be here today without what happened in the spring of 2017.

The graph below shows the AV on the 2018 Saints from players drafted by New Orleans (in gold) and drafted or otherwise acquired by New Orleans (in black) from each year since 2006.

Last year, New Orleans nearly made it this far on the backs of those seven players, Brees and Payton, too. It’s been a remarkable two-year run for the Saints, and a reminder that in one offseason, any team can turn it around (and that goes double if you have a Hall of Fame quarterback).

{ 1 comment }

How did the Patriots Get Here? Look to The 2015 Draft

Let’s avoid the obvious: Yes, we know, Tom Brady and Bill Belichick are how the Patriots got here, with ‘here’ being their 8th (!!!!!!!!) consecutive AFC Championship Game appearance.

In 2014, the Patriots won the Super Bowl.  A few months later, the Patriots drafted Malcom Brown with the 32nd pick, and then hit a pair of home runs in the 4th round with DE Trey Flowers and guard Shaq Mason.  In fact, Flowers and Mason are two of the four players drafted in the 4th round or later of the 2015 Draft to have 24 points of career AV through four seasons (Minnesota’s Stefon Diggs and Tampa Bay’s Kwon Alexander are the other two).

Those three players are regular starters for the Patriots, and 3 of the 15 players to have more than 6 points of AV for the 2018 Patriots.  Of those 15 players, 10 came through the draft, but the 2015 Class is the only draft class with more than one of those players.  Four of the 15 players came from other teams, but a fifth is center David Andrews, who was an undrafted free agent signing by New England in 2015.  Andrews has been the best undrafted player from 2015, which means ignoring players that went in the first three rounds, the Patriots got 3 of the best 5 players in the 2015 draft class.  That’s pretty darn good.

New England players had 225 points of AV this year, and the two years where the team added the players responsible for most of that AV came in 2015 (40 points) and 2018 (41 points). Take a look: [continue reading…]

{ 6 comments }

2018 Approximate Value Released

Pro-Football-Reference.com has released its initial set of 2018 Approximate Value numbers have been released by PFR. Thanks to the tireless work of Mike Kania and the P-F-R staff, PFR has now generated the Approximate Values for every player in the NFL this year. For the uninitiated, you can review how AV is calculated here. And if you’re so inclined, you can thank Mike and/or the PFR staff on twitter.

[continue reading…]

{ 1 comment }

The 1981 San Diego Chargers led the NFL in points and yards, but ranked 26th in points allowed and 27th in yards allowed in a 28-team NFL. The Chargers made it to the AFC Championship Game, but had the poor fortune of playing in Cincinnati in a game with -32 degree wind chill. The game wound up being known as the Freezer Bowl, and the Chargers lost 27-7. San Diego might have been better off playing in 2018.

The table below shows where each of the final four teams rank in points, yards, points allowed, and yards allowed, along with each team’s average rank of the two offensive categories and average rank of the two defensive categories. The final column shows the difference between the team’s offensive and defensive ranks, as a way of describing whether a team is offensive-powered or defensive-powered.

YearTeamPF RkYd RkPA RkYA RkAvg Off RkAvg Def RkOff Heavy
2018NOR3814145.5148.5
2018NWE457214.5149.5
2018LAR222019219.517.5
2018KAN112431127.526.5

Let’s use the Saints as an example. New Orleans ranks 3rd in points for and 8th in yards, while ranking 14th in points allowed and 14th in yards allowed. Therefore, New Orleans has an average offensive rank (3, 8) of 5.5, and an average defensive rank of 14 (14,14). The Saints are considered offensive heavy to the tune of 8.5 slots (14 minus 5.5). And that makes the Saints the least offensive-heavy team remaining in the final four.

The graph below shows the average offensive rank (taking the average of each team’s rank in points and yards) and defensive rank for each of the final four teams in each season since the merger. As you can see, this is a heavily-slanted year for offense: [continue reading…]

{ 1 comment }

Two years ago, I wrote about how the Patriots under Tom Brady were on a remarkable streak. At the time, the Patriots had been favored in 33 consecutive games where Brady was the starting quarterback (during his suspension during DeflateGate, New England was a 9-point underdog against the Cardinals in a game Jimmy Garoppolo started, and a pick’em in a game against the Texans that Jacoby Brissett started; New England won both games).

Since I wrote that article, the Patriots were favored in all 19 games in 2017, and in all 17 games so far during the 2018 season. That brings the total up to an absurd 69 consecutive games that the Patriots have been favored in when Brady is the starting quarterback. And 70 games ago was Super Bowl XLIX, when the Patriots and Seahawks game was a pick’em. That means you have to go back to a game against the Packers in November 2014 to find the last time Brady took the field in a game the Patriots were underdogs.

The graph below shows every Patriots regular (in blue) and playoff (in red) game since 2010.  The non-Brady games at the start of the 2015 season are shown in black circles.  Since point spreads are typically displayed like “Patriots -7”, the Y-Axis shows the point spread but in reverse order (so the Patriots mostly occupy the top half of the graph).  The X-Axis shows the year. [continue reading…]

{ 4 comments }

The Saints crushed the Eagles in New Orleans during the regular season

In week 11 this season, the Eagles traveled to New Orleans and were obliterated, 48-7. The loss dropped Philadelphia to 4-6, nearly ending their playoff hopes. But behind Nick Foles, the Eagles miraculously made the postseason — after the Saints loss, Philadelphia’s odds of winning a Wild Card berth dropped to just 2% — and won a Wild Card matchup against the Bears. That brings the Eagles back to the Superdome, with a chance for revenge against the Saints.

The Eagles are 8-point underdogs, and the ugly regular season performance is just one of the reasons why. But it’s hard not to draw comparisons to another team in green that once avenged a regular season embarrassment. Eight seasons ago, the Jets traveled to Foxboro for a Monday Night game with a potential division title hanging in the balance. Both teams were 9-2, and New York had defeated New England at home earlier in the year. But that night, the Patriots blew out the Jets 45-3, in a game that showed just how far the Jets still had to go to measure up to the league’s best teams.

Except, it hadn’t. Because 41 days later, in a rematch in Foxboro in the division round of the playoffs, the Jets shocked the Patriots, winning 28-21 as 9.5-point underdogs.

As it turns out, that’s the largest margin ever avenged in the playoffs in a rematch at the same site. The table below shows all postseason games featuring:

1) A rematch of a regular season game in the same location;

2) In the regular season, the winning team won by at least 14 points;

3) In the playoffs, the winning team lost the regular season game.

WonLostYearRS MargRS WkRS BoxscoreLocLineRdP Boxscore
NYJNWE2010-421345-3Road9.5D28-21
MINRAM1977-32635-3RoadD14-7
DENHOU1987-30440-10Home-10D34-10
KANHOU1993-30230-0Road7D28-20
ARIDAL1998-28138-10Road7W20-7
PITHOU1989-27727-0Road7W26-23
ARIGNB2009-261733-7Home2.5W51-45
GNBNYG1944-241024-0RoadC14-7
RAMDAL1979-24730-6Road8.5D21-19
NYGRAM1984-21533-12Road4.5W16-13
BUFBCL1948-201535-15RoadD28-17
BALPIT2014-20943-23Road3W30-17
BUFNYJ1981-19733-14Road3W31-27
PITIND2005-191226-7Road8.5D21-18
TAMDET1997-18727-9Home-3W20-10
RAMCLE1951-15238-23HomeC24-17
RAMTAM1979-15421-6Road-3.5C9-0
CHINYG1946-14614-0RoadC24-14
WASDAL1982-141324-10Home2C31-17
WASPHI1990-141028-14Road4.5W20-6
SDGKAN1992-14124-10Home-3W17-0
INDDEN2003-141631-17Home-3W41-10
NWEPIT2004-14834-20Road-3C41-27
INDNYJ2009-141629-15Home-8.5C30-17
{ 0 comments }

The Kansas City Chiefs led the NFL in scoring in 2018, and fielded the third highest scoring team in NFL history. But that doesn’t always lead to playoff success. Since 2000, just one team that led the NFL in scoring has won the Super Bowl.

The table below shows all teams to lead the NFL (or combined AFL/NFL) in the Super Bowl era, and how those teams fared in the playoffs. [continue reading…]

{ 0 comments }

The graph below shows all 512 team games played in the 2018 season. On the X-Axis is the Game Script; on the Y-Axis is the percentage of plays that were passing plays for that team. As you can see, there’s a pretty clear correlation between Game Script — which is the average points differential over the course of the game — and Pass Ratio. The higher the Game Script, the lower the Pass Ratio:

Here is the best-fit linear formula to estimate a team’s Pass Ratio in 2018, assuming you know the Game Script:

58.76% minus 0.71 * Game Script

In other words, for about every 4 points of Game Script, you would expect a team’s Pass Ratio to decline by nearly 3 percent. A team with a Game Script of +8.0 would be expected to pass on 53.1% of plays, while a team with a -8.0 Game Script would be expected to pass on 64.4% of plays.

Once we know how often a team is expected to pass, we can then figure out which games were the biggest outliers. As it turns out, the Pittsburgh Steelers — playing the season without Le’Veon Bell — had the three most pass-happy games of the season. Playing the Broncos on November 25th, Pittsburgh had a Game Script of -1.5, so we would expect the Steelers to pass on 59.8% of all plays; instead, Pittsburgh threw on a whopping 78.9% of plays. That was the most pass-heavy game of the season once you account for Game Script.

The table below shows the Game Script, expected Pass Ratio, Actual Pass Ratio, and the difference between those two figures for all 512 team games in 2018. [continue reading…]

{ 0 comments }

In late October 2017, I wrote an article about Adam Gase and the Miami Dolphins.  Here was the introduction:

Adam Gase was hired as the Dolphins head coach last year. His tenure with the team has been both successful and underwhelming, which is pretty hard to do. The Dolphins are 14-9 under Gase, tied with the Packers for the 8th-best record in the NFL. It feels hard to imagine, but Miami has a better record than Philadelphia or Denver since 2016, and has as many wins as the Falcons.

On the other hand, Miami has a -77 points differential, which is the 7th-worst in the league. That’s a very stark difference: most teams have records that are proportional to their points differential, but not Miami. Tennessee (11th in record, 20th in points differential) and Houston (14th, 23rd) are the next two biggest outliers in that direction, with winning percentage ranks that are 9 slots better than their points differential ranks; Miami is at +17.5, by being tied for 8th in record and 26th in points differential. The Saints (t-19th; 8th), Jaguars (29th; 19th), and Chargers (t-27th; 18th) are the biggest underachievers by this method.

That article was written following week 8 of the 2017 season, roughly the halfway point of Gase’s tenure with the team.  What happened since?  Miami went from 14-9 with a -77 points differential to 9-16 with a -166 points differential.  In some ways, though, the Dolphins still overachieved: the team ranked 29th in points differential from week 9, 2017 through the end of 2018, and 25th in winning percentage.

Gase was fired in Miami, but his legacy remains a bit complicated.  Miami finished with the 29th-best points differential among the 32 teams during his 3-year tenure, but the 18th-best winning percentage.  Now, you may say it doesn’t matter whether the Dolphins were the 18th best team or the 29th best team — neither is very good.  But I do think that is a large enough distinction that it merits review.

That, of course, is because the New York Jets decided to hire Gase to become the team’s next coach.  And we could look at this two ways: did he coach a terrible team that got lucky to have a few more wins than they should have (in which case Gase should be considered a bad coach), or did he oversee a talent-poor team and coached them up to win more often than they should have (in which case Case should be considered a good coach)?

From 2016 to 2018, Miami went 18-5 in games decided by 7 or fewer points, and 20-6 in games decided by 8 or fewer points.  Both records were comfortably the best in the league.  So, is that sparkling record in close games a positive for Gase — hey, he’s a great coach who wins when the talent level is close! — or a negative for Gase (he’s a terrible coach who is lucky his teams won as often as they did).

Unfortunately for Jets fans, nearly all the research on this subject suggests that a team’s record in close games is not reflective of skill, but of luck.  The Jets have been terrible in close games in recent years, while Gase has been great: you would expect some regression to the mean in either instance, and I would project the Jets to be about .500 in close games during Gase’s tenure.

The bigger cause for concern, then, would be this: Gase went an almost unfathomable 3-19 in games decided by more than 8 points during his time in Miami.

{ 1 comment }

I tweeted this 10 days ago:

Tampa Bay’s passing attack was very good this year, and it was also very underrated last year. In 2017, Jameis Winston led all quarterbacks in percentage of pass attempts that picked up a first down. And while Winston and Ryan Fitzpatrick both had ups and downs in 2018, after Winston replaced Fitzpatrick in week 11, he played like one of the best quarterbacks in the NFL over the last two months (just like he did in 2017). Winston’s biggest problem has been turnovers, but given that he just turned 25 years old last week, I don’t think his career is set in stone. And we know that interception rates are pretty random from year to year, so there is a good chance Winston can bring his interception rate under control.

The big question, though, is can Winston keep being one of the game’s best players at picking up huge chunks of yards while limiting his turnovers? Well, his 2019 is off to a good start, as he just found his perfect coach: Bruce Arians has come out of retirement to coach the Bucs. It is telling that Arians only was willing to re-enter the NFL to coach the Browns and Baker Mayfield or Tampa Bay and Winston. And that is not too surprising, at least not to me: Winston is, in my opinion, capable of becoming the next Carson Palmer and playing at an All-Pro level under the right coach. And I am sure that Arians seems a lot in Winston that he saw in Palmer, particularly when it comes to the vertical passing game.

The graph below shows each quarterback season (with at least 224 pass attempts) since 2015. The X-Axis shows how many air yards (i.e., yards in the air the football traveled) each passer gained, on average, on all pass attempts. The Y-Axis shows how many air yards (which excludes yards gained after the catch) each passer gained, on average, on completed passes. The quarterbacks that stand out the most during the last four years are Palmer and Winston (and Fitzpatrick on the 2018 Bucs). [continue reading…]

{ 1 comment }

Through 14 games this season, Alabama outscored its opponents by 31.5 points per game. Last night, in the most shocking national championship game I can remember, Clemson dominated Alabama in historic fashion. The Tigers beat Alabama 44-16, a 28-point margin of victory against a Nick Saban Alabama team that in 12 seasons had never lost a game by more than 14 points.

No team in NFL history has outscored opponents by 20 points per game and then lost a playoff game by 20+ points. The closest comparisons:

  • The 1967 Raiders outscored opponents by 16.8 points per game. Oakland defeated Houston 40-7, to up its average points differential per game to 17.9 through 15 games. Then, in the Super Bowl against the Packers, Oakland lost by 19 points, 33-14.
  • The 1969 Vikings outscored opponents by 17.6 points per game.  After a couple of close playoff wins, Minnesota lost Super Bowl IV by 16 points, 23-7.

In more recent times: the 2012 Patriots outscored opponents by 14.1 points and lost in the playoffs by 15 points, the 2013 Broncos outscored opponents by 12.9 points and lost by 35 points, and the 2011 Packers outscored opponents by 12.6 points and lost by 17 points.

My first reaction was to think of the 1983 Redskins: that year, Washington outscored opponents by 13.1 points and lost by 29 points.

What I wanted to do was plot team points differential in the regular season against each team’s worst playoff loss.  I plotted regular season points differential on the X-Axis and worst playoff margin on the Y-Axis; then I realized we just want to focus on the bottom right quadrant of that graph (positive regular season points differential, negative playoff margin).  So here is that bottom right quadrant of the graph: [continue reading…]

{ 0 comments }

Cody Parkey watches the Bears season flash before his eyes.

In a regular season game against the Lions, Bears field goal kicker Cody Parkey missed 2 field goals and 2 extra points that was notable because all 4 misses hit the uprights. Last night, Parkey’s leg somehow vaulted another ball into the uprights (with a tip to Treyvon Hester, literally) in a much more painful situation.  The #3 seed Bears, at home against the Eagles, trailed 16-15 with 10 seconds remaining when Parkey lined up for a 43-yard field goal.  After Parkey’s kick hit the left upright, then bounced on the crossbar, and then landed in the field of play, the Bears magical season was over.

Parkey is not alone. Below are the most heartbreaking, last-second missed field goals in the postseason since 1990 — also known as since Norwood, which remains by a large margin the most heartbreaking miss in postseason history. To qualify, a kick must have been in overtime or in the final seconds of regulation, and the kicking team had to lose the game.

#10) Mike Vanderjagt (Colts) against the Dolphins (2000-12-30)

The Colts led 14-0 in the Wild Card round against the Dolphins before allowing Miami to send the game to overtime at 17 apiece. After a defensive stop, Indianapolis drove 51 yards to set up a game-winning field goal attempt from Vanderjagt, who had made 25 of 27 attempts during the regular season. But his 50-yard attempt was no good, the Dolphins drove down the field for the winning score. Two years later, Vanderjagt blamed his Colts teammates and coaches for the team’s lack of playoff success, and three years after that, Vanderjagt would strike again.

#9) No Field Goal Attempt (Giants) against the 49ers (2003-01-05)

You read that correctly: this one was so painful in part because Matt Bryant never even had a chance. The Giants blew a 38-14 lead to the 49ers, as San Francisco came all the way back to take a 39-38 lead with one minute to go. New York drove down the field and got to the 49ers 23-yard line with just six seconds remaining. There, disaster struck: Trey Junkin, signed by the Giants just days earlier, botched the snap, and the Giants never had a chance to kick the game-winning field goal. [continue reading…]

{ 1 comment }

The 2018 season was the greatest offensive season in NFL history. Teams averaged a whopping 23.3 points per game, which technically ranks second behind the 2013 season (23.4). But there is no doubt that the 2018 season was the better offensive season:

In 2018, teams scored 1,286 offensive touchdowns; in 2013, teams scored 1,214 offensive touchdowns.

Field goal kickers were better 5 years ago; teams hit 863 field goals in 2013, and just 802 this season. And don’t forget about the effect of the rules changes on extra points: teams connected on 99.6% of extra points that year, compared to just 94.3% this year while kicking from much farther away. Had kickers had the same rate on extra points in 2018 as they did in 2013, the NFL would have seen 66 more points; meanwhile, teams scored just 33 more points in 2013 compared to 2018.

Teams also scored 20 special teams return touchdowns in 2013, compared to just 13 this year. In addition, teams scored a whopping 26 more touchdowns on defense (95 in 2013, 69 in 2018), and 9 other return touchdowns came in 2013, versus 4 other return touchdowns this year.

So yes, 2018 was the greatest offensive season in history, and it wasn’t particularly close. But that didn’t translate to the Wild Card round of the playoffs, where teams averaged just 18.1 points per game across four games. That’s pretty low by Wild Card round standards: take a look. [continue reading…]

{ 8 comments }

Seattle rushed 24 times for 73 yards tonight against the Cowboys, averaging 3.0 yards per carry.

The Seahawks and Russell Wilson threw for 226 net passing yards on 30 dropbacks, averaging 8.1 yards per pass.

If you knew nothing else but that, you would assume the Seahawks won. After all, that’s a pretty efficient game from the quarterback, and a team would typically run on 44% of all plays in a game that they are winning.

But alas, that was not the case tonight.  Let’s look at the last 10 times a team averaged under 3.0 yards per carry, ran on at least 40% of their plays, and lost a playoff game (teams are 56-10 in the playoffs since 1999 when meeting the first two criteria, because teams usually only run that often if they’re running that poorly because they’re leading):

[continue reading…]

{ 1 comment }

2018 Wild Card Playoffs: Colts at Texans

The matchup of the game.

For the third time this season, the Colts and Texans will be sharing the same field. This is the rubber match: Houston won in Indianapolis in September 37-34, while the Colts won in Houston in December, 24-21. This is also just the third matchup — hopefully of many — between
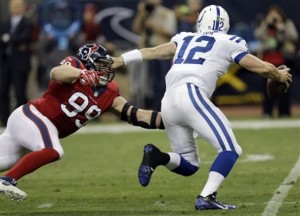
 Deshaun Watson and Andrew Luck. So who has the advantage?

Houston Pass Offense vs. Indianapolis Pass Defense

The Texans have a good passing offense, with DeAndre Hopkins once again playing at an All-Pro level.  Hopkins was responsible for 38% of all Texans receiving yards and averaged 3.1 yards per Houston pass attempt (excluding sacks); both of those figures easily led the league.  By way of comparison, Julio Jones and Michael Thomas ranked 2nd and 3rd in those categories: both averaged 2.7 yards per team pass attempt and accounted for 34% of their team’s receiving yards.

Houston has two weaknesses in the passing game: the lack of a complement to Hopkins, and the enormous amount of sacks that Watson takes.  The Texans were sacked 62 times and were sacked on 10.9% of all pass plays; both were the worst figures in the NFL.  The Colts defense is pretty average in terms of both pass rush and pass defense.  The Texans have the edge here, although it is not enormous.

Slight edge: Houston

Houston Rush Offense vs. Indianapolis Rush Defense

The Texans have a pretty weird running game: they run a lot but not necessarily that well.   Houston ranked 4th in rushing attempts this year, but in terms of efficiency, finished 27th, and even that is inflated a bit by Watson.  Meanwhile, the Colts have a very good run defense: Indianapolis ranks 4th in rush defense efficiency and 8th in yards allowed.

Key stat: Texans running backs had 47 carries for just 134 yards and 7 first downs in two games against Indianapolis this year; Houston would be wise to lean heavily on Watson today.

Big edge: Indianapolis

Indianapolis Pass Offense vs. Houston Pass Defense

Andrew Luck had a unique year: he was remarkable at avoiding sacks (2.7% sack rate, best in the NFL) but also averaged just 10.7 yards per completion, the fewest of his career.  It was a more conservative version of Luck than we’ve seen in years past, although he still will throw more interceptions than your average top tier quarterback. On the plus side, Luck was outstanding as a passer on third down, which has been a key to the Colts great season.  Indianapolis ranks as the 10th best passing offense, while Houston ranks as the 12th-best passing defense.  This is likely where the game will be decided: J.J. Watt, Jadeveon Clowney, and Whitney Mercilus against the 3rd best offensive line this year (per Pro Football Focus).

Edge: Even

Indianapolis Rush Offense vs. Houston Rush Defense

The Colts have an average rushing attack, so let’s get to the key story: Houston has the best run defense in the NFL. And that was true in the Colts games, too: Indianapolis running backs had 31 carries for just 64 yards and 5 first downs. It would be surprising if Luck finishes with under 40 pass attempts today.

Big Edge: Houston

Special Teams/Coaching

Both of these teams have good special teams, although Houston’s is better.  The coaching matchup is tough to grade here, too.  Frank Reich is a first year head coach, while Bill O’Brien has a 1-2 playoff record.  I would give O’Brien the slight edge due to experience and the home field.

Slight Edge: Houston

Both Watson and Luck are high variance quarterbacks: at their best, they can be MVP-caliber players.  But my concern for the Colts is that they are unlikely to get anything going on the ground, and will force Luck to do too much.  On the road against a talented Texans team, it will take an A game from Luck to win.

Prediction: Houston 24, Indianapolis 14
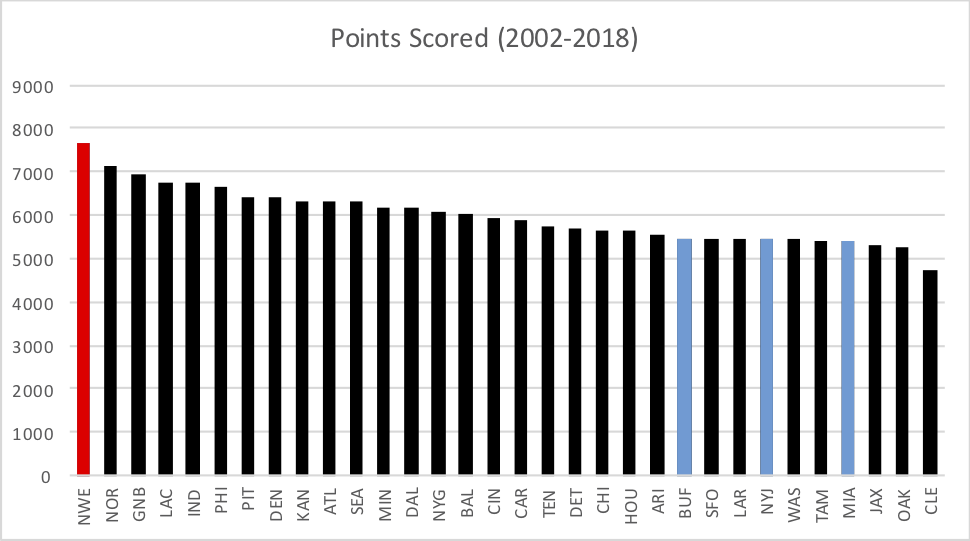
Team Ratings

{ 0 comments }

Yesterday, I looked at the top offenses in the NFL. Today, the top defenses, as I did last year. Let’s begin with pass defense.

Pass Defense

The Bears, as you would suspect, ranked as the best pass defense in the NFL. We use the same formula to measure pass offenses and pass defenses, and Chicago’s pass defense was nearly a full adjusted yard per dropback than any other team.

(Passing Yards (net of sack yards lost) + Passing Touchdowns * 11 + First Downs * 9 – Interceptions * 45) divided by (Attempts + Sacks)

The Bills, Ravens, Vikings, and Jaguars were all top-5 pass defenses; three of them missed the playoffs, and a fourth nearly did. That’s pretty remarkable but don’t misunderstood the value of a good pass defense. The bottom 5 pass defenses all missed the playoffs, and none came particularly close. [continue reading…]

{ 1 comment }

Last year, I reviewed the top offenses and defenses from the regular season. I am updating that post in two parts this week for the 2018 season. We will look at how each team did in the four major categories: passing offense and rushing offense today, and then passing defense and rushing defense tomorrow.

Passing Offense

The base stat we use to measure passing offenses is Adjusted Net Yards per Attempt, but if we want to be even more precise, we should incorporate first downs. As a result, the formula is:

(Passing Yards (net of sack yards lost) + Passing Touchdowns * 11 + First Downs * 9 – Interceptions * 45) divided by (Attempts + Sacks)

The table below displays team passing yards, which already deducts sack yards lost from gross individual passing yards. And since every touchdown is recorded as a first down for official boxscore purposes, this means that all touchdowns are still worth 20 adjusted yards. But to not make them worth 29 yards, we have to only credit each touchdown with 11 yards.

Patrick Mahomes and the Chiefs had the top passing offense by this measure, with the Saints, Rams, and Chargers all standing out as elite passing attacks. The Cardinals and Bills were, by a large amount, the worst passing offenses in the NFL, with the Jets, Jaguars, and Redskins rounding out the bottom five. [continue reading…]

{ 0 comments }
Previous Posts