≡ Menu

Pick a QB, any QB: there are no right answers.

The 2018 NFL Draft was supposed to change the landscape of the NFL at the quarterback position. Maybe not right away, of course, but in a few years — say, 2021? — the five quarterbacks selected in the first round of the 2018 NFL Draft would be the stars of the day. Instead, Josh Rosen flamed out immediately, Sam Darnold proved to be underwhelming under three different coaches, and Baker Mayfield’s stock fell dramatically in his fourth year. Even Lamar Jackson, the 2019 AP MVP, has fallen off; after a notable dropoff in play from 2019 to 2020, he fell further in an injury-plagued 2021. At this point, only Josh Allen is an unimpeachable franchise quarterback, but even he has seen a significant decline in passing efficiency this season.

All told, the 2018 first round quarterbacks as a group have been decidedly below average as passers this season, with three of the four starters (excluding Rosen) being in the bottom five of the NFL in interception rate.

This made me curious: which draft classes have been the most productive in 2021? With 17 weeks in the books — a traditional NFL regular season — here’s what I did. [continue reading…]

{ 0 comments }

Cincinnati added not only a familiar weapon, but one with a great name.

One of the most unique parts of the 2021 NFL Draft was the reuniting of college teammates in the passing game. The Cincinnati Bengals drafted LSU quarterback Joe Burrow first overall last season; holding the 5th overall selection this year, Burrow was rumored to be pushing his organization to draft his former teammate, Tigers WR Ja’Marr Chase. The Bengals did in fact pull the trigger on Chase, making them the extremely rare combination of quarterback and receiver to get drafted out of the same college and to the same team in the first round in back to back years.

But it didn’t stop there.  With the very next pick, Miami drafted Alabama WR Jaylen Waddle, a year after drafting Crimson Tide quarterback Tua Tagovailoa with the fifth overall pick.  But it didn’t stop there: Alabama WR DeVonta Smith was selected by the Eagles with the 10th overall pick, and that reunites him with Jalen Hurts, the Eagles starting quarterback and a member of the 2017 and 2018 Crimson Tide teams. [continue reading…]

{ 12 comments }

In Part I, we learned that there is a correlation between 40-yard dash times and wide receiver success in the NFL.

In Part II, we learned that there is a correlation between 40-yard dash times and where a wide receivers gets drafted.

Today: have NFL teams been properly evaluating 40-yard dash times when drafting wide receivers?

My plan *was* going to be as follows.  Let’s break things down into two buckets: wide receivers who were drafted much higher than their 40 time would indicate, and wide receivers who were drafted much lower than their 40 time would indicate. Then, see which category fared better. Should be easy, right?

On one hand, you have players like Larry Fitzgerald and Peter Warrick: wide receivers who were bringing something to the table besides their 40-time. Fitzgerald ran the 40 in 4.48 seconds yet was drafted 3rd overall. Warrick ran it in 4.58 seconds and was the 4th overall pick! Both players were dominant in college but not known for their speed: NFL executives certainly didn’t put too much weight in their 40 times when evaluating those guys. To the extent you think NFL teams always overweight the 40, Fitzgerald and Warrick are too good reminders that that is not the case. [continue reading…]

{ 0 comments }

Update:

The 2021 NFL Draft saw 156.7 points of draft value spent on quarterbacks, the 2nd-most in NFL history behind only 1999.  As expected, Lawrence and Wilson were the first two picks, with Lance going third overall.  The fourth quarterback didn’t go off the board until the 11th pick, which was a bit of a surprise: that was Fields to Chicago, and the fifth quarterback (Jones) went to New England at 15.  Trask, Mond, and Mills were indeed seen as the best of the rest, and went in the span of four picks in the 60s.  The margin was so close that had Fields been selected with the 8th overall pick, and the rest of the quarterbacks were chosen in the same spot, then the 2021 Draft would have exceeded the ’99 Draft in terms of draft capital spent on quarterbacks.

The rest of the original article is below.

The 2021 NFL Draft looks to be extremely quarterback heavy. The Jaguars are going to select Clemson quarterback Trevor Lawrence with the first overall pick, and the expectation is that the Jets will draft BYU passer Zach Wilson with the second selection.  The 49ers will likely draft a quarterback with the third pick, too, and the rumors are that it could be Alabama QB Mac Jones, or Ohio State’s Justin Fields, or even North Dakota State’s Trey Lance; regardless, all five quarterbacks are expected to go in the first round, and perhaps even all in the top ten!  Three other quarterbacks — Stanford’s Davis Mills, Florida’s Kyle Trask, and Texas A&M’s Kellen Mond could have early picks used on them, too.

The most QB-heavy draft in NFL history was not the famous 1983 Draft — which featured three HOF passers and six quarterbacks selected in the first round — but rather the 1999 Draft.  That year, quarterbacks were taken with the first three picks, and two more were drafted in the top fifteen; second, third, and two fourth round picks were also used on quarterbacks.

I looked at every NFL Draft since 1950 and calculated how much draft capital was spent on quarterbacks each year.  The picture below shows those results, using the Football Perspective Draft Value Chart.

Let’s say that in the 2021 Draft, Lawrence/Wilson/Fields go with the first three picks, Lance and Jones get selected at 7 and 9, and as The Athletic’s Mock Draft by Dane Brugler provides, Mills goes to the Patriots in the middle of the second round, Mond is taken by the Bears a few picks later, and Trask is a fourth round pick by the Vikings.  If no other quarterbacks are selected in the top 224, that would mean that the draft capital spent on quarterbacks in 2021 was equal to 159 points using the Football Perspective Draft Value Chart.  That would, by a hair, make this the most quarterback-heavy draft in NFL history, as the ’99 Draft had 158.6 points of draft capital spent on quarterbacks. And if quarterbacks go 1-2-3-4 to start the Draft, that would up the allocation to 162.6 points. It seems very likely that 2021 will be either the #1 or #2 quarterback draft in NFL history, at least according to draft capital spent on the position.

{ 0 comments }

In Part I, we learned that there is a correlation between 40-yard dash times and wide receiver success in the NFL. Today, I want to look at a third variable: NFL Draft status.

My sample once again comprises the 853 wide receivers who ran the 40-yard dash at the NFL combine from 2000 to 2017. All data is publicly available from PFR, via Stathead Football. If you think there was a strong correlation between 40-yard dash time and NFL production, wait until you see the correlation between 40-yard dash time and draft status.

In the table below, the average draft value represents the FP draft value associated with each pick. A higher number means more draft value — i.e., an earlier pick — was used to select those players. [continue reading…]

{ 0 comments }

2021 Draft Order: Miami Has Hacked The Process

The NFL Draft is supposed to help promote parity in the league. By giving the teams with the worst records the best draft picks, all teams are pushed to regress towards the mean over time. The Jaguars and Jets were the worst two teams in the 2020 NFL season, and they have the first two picks in the 2021 NFL Draft, giving those organizations a chance to land franchise-altering quarterbacks.

But the third pick belongs to the Miami Dolphins, as the last bit of compensation in the Laremy Tunsil trade. Miami is the rare team that was both good last year and has a ton of draft capital, which could set the team up for long-term success.

Yesterday, the NFL released the final order for the entire 2021 NFL Draft. Using both the traditional, Jimmy Johnson draft chart and the Football Perspective Draft Value Chart, below is how much draft capital each organization has, from most to least. [continue reading…]

{ 0 comments }

The 2020 Atlanta Falcons starting offensive linemen were all former first round picks. Atlanta drafted right guard Chris Lindstrom and right tackle Kaleb McGary in the first round of the 2019 Draft, five years after using the 6th overall pick on Texas A&M left tackle Jake Matthews. In 2016, Atlanta signed center Alex Mack, the 21st pick in the 2009 Draft, away from the Browns to a monster deal; he’s been the center of the team’s offensive line ever since. And in the 2019 offseason, the left guard spot was pugged by James Carpenter, who had been a first round pick out of Alabama and then played four seasons each with the Seahawks and Jets.

It should go without saying that that is a lot of highly drafted offensive linemen for one team, even if Atlanta only drafted three of the players. [1]The Falcons also had five first round picks on offense outside of the offensive line: the Falcons drafted QB Matt Ryan, WR Julio Jones, and WR Calvin Ridley in the first round, too, and added former … Continue reading Let’s compare them to the Green Bay Packers, who had arguably the best offensive line in the NFL and trotted out the following starting five:

The Packers had one of the least heralded group of offensive linemen in the league — at least from a draft perspective (in other news, the entire left side of the line made the Pro Bowl). How does that compare to the rest of the NFL? [continue reading…]

References

References
1 The Falcons also had five first round picks on offense outside of the offensive line: the Falcons drafted QB Matt Ryan, WR Julio Jones, and WR Calvin Ridley in the first round, too, and added former first round picks at RB (Todd Gurley) and TE (Hayden Hurst) in the 2020 offseason. Slot receiver Russell Gage, a sixth round pick out of LSU, was the 11th starter, and presumably teased mercilessly in the huddle.
{ 0 comments }

Over at FiveThirtyEight, Josh Hermsmeyer recently wrote about wide receivers and 40-yard dash times. Using yards per route run as his measure of productivity, Josh concluded “that higher speed isn’t associated with higher on-field production.” Today I want to take a deep dive into the question of how much 40-yard dash times are correlated with wide receiver success. For a very long time, people have argued that 40-yard dash times are overrated (actually, for a very long time, people have argued that just about everything is overrated). But such a comment is paper thin, because it’s unclear exactly how “rated” 40-yard dash times are, anyway. So let’s skip the overrated/underrated analysis and dive into the data.

My sample comprises the 853 wide receivers who ran the 40-yard dash at the NFL combine from 2000 to 2017. [1]Why those years? PFR’s data only goes back to 2000, and players who participated at the combine more recently than 2017 have not yet accrued four NFL seasons. All data is publicly available from PFR, via Stathead Football. I then looked at how many receiving yards those players gained in their first four seasons in the NFL. [2]Chosen because this represents the average length of a rookie contract. The question of what metric to use to measure production is a complicated one: receiving yards is not perfect (and I will revisit this decision at the end of the article), but it should work well enough for these purposes.

On average, these 853 players ran the 40-yard dash in 4.51 seconds and gained a total of 678 receiving yards in their first four seasons; this includes the 360 of them who never gained a receiving yard in the NFL. The top three wide receivers by receiving yards over this period [3]This analysis, of course, excludes players who were not invited to the combine like Tyreek Hill and Josh Gordon, undrafted players like Victor Cruz, Robby Anderson, and Doug Baldwin, and players who … Continue reading were Michael Thomas, A.J. Green, and Anquan Boldin, who ran the 40-yard dash in 4.57, 4.48, and 4.72 seconds, respectively. Strike one for 40-yard dash times mattering. The fastest two players were John Ross and Donte’ Stallworth, who both ran the 40 in 4.22 seconds. [4]That might sound like strike two, but Stallworth was tied for the 61st most receiving yards out of this group if 853 receivers. It’s a strike for 40-yard dash time being the only thing that … Continue reading

But anecdotes can only take us so far when we have 853 players, from Ross and Stallworth on the far left, to Thomas up at the top, all the way to Mississippi State’s De’Runnya Wilson, who never played in the NFL and ran the 40 in 4.85 seconds. [continue reading…]

References

References
1 Why those years? PFR’s data only goes back to 2000, and players who participated at the combine more recently than 2017 have not yet accrued four NFL seasons.
2 Chosen because this represents the average length of a rookie contract.
3 This analysis, of course, excludes players who were not invited to the combine like Tyreek Hill and Josh Gordon, undrafted players like Victor Cruz, Robby Anderson, and Doug Baldwin, and players who skipped the combine like Corey Davis.
4 That might sound like strike two, but Stallworth was tied for the 61st most receiving yards out of this group if 853 receivers. It’s a strike for 40-yard dash time being the only thing that matters, but not for 40-yard dash time having any value.
{ 16 comments }

Los Angeles Makes Another Blockbuster Jared Goff Trade

It was just under 5 years ago that the Rams made a blockbuster trade to acquire the number one overall pick to select Jared Goff. As a reminder, in April 2016, the Rams traded:

the 15th overall selection (WR Corey Coleman), the 43rd [1]Which had been acquired when the Rams traded Sam Bradford to the Eagles. pick (Austin Johnson), the 45th selection (Derrick Henry), and a third round pick (#76, Shon Coleman), plus next year’s first round pick (which turned into the 5th overall pick and Corey Davis) and third round picks (#100, Jonnu Smith)

to Tennessee for

the first overall pick (Goff), and two later round picks in the 2016 Draft (#113-Nick Kwiatkoski, #177-Temarrick Hemingway)

At the time, the Rams probably didn’t think they would be sending the 5th overall pick in 2017, but that’s one of the risks of trading away a future first round pick.  And how did it work out for Los Angeles?  It’s tough to say.  Goff certainly didn’t live up to expectations: the Rams are explicitly telling the world that Goff is not good enough by trading him and a lot of draft capital to Detroit for Matthew Stafford.  On the other hand, not only did Goff have a lot of success with the Rams, but there is some irony in what wound up happening.  The concern in sending a lot of draft capital to move up to draft a quarterback is that you wind up in Jetsland, where New York sent a ton of capital for Sam Darnold and then never could build a team around him.  The Rams didn’t get the franchise quarterback they wanted, but wound up building a great team around Goff despite the lack of draft capital.  One could argue that Los Angeles is one of the top-5 talented teams in the NFL, if you remove the quarterback from the equation.

And that is the gamble Los Angeles is making this weekend.  The Rams just sent Goff, along with the team’s first round picks in both 2022 and 2023 and the 88th pick in the 2021 Draft to Detroit for Matthew Stafford.  And it’s very interesting what the trade says about not just how the Rams, but the entire NFL, view Goff.

Valuing future picks is always challenging because we have to include the time value discount associated with those picks plus the uncertainty of knowing exactly where they will fall in the draft. [2]The Texans have twice traded away top-5 draft picks in recent years without knowing it.  This trade is particularly difficult to analyze because it’s initially unclear whether Goff is an asset (a talented, former number one overall quarterback in his prime) or a liability (a quarterback viewed as significantly overpaid with a contract that is going to cost Detroit $54M in cap dollars over the next two years, unless they cut him, in which case he would cost $44M over the next two years).

What do the Lions want to do? If they are looking to tear down the roster and rebuild, Goff may not have a lot of value — and they could look to trade him or cut him in the next 12 months.  That would mean he is viewed as a liability, and the Rams actually paid less than they would have for Stafford if they didn’t make Detroit take Goff.  On the other hand, are we to assume that no team would have traded for Goff with his existing contract?  If even one team (the Colts? Steelers?) would have offered the Rams something, then there would have been no reason to bundle him in this deal.  But perhaps his contract really was an albatross: we will only find out once we see what the Lions do with him.  As it turns out, we can get a pretty good sense of whether Goff is an asset or a liability by analyzing the rest of the trade.  More on that in a moment.

For Detroit, this closes the book on the Stafford chapter.  Did he disappoint in Detroit?  I think the better summary is that he was a very good player saddled on a bad franchise. There are only four quarterbacks to start 130+ games with one team despite having a losing record: Stafford, Joe Ferguson, Jim Hart, and John Brodie.  Here is every quarterback-team relationship with 130+ starts, with their collective winning percentage on the X-Axis and their number of starts on the Y-Axis.  I have put Stafford, Ferguson Hart, and Brodie in team colors; yes, Stafford has the worst winning percentage of the group. [3]And yes, this cut-off was intentional, and historians should have been able to guess that Archie Manning started 129 games for the Saints.

So how much is Los Angeles giving up to get Stafford?  Some NFL teams put a full round discount on future picks, which would make a 2022 1st round pick equal to a 2021 2nd round pick, and a 2023 1st round pick equal to a 2021 3rd round pick.   That is more justifiable when, like with the Rams, the expectation at least is that those first round picks will not be top-10 picks.  If we use the Jimmy Johnson calculator, and treat the ’22 1st as equivalent to the 45th pick and the ’23rd 1st like the 75th pick, that implies L.A. sent value equal to the 20th or 21st pick in this year’s draft.  But that is probably the wrong way to analyze the situation: it assumes too significant a discount, as we would expect Stafford to be worth more than that (for example, Indianapolis has a quarterback need and the 21st overall pick in this year’s draft, and that presumably would not have been enough to get Stafford).

So if that discount is too high, how do we determine the right discount?  Let’s start by saying the average first round pick is worth 18.4 points on my chart, equivalent to the 13th overall selection (because the dropoff in value is logarithmic). On the JJ Chart, the average first round pick is about the same, falling in between the 12th and 13th overall picks.

If we use a 10% discount rate, that would make a 2022 1st round pick equal to the 17th pick on my chart and the 15th on the JJ Chart. Use a 20% discount rate, and a 2022 1st round pick is equal to the 23rd pick on my chart and the 17th on the JJ chart; a larger discount rate than that is hard to justify. For a 2023 1st round pick, using a 10% discount rate, we get the 22nd pick or the 17th pick on the FP and JJ charts, and equivalent to the 36th pick and the 24th pick in 2021 using a 20% discount rate.

Here, the Rams are getting Stafford, a relatively known commodity. [4]It’s important to keep in mind that often teams trade future firsts with a specific rookie player in mind; when Atlanta traded a future first round pick for the 6th pick in the draft it … Continue reading Does that argue for a higher discount rate? Perhaps so. So let’s say we use the 20% number. How do we value the 88th pick in this year’s draft plus the two first rounders the next two years? [5]Of course, the Rams are without a first round pick in 2021 due to the Jalen Ramsey trade. If we consider the 2022 and 2023 first round picks to be average in value, and then apply a 20% discount, those picks combined with the 88th overall selection are equivalent to the 32.6 points on the Football Perspective Draft Value Chart and 1817 points on the traditional, JJ Chart. That’s equal to between the 1st and 2nd picks on my chart, or the 4th pick on the traditional chart.

And that is… a lot. I feel pretty confident in saying that such a collection of picks is worth more than Stafford alone. The Jets and Dolphins are the 2nd and 3rd picks, and I don’t see any reason to think either team would trade that pick for Stafford. Miami in particular might be a great landing spot for a player like Stafford, but there was no indication that the Dolphins were willing to offer up the 3rd overall pick for Stafford.

Which means the Rams — and the NFL — must view Goff as a liability. Stafford alone isn’t worth the 3rd pick in the draft, but Stafford is worth the 3rd pick along with Goff’s contract.

References

References
1 Which had been acquired when the Rams traded Sam Bradford to the Eagles.
2 The Texans have twice traded away top-5 draft picks in recent years without knowing it.
3 And yes, this cut-off was intentional, and historians should have been able to guess that Archie Manning started 129 games for the Saints.
4 It’s important to keep in mind that often teams trade future firsts with a specific rookie player in mind; when Atlanta traded a future first round pick for the 6th pick in the draft it wasn’t for the generic 6th pick; it was for Julio Jones, a player they certainly had a very high grade on. That sort of certainty and opportunity (after all, the 6th pick if used on Jones might be worth the 1st overall pick to Atlanta if he was the top player on their board) would make teams more comfortably trading more, which would imply a higher discount rate on future picks.
5 Of course, the Rams are without a first round pick in 2021 due to the Jalen Ramsey trade.
{ 0 comments }

Trading 2 First Round Picks For A Player

The Seahawks gave up how much for Adams?

There have been 8 trades in the 21st century where an NFL veteran was traded for two first round picks. [1]I understand that this is an arbitrary way to look at trading players. The Vikings received the 7th pick in the 2005 Draft for Randy Moss; that’s a more valuable draft haul than getting first … Continue reading Today I am going to analyze those trades.

In half of those cases — the older ones — the player was traded before the NFL Draft, which allowed the trading team to get some immediate draft picks. In the other half (which have all occurred in the last three years), the team trading away two first round picks wouldn’t lose any picks until the next season; presumably, that helped incentivize them to make the deal, as there is always a discount rate applied to trading future picks.

Let’s look at these 8 trades, from who gave up the least to who gave up the most. Note that I am only looking at draft value (or players, when included in the trade) sent over for the player; I am ignoring the contract part of the analysis, along with how good the player actually was. On to the list… [continue reading…]

References

References
1 I understand that this is an arbitrary way to look at trading players. The Vikings received the 7th pick in the 2005 Draft for Randy Moss; that’s a more valuable draft haul than getting first round picks in 2006 and 2007 from a team that’s expected to be very good. For purposes of this post, I will note players traded after the NFL Draft, and applying a discount (10% in the next season, 20% for two seasons away) when appropriate.
{ 0 comments }

For purposes of today’s post, I am defining major college football programs in the South and Texas as the schools in three major conferences. These 30 schools represent most of the major college football programs in the South, Southeast, and Texas. However, I am going to exclude the “northern” schools from these conferences, for reasons that will soon become clear.

The three conferences are the SEC, the ACC, and the former Southwestern Conference (the SWC). The 30 schools are:

  • 13 of the 14 current SEC schools, excluding Missouri. [1]These include all 10 schools in the SEC as of the late 1960s, plus three schools that would otherwise qualify anyway: South Carolina (then in ACC), Texas A&M (then in the SWC), and Arkansas (then … Continue reading
  • 11 of the 14 current ACC schools, excluding Syracuse, Boston College, and Pittsburgh. [2]These include all 8 ACC schools at the time other than Maryland (now in the Big 10 and a “northern” school) and South Carolina (included in this analysis by virtue of being in the SEC … Continue reading
  • The Texas schools that were in the SWC at the time: that includes these 6 schools: [3]In addition to Texas A&M and Arkansas, which are of course now in the SEC. Texas, TCU, Texas Tech, Baylor, Rice, and SMU.

So why am I excluding the northern schools? They integrated much earlier than the southern schools. Most of the schools in this group of 30 didn’t really integrate until the very late ’60s or early ’70s. Meanwhile, Jim Brown was playing at Syracuse in 1954 and Bobby Grier was famously playing at Pittsburgh at the same time. I also chose to use the old SWC rather than the current Big 12, because that is more reflective of those times. Schools like Nebraska, Kansas, and Missouri were in the old Big 8, but those schools were much better at integration than the old SWC. Also, other schools in Texas, like Houston, were a few years ahead of the Texas schools in the SWC. We will deal with the non-SWC Texas schools at the end.

So now we have our group of 30 schools that were the major college programs in the south or Texas over the last 60 years. And, thanks to yesterday’s work, we have a history of players drafted from HBCUs. So let’s compare: the graph below shows the draft value used on players from these 30 southern schools in red compared to the draft value spent on players from HBCUs in blue. You can see a clear dip in talent in the southern/Texas schools in the late ’60s, and it’s directly related to segregation: [continue reading…]

References

References
1 These include all 10 schools in the SEC as of the late 1960s, plus three schools that would otherwise qualify anyway: South Carolina (then in ACC), Texas A&M (then in the SWC), and Arkansas (then in the SWC).
2 These include all 8 ACC schools at the time other than Maryland (now in the Big 10 and a “northern” school) and South Carolina (included in this analysis by virtue of being in the SEC now), plus Louisville (then MVC) and the four schools that were independent at the time — Florida State, Virginia Tech, Miami, and Georgia Tech.
3 In addition to Texas A&M and Arkansas, which are of course now in the SEC.
{ 0 comments }

The first NFL Draft took place in 1936. But for players attending Historically Black Colleges and Universities (HBCUs), it wasn’t until 1950 that the draft would hold any significance. Later, for a short window in the late ’60s and early ’70s, players from these tiny HBCUs dominated the draft. And finally, with a few notable exceptions, the prominence of HBCU players in the NFL Draft all but disappeared. Today, a look at NFL draft results and how players from HBCUs were valued in each draft. However, to start the story in the 1950s would be woefully inadequate. [continue reading…]

{ 1 comment }

AFL vs NFL: The Drafts (1961-1966)

The biggest signing in AFL history.

From 1961 to 1966, the upstart American Football League and NFL competed off the field in a battle for the top players from college football. The rival leagues would hold two separate drafts — in later years, on the same day — and then compete to sign these players. Sometimes, the two leagues would battle over stars: North Carolina State’s Roman Gabriel was drafted second overall by the NFL’s Rams and first overall by the AFL’s Raiders in 1962. A year before, Tulane’s Tommy Mason was the 1st pick in the NFL Draft (Vikings) and the 2nd pick in the AFL Draft (Patriots). There were a number of future Hall of Famers like Mike Ditka, Merlin Olsen, and Gale Sayers who were highly coveted by both leagues. In other cases, though, prospect evaluation 50 years later is a bit more complicated.

Both leagues placed heavy emphasis placed on both signability, which could lead to drastically different draft outcomes for players. While Oregon State QB Terry Baker was drafted first overall by the NFL’s Rams, the AFL didn’t even feign interest in the Heisman Trophy winner, letting him fall to the 12th round of the ’63 AFL Draft. And top-5 NFL picks like Tucker Frederickson, Bob Brown, Ken Willard, and Randy Beisler weren’t even drafted in the AFL! This went the other way, too: Memphis lineman Harry Schuh was the 3rd overall pick in the AFL Draft, but no team in the NFL Draft wasted a pick on him. Buck Buchanan was the first pick in the AFL Draft in ’63, but was only a very late pick in the NFL Draft (more on him in a minute). The gamesmanship increased prior to the 1964 draft season, as the NFL instituted Operation Babysitter, designed to babysit (or kidnap) draft prospects during critical windows so AFL teams couldn’t contact them! Oh, and every once in awhile, neither league would win in a fight over a top player. [1]I bring you the story of famed guard/defensive lineman Tom Brown from Minnesota — who led the Gophers to a national championship in 1960, finished as the runner up in the Heisman Trophy, and … Continue reading [continue reading…]

References

References
1 I bring you the story of famed guard/defensive lineman Tom Brown from Minnesota — who led the Gophers to a national championship in 1960, finished as the runner up in the Heisman Trophy, and won both the Outland Trophy and the Big 10 Player of the Year award. Brown was drafted by the AFL in the first round… after having been drafted by the NFL in the 9th round two years earlier …. and ultimately chose to go play up north in the CFL. Mack’s teammate, black quarterback and Rose Bowl hero Sandy Stephens, was a second round pick of the Browns and first round pick of the Jets. However, neither the NFL nor AFL wanted him to play quarterback, so he, too, went to Canada to play in the CFL.
{ 0 comments }

Yesterday, I looked at the draft capital allocated to each position in the 2020 NFL Draft. I noted that significantly more draft capital was used on offensive tackles than on guards or centers, which is even more striking when you realize that there were 2 OTs and 3 interior offensive linemen on every play.

So how does the 2020 NFL Draft compared historically to other drafts, in terms of allocating draft capital to tackles versus interior linemen? For purposes of this post, I reduced draft capital allocated to guards and centers by one third in every draft class, to make for a more apples to apples comparison. In that case, most years, significantly more draft capital is allocated to tackles, and that number is on the rise.

The last time more draft capital on a per position basis was used on interior offensive linemen than offensive tackles was in 1990. That year, tackle Richmond Webb was the first lineman drafted, but the next five OL were all guards or centers: Bern Brostek, Keith Sims, Tim Grunhard, Leo Goeas, and Glenn Parker. The most OT-heavy draft relative to guards and centers was in 2008, when Jake Long went first overall, and six other offensive tackles went in the first round: Ryan Clady, Chris Williams, Gosder Cherilus, Jeff Otah, Sam Baker, and Duane Brown. The only guard drafted in the first round was Branden Albert, who played guard in college and was drafted as such, and then played left tackle for his entire NFL career.

The graph below shows the draft capital allocated to offensive tackles (in black) and interior offensive linemen (in red) in each year since 1967. Again, I have multiplied the draft capital allocated to guards and centers by two thirds to compare the positions more evenly. [continue reading…]

{ 0 comments }

The NFL Draft is a good way to measure how the league values particular positions. Last year, it was all about the defensive line: edge rushers and interior defenders dominated the draft, with over a quarter of all draft capital spent on these players. Two years ago, it seemed as though the running game was back in vogue: after quarterback, running back was perhaps the most highly valued position in the ’18 Draft, and a lot of draft capital was used on non-pass rushing linebackers.

Which positions did NFL teams focus on in the 2020 NFL Draft? We can use the Football Perspective Draft Value Chart to answer that question pretty easily for the first 224 picks (all picks after that have been excluded, since they have a draft value of zero). Prior to the 2020 Draft, we were told that this would be one of the most WR-heavy drafts in NFL history. That turned out to be accurate: a whopping 210.3 points of draft capital were used on wide receivers, the 8th-most of any draft since 1967 (the record is 224.9, set in 2000). There were a record eleven wide receivers were drafted in the first 50 picks, breaking the old mark in the modern era of ten, set in 1994.

For defensive coordinators, they will get an influx of talent in the secondary. The graph below shows the amount of draft value used on each position in the 2020 NFL Draft. I split front seven players into interior defensive lineman (labeled as DI), edge rushers, and linebackers; there is going to be some overlap for certain players (as well as between CB/S, and guards and centers or tackles, and occasionally amongWR/RB/QB) but I did the best I could to pick one label for each player. [continue reading…]

{ 0 comments }

The 2020 Draft is now over, which means there are an endless number of places where you can read recaps, draft grades, and who are the winners and losers of the past three days. But there are no answers yet to how the 2020 draft prospects will turn out; on the other hand, we now have 5 years of data to analyze the 2015 Draft. So let’s do that today.

Sports Illustrated’s draft experts Chris Burke & Doug Farrar graded each team’s draft five years ago, and I will be using that recap in this article. Burke and Farrar handed out 4 A grades — including one to Minnesota and one to Jacksonville. With the benefit of hindsight, what do the numbers say? As it turns out, according to my methodology, the Vikings did indeed have the single best draft. Nice job, Chris and Doug!  Here’s what Farrar wrote about the Vikings haul:

Minnesota’s primary needs were at cornerback and offensive tackle. It dealt with the first issue at pick No. 11 by taking Michigan State’s Trae Waynes, a highly physical and aggressive press cornerback. He’ll be a perfect bookend for Xavier Rhodes if he learns to deal with crossing routes and avoids a heap of penalty flags. Pitt right tackle T.J. Clemmings dropped to the fourth round due to medical concerns, but if the converted defensive lineman can stay healthy, he might be the best tackle out of this class in a couple years. Second-round linebacker Eric Kendricks should be able to start right away in the middle of Mike Zimmer’s defense, while third-round pass-rusher Danielle Hunter from LSU is both freakishly athletic and raw like sushi. He’ll need some time with a line coach, but there’s a lot to like there. In addition, the Vikings got two much-needed targets for Teddy Bridgewater: Southern Illinois tight end MyCole Pruitt (one of my favorite small-school guys this year) and Maryland speed receiver Stefon Diggs, who can line up all over the place.

Waynes, the team’s first overall pick, was a disappointment: he was inconsistent during his time with the Vikings, and was only a full-time starter for the last 3.5 years. The team did not resign him, and he’s now in Cincinnati.  Clemmings didn’t quite turn out as planned, although he did start for 30 games for the team.  But for a team that didn’t nail its first pick, the rest of the draft was superlative. Diggs, a 5th round pick, has been the best receiver in the Draft outside of perhaps Amari Cooper, who went 4th overall. Hunter has been one of the steals of draft, recording a 2015 class-high of 54.5 sacks.   And Kendricks has turned into one of the best linebackers in the league, earning first-team All-Pro nods in 2019.

On the other hand, Jacksonville’s draft hasn’t quite been so good.

The Jaguars are coming. Maybe not in 2015, maybe not in 2016, but soon. This draft without question kept this franchise’s positive momentum, from a talent standpoint, rolling in the right direction. Jacksonville made one solid decision after another, right through Notre Dame tight end Ben Koyack in round 7.

Opinions varied on this class’s top pass rusher, but Dante Fowler was at or near the top of the list, and Gus Bradley can turn him into a star. Running back T.J. Yeldon and guard A.J. Cann should be starters by Week 1, as well. But the real gems here came in rounds 5 and 6, respectively: Florida State wide receiver Rashad Greene, a sharp route-runner and productive performer; and penetrating three-tech tackle Michael Bennett, a remarkable value at pick No. 180.

The Jaguars caught some bad breaks with Fowler: he tore his ACL on the first day his first mini-camp, and never quite turned into the edge rusher the Jaguars were expecting. He was traded to the Rams in October 2018 for a 2019 late 3rd round pick (Quincy Williams) and a 2020 fifth rounder. He signed this offseason with the Falcons.  Yeldon was a bust: two years later, the Jaguars used the 4th overall pick on Leonard Fournette in part because of Yeldon’s failures.  Cann has been a five-year starter, but is a below-average starting guard.  Greene caught 2 touchdowns in his Jaguars career, while had 0.5 sacks; both were not in the NFL in 2019.  The Jaguars got nothing more than warm bodies in rounds 4 through 7, and their high picks in rounds 1 and 2 were disappointing, leaving Cann — the 67th overall pick — as the highlight of a bad draft.

Burke and Farrar handed out just 2 really bad grades; a C to the Bills and a C+ to the Colts.  Here’s what Burke wrote about the Bills.

The Bills started this draft at a disadvantage, having coughed up their first-round selection to add Sammy Watkins last year. They did well at No. 50 to add a borderline round 1 talent in cornerback Ronald Darby, but it’s hard to guarantee any of their other picks will make an impact. Guard John Miller (No. 81) has the clearest shot. Buffalo is thin at guard and Miller, though limited overall, fits the mauler mold Rex Ryan favors. Sixth-round tight end Nick O’Leary was productive at Florida State. Can he find any playing time with two players similar to him in style, Charles Clay and Chris Gragg, ahead of him on the depth chart?

Instead of the detailed analysis, let’s just say this: none of the Bills draftees were still on the team four years later, and Ryan was gone after 2016.

Here was the Colts analysis:

The Colts caught everyone off-guard at No. 29 with their selection of speedy wide receiver Phillip Dorsett. He is an exciting weapon and a home-run threat whenever he’s on the field, but Indianapolis already had Andre Johnson, T.Y. Hilton and Donte Moncrief locked in place at receiver. Sure, sticking to an approach of taking the best player available is generally advisable. The Colts, though, believe they are on the brink of a Super Bowl berth, and it’s hard to argue the Dorsett pick got them closer than an upgrade on defense would have.

Those defensive moves did follow. Cornerback D’Joun Smith and defensive end Henry Anderson (both third-rounders) have starter qualities, and safety Clayton Geathers is a nice depth/special teams piece.

Geathers wound up starting the most games for the Colts among this group, and he’s currently a free agent.  Dorsett was utlimately flipped by Jacoby Brissett, which turned out to be a great trade, but he was disappointing in Indianapolis (although an aging Johnson was a reason to invest in wide receivers, not avoid the position).  Anderson turned out to be a solid player with the Jets, but this was one of the drafts that ultimately led to Ryan Grigson’s termination.  Kudos to Burke and Farrar for nailing that both the Colts and Bills struggled in the 2015 Draft.

On the other hand, the Seahawks were given a B- grade and

Pete Carroll and John Schneider have built up a lot of equity with great pick after great pick since they took over the Seahawks organization in 2010, but they tested a lot of that faith with the second-round selection of Michigan edge-rusher Frank Clark, a third- to fourth-round prospect in the minds of many before you throw in the domestic violence issue that got him kicked off the Wolverines last November. Clark had better be special on the field and perfect off it, because Carroll and Schneider are taking a huge risk here. The move to trade up for Kansas State receiver Tyler Lockett in the third round was better-received, and for good reason. He’s an outstanding return man and the kind of speedster who can take the top off a defense—just what Seattle needs. Seattle also took three offensive linemen: San Diego State tackle Terry Poole (who projects as a guard), West Virginia’s Mark Glowinski (who might kick inside to center) and Buffalo defensive tackle Kristjan Sokoli, who the Seahawks want to turn into a guard. The guy to watch in Seattle’s draft is Towson cornerback Tye Smith, regarded by many as the best small-school pass defender in the 2015 class. He’ll get a legitimate shot to crash into the Legion of Boom.

Seattle entered the draft without a first round pick thanks to the Jimmy Graham trade, but Lockett and Clark were two of the steals of the 2015 Draft.  Clark had 32 sacks in his 2nd, 3rd, and 4th seasons, before being traded for a late 1st round pick in 2019 and the 64th pick in 2020; that’s an excellent return for a player drafted with the 63rd pick. Lockett has been the third most valuable receiver in this draft so far, behind only Cooper and Diggs.  And on a yards per target basis — a disfavored metric in these parts — Lockett has been playing at a Hall of Fame level.  This was one draft grade that should have been much higher.

I went through the 2015 Draft and calculated how much marginal AV was provided by each player in his first five seasons (Marginal AV being Approximate Value over 2 in each year).  Here is how each draftee fared, relative to their expected marginal AV from the draft value curve.

This was a very good draft, with Kevin White being the only complete bust in the top ten (other than him and Fowler, the others all started at least for four seasons). Stefon Diggs, Marcus Peters, Danielle Hunter, and Eric Kendricks graded as the four players who most exceeded their draft slot, making this a remarkable draft for the Vikings.  The chart below shows each team, along with their SI Draft Grade, the total Marginal AV produced by the draft picks, and the AV over expectation (i.e., giving credit to teams that had less draft capital).  As you can see, the Vikings were the best team in the draft when it comes to AV over expectation, although the Bucs matched them (in addition to Jameis Winston with the first overall pick, Donovan Smith, Ali Marpet, and Kwon Alexander all turned into regular starters.

Finally, here are the grades on each player in the draft, using PFR’s Approximate Value.

RkPlayerTeamRdPickPosDraft ValAct ValDiff
1Stefon Diggsmin5146WR2.93431.1
2Marcus Peterskan118CB16.24629.8
3Danielle Huntermin388DE6.13528.9
4Eric Kendricksmin245ILB10.43625.6
5Shaq Masonnwe4131C3.62824.4
6Todd Gurleyram110RB19.94323.1
7Benardrick McKinneyhtx243ILB10.63322.4
8Tyler Lockettsea369WR7.63022.4
9Trent Brownsfo7244OT02121.0
10Donovan Smithtam234OT12.13320.9
11David Johnsoncrd386RB6.22720.8
12Grady Jarrettatl5137DT3.32420.7
13Trey Flowersnwe4101DE5.22418.8
14Ali Marpettam261C8.42516.6
15Rob Havensteinram257OT8.92516.1
16Bobby Hartnyg7226OG01616.0
17Tevin Colemanatl373RB7.32315.7
18Kwon Alexandertam4124OLB3.91915.1
19Andrus Peatnor113OT18.33314.7
20Melvin Gordonsdg115RB17.43214.6
21Malcom Brownnwe132DT12.52714.5
22Jameis Winstontam11QB34.64914.4
23Adrian Amoschi5142FS31714.0
24Frank Clarksea263DE8.22213.8
25Landon Collinsnyg233SS12.32613.7
26Preston Smithwas238DE11.42513.6
27A.J. Cannjax367OG7.82113.2
28Jordan Hicksphi384OLB6.41912.6
29Tyeler Davisonnor5154DT2.51512.5
30Jamison Crowderwas4105WR51712.0
31Za'Darius Smithrav4122DE41612.0
32Daryl Williamscar4102OT5.11711.9
33Laken Tomlinsondet128OG13.42511.6
34Mitch Morsekan249OT9.82111.2
35Eddie Goldmanchi239DT11.32210.7
36Jay Ajayimia5149RB2.71310.3
37Duke Johnsoncle377RB6.91710.1
38Trevor Siemianden7250QB099.0
39Mark Glowinskisea4134OG3.4128.6
40Byron Jonesdal127CB13.6228.4
41John Millerbuf381OG6.6158.4
42Marcus Mariotaoti12QB30.2387.8
43Leonard Williamsnyj16DT23.2317.8
44Rodney Guntercrd4116DT4.3127.7
45Kyle Emanuelsdg5153OLB2.6107.4
46Amari Cooperrai14WR25.8337.2
47Austin Reiterwas7222C0.276.8
48David Parryclt5151NT2.796.3
49Damien Wilsondal4127ILB3.8106.2
50Quandre Diggsdet6200CB0.976.1
51Denzelle Goodclt7255OT066.0
52Darius Philonsdg6192DT1.175.9
53Max Garciaden4133C3.595.5
54Henry Andersonclt393DE5.7115.3
55T.J. Clemmingsmin4110OT4.7105.3
56Jake Ryangnb4129OLB3.795.3
57Darren Wallerrav6204WR0.765.3
58Jamon Brownram372OT7.4124.6
59Steven Nelsonkan398CB5.4104.6
60Markus Goldencrd258OLB8.7134.3
61Bud Dupreepit122DE14.9194.1
62Javorius Allenrav4125RB3.984.1
63Darryl Robertsnwe7247CB044.0
64Shaq Thompsoncar125OLB14.1183.9
65JJ Nelsoncrd5159WR2.363.7
66Rakeem Nunez-Rocheskan6217DT0.343.7
67Hayes Pullardcle7219ILB0.343.7
68Christian Covingtonhtx6216DT0.443.6
69Jordan Phillipsmia252DT9.4133.6
70Bobby McCainmia5145CB2.963.1
71Denzel Perrymansdg248ILB9.9133.1
72Ramik Wilsonkan4118ILB4.272.8
73Vic Beasleyatl18OLB21.4242.6
74Ronald Darbybuf250CB9.7122.3
75Ty Montgomerygnb394WR5.782.3
76Danny Sheltoncle112DT18.8212.2
77David Mayocar5169ILB1.942.1
78Devin Funchesscar241WR11132.0
79Chris Conleykan376WR792.0
80Corey Robinsondet7240OT022.0
81Jesse Jamespit5160TE2.341.7
82Tony Lippettmia5156WR2.441.6
83Anthony Chickillopit6212DE0.521.5
84Mike Davissfo4126RB3.851.2
85Angelo Blacksonoti4100DT5.360.7
86Brandon Scherffwas15OT24.3250.7
87Cody Wichmannram6215OG0.410.6
88Matt Joneswas395RB5.660.4
89Andy Gallikoti6208C0.610.4
90Ereck Flowersnyg19OT20.6210.4
91Clayton Geathersclt4109SS4.750.3
92Jon Felicianorai4128OG3.740.3
93Brett Hundleygnb5147QB2.830.2
94D.J. Alexanderkan5172OLB1.820.2
95T.J. Yeldonjax236RB11.8120.2
96Nick Boylerav5171TE1.920.1
97Damarious Randallgnb130FS12.9130.1
98Jake Rodgersatl7225OT000.0
99Martin Ifediram7227DE000.0
100Austin Shepherdmin7228OT000.0
101Ben Koyackjax7229TE000.0
102Marcus Murphynor7230RB000.0
103Joey Iosefatam7231FB000.0
104Edmond Robinsonmin7232OLB000.0
105Da'Ron Brownkan7233WR000.0
106Dezmin Lewisbuf7234WR000.0
107Kenny Hilliardhtx7235RB000.0
108Mark Nzeochadal7236OLB000.0
109Brian Mihalikphi7237DE000.0
110Mario Alfordcin7238WR000.0
111Gerod Hollimanpit7239FS000.0
112Ifo Ekpre-Olomucle7241CB000.0
113Dexter McDonaldrai7242CB000.0
114Laurence Gibsondal7243OT000.0
115Tre McBrideoti7245WR000.0
116Geoff Swaimdal7246TE000.0
117Ryan Murphysea7248FS000.0
118Akeem Kingatl7249DB000.0
119Taurean Nixonden7251DB000.0
120Josh Furmanden7252DB000.0
121Xzavier Dicksonnwe7253OLB000.0
122Rodney Andersonsfo7254TE000.0
123Gerald Christiancrd7256TE000.0
124Bryce Hagerram7224ILB0.10-0.1
125Nick O'Learybuf6194TE1.11-0.1
126Andre Deboserai7221WR0.20-0.2
127Deon Simonnyj7223NT0.20-0.2
128Anthony Morrisrai7218OT0.30-0.3
129Neal Sterlingjax7220WR0.30-0.3
130C.J. Uzomahcin5157TE2.42-0.4
131Kristjan Sokolisea6214DT0.40-0.4
132Karlos Williamsbuf5155RB2.52-0.5
133Reshard Clietthtx6211OLB0.50-0.5
134Kennard Backmangnb6213TE0.50-0.5
135Tre' Jacksonnwe4111OG4.64-0.6
136Amarlo Herreraclt6207ILB0.60-0.6
137Obum Gwachamsea6209DE0.60-0.6
138Christian Ringognb6210DE0.60-0.6
139Josh Robinsonclt6205RB0.70-0.7
140Aaron Ripkowskignb6206FB0.70-0.7
141Eli Haroldsfo379OLB6.86-0.8
142Bud Sasserram6201WR0.80-0.8
143A.J. Derbynwe6202TE0.80-0.8
144Darius Kilgoden6203DT0.80-0.8
145Randall Telfercle6198TE0.90-0.9
146Leterrius Waltonpit6199DT0.90-0.9
147Jeremy Langfordchi4106RB4.94-0.9
148Malcolm Johnsoncle6195FB10-1.0
149Randall Evansphi6196CB10-1.0
150Derron Smithcin6197FS10-1.0
151Josh Shawcin4120CB4.13-1.1
152Martrell Spaightwas5141OLB3.12-1.1
153B.J. Dubosemin6193DE1.10-1.1
154Charles Gainescle6189CB1.20-1.2
155Ian Silbermansfo6190OG1.20-1.2
156JaCorey Shepherdphi6191CB1.20-1.2
157Ryan Russelldal5163DE2.21-1.2
158Geremy Davisnyg6186WR1.30-1.3
159Evan Spencerwas6187WR1.30-1.3
160Tony Stewardbuf6188OLB1.30-1.3
161Tayo Fabulujechi6183OT1.40-1.4
162Kaelin Claytam6184WR1.40-1.4
163Tyrus Thompsonmin6185OT1.40-1.4
164D.J. Humphriescrd124OT14.413-1.4
165Michael Bennettjax6180DT1.50-1.5
166Kyshoen Jarrettwas6181SS1.50-1.5
167Tevin Mitchelwas6182CB1.50-1.5
168Isaiah Battleram5177 [1]Selected in Supplemental Draft.OT1.60-1.6
169Deiontrez Mountoti6177OLB1.60-1.6
170Matthew Wellsnwe6178LB1.60-1.6
171Max Vallesrai6179OLB1.60-1.6
172Cameron Artis-Paynecar5174RB1.70-1.7
173Keith Mumpheryhtx5175WR1.70-1.7
174Robert Myersrav5176OG1.70-1.7
175James O'Shaughnessykan5173TE1.80-1.8
176Tye Smithsea5170CB1.90-1.9
177Joe Cardonanwe5166LS20-2.0
178Damian Swannnor5167CB20-2.0
179Michael Burtondet5168FB20-2.0
180Lorenzo Dossden5164CB2.10-2.1
181Bradley Pinionsfo5165P2.10-2.1
182Neiron Ballrai5161OLB2.20-2.2
183Kenny Belltam5162WR2.20-2.2
184Shaquille Riddickcrd5158DE2.40-2.4
185Jamil Douglasmia4114OG4.42-2.4
186Jarvis Harrisonnyj5152OG2.60-2.6
187Cedric Thompsonmia5150FS2.70-2.7
188Davis Tullnor5148OLB2.80-2.8
189DeVante Parkermia114WR17.815-2.8
190Carl Davisrav390DT5.93-2.9
191MyCole Pruittmin5143TE30-3.0
192Mykkele Thompsonnyg5144S30-3.0
193Ben Heeneyrai5140ILB3.10-3.1
194Jaquiski Tarttsfo246SS10.27-3.2
195Ameer Abdullahdet254RB9.26-3.2
196David Cobboti5138RB3.20-3.2
197Rashad Greenejax5139WR3.20-3.2
198Tray Walkerrav4136CB3.30-3.3
199Marcus Hardisoncin4135DT3.40-3.4
200Ibraheim Campbellcle4115SS4.41-3.4
201Nelson Agholorphi120WR15.512-3.5
202DeAndre Smeltersfo4132WR3.50-3.5
203Arie Kouandjiowas4112OG4.61-3.6
204Terry Poolesea4130OT3.60-3.6
205Cameron Ervingcle119OT15.812-3.8
206P.J. Williamsnor378CB6.93-3.9
207Vince Maylecle4123WR40-4.0
208Doran Grantpit4121CB4.10-4.1
209Sammie Coatespit387WR6.22-4.2
210Andrew Donnalram4119OT4.20-4.2
211Blake Bellsfo4117TE4.30-4.3
212Gabe Wrightdet4113DT4.50-4.5
213Nate Orchardcle251OLB9.65-4.6
214Arik Armsteadsfo117DE16.612-4.6
215Justin Hardyatl4107WR4.80-4.8
216Jalston Fowleroti4108FB4.80-4.8
217Chaz Greendal391OT5.91-4.9
218Mario Edwardsrai235DE127-5.0
219James Samplejax4104SS50-5.0
220Bryce Pettynyj4103QB5.10-5.1
221Tyler Kroftcin385TE6.31-5.3
222Paul Dawsoncin399OLB5.30-5.3
223Hroniss Grasuchi371C7.52-5.5
224Craig Magersdg383CB6.51-5.5
225Xavier Coopercle396DT5.50-5.5
226Geneo Grissomnwe397OLB5.50-5.5
227Clive Walfordrai368TE7.72-5.7
228Jeff Heuermanden392TE5.80-5.8
229Jeremiah Poutasioti366OT7.92-5.9
230Sean Mannionram389QB60-6.0
231Jordan Richardsnwe264SS8.12-6.1
232Cedric Ogbuehicin121OT15.29-6.2
233Quinten Rollinsgnb262CB8.32-6.3
234Lorenzo Mauldinnyj382OLB6.50-6.5
235Alex Carterdet380CB6.70-6.7
236Eric Rowephi247CB10.13-7.1
237Garrett Graysonnor375QB7.10-7.1
238Owamagbe Odighizuwanyg374DE7.20-7.2
239Randy Gregorydal260DE8.51-7.5
240Jaelen Stronghtx370WR7.50-7.5
241Ty Sambrailoden259OT8.61-7.6
242D'Joun Smithclt365CB80-8.0
243Dorial Green-Beckhamoti240WR11.13-8.1
244Phillip Dorsettclt129WR13.25-8.2
245Trae Waynesmin111CB19.311-8.3
246Jake Fishercin253OT9.31-8.3
247Hau'oli Kikahanor244OLB10.52-8.5
248Stephone Anthonynor131ILB12.74-8.7
249Senquez Golsonpit256CB90-9.0
250Maxx Williamsrav255TE9.10-9.1
251Shane Rayden123DE14.65-9.6
252Breshad Perrimanrav126WR13.94-9.9
253Jalen Collinsatl242CB10.80-10.8
254Devin Smithnyj237WR11.60-11.6
255Kevin Johnsonhtx116CB16.93-13.9
256Dante Fowlerjax13OLB27.69-18.6
257Kevin Whitechi17WR22.20-22.2

References

References
1 Selected in Supplemental Draft.
{ 0 comments }

Five players from LSU and four players from Alabama were drafted in the first round of the 2020 NFL Draft last night, the latest in a long line of draft dominance from two of the powerhouses of college football. In addition, another 6 players from the SEC had their names called during the first round: two from Georgia, two from Auburn, and one from both Florida and South Carolina. That gave the conference a record 15 players selected in the first round of the 2020 NFL Draft.

The previous record for players from one conference getting selected in first round of an NFL Draft was 12, set by the ACC in 2006 and matched by the SEC in both 2013 and 2017. [1]If you wanted to be cheekyy, and I would expect nothing less out of you, the schools in the current SEC also had 13 players drafted in 2011… when there were 10 players from the SEC drafted in … Continue reading For as long as I can remember — and, assuredly, for longer than that — SEC fans have boasted about the football talent within its conference. At times, the reputation has exceeded the results. But in recent years, there’s no question that the draft has become dominated by the conference. How much more dominant is the SEC at the top of the NFL Draft relative to prior years? [continue reading…]

References

References
1 If you wanted to be cheekyy, and I would expect nothing less out of you, the schools in the current SEC also had 13 players drafted in 2011… when there were 10 players from the SEC drafted in the first round, along with three others from Texas A&M and Missouri, Big 12 schools that now play in the SEC. One could also play this game with the Big 10 and the 1963 NFL draft, when among the first 32 players were 9 players from Big 10 schools, plus four more from Penn State and Maryland.
{ 0 comments }

In the 1969 NFL Draft, 8 of the first 10 picks were used on offensive players. In total, 64% of all draft capital — according to the Football Perspective Draft Value Chart — was used on offensive players. Two years later, the first three picks were all used on quarterbacks; only 1 of the first 9, and 2 of the first 13 players selected, were on the defensive side of the ball.

As recently as 1995, the first five picks were all used on offensive players, as were 8 of the first 10 picks. But more recently, NFL teams have been much more even in their draft day gifts to offensive and defensive coordinators.

In 2016 and 2017, teams actually used significantly more draft capital on defense than on offense. This year, according to CBS, an almost perfect 50/50 split is expected. The graph below shows the percentage of actual draft capital allocated to offensive players each season, compared to the total amount allocated to both offensive and defensive players. [continue reading…]

{ 0 comments }

The 2000 NFL Draft was the most wide receiver-heavy draft in NFL history. Peter Warrick, Plaxico Burress, and Travis Taylor went in the top 10 picks, Sylvester Morris and R. Jay Soward also went in the first round, and another eleven (11!) wide receivers went in the first 100 picks after that: Dennis Northcutt, Todd Pinkston, Jerry Porter, Ron Dugans, Dez White, Chris Cole, Ron Dixon, Laveranues Coles, JaJuan Dawson, Darrell Jackson, and Gari Scott.

In case you can’t tell by those names, the draft was a complete dud. Expected to revolutionize the NFL with a new wave of athletic wide receivers, the entire class combined to make just 1 Pro Bowl at wide receiver — Coles in 2003 (Dante Hall, drafted in the fifth round, would make two Pro Bowls as a returner). Coles, Burress, and Jackson were all good players, but they were also the only three to eclipse even 5,000 receiving yards.

Twenty years later, we are looking at the next “greatest wide receiver class” of a generation. Oklahoma’s CeeDee Lamb and Alabama’s Jerry Jeudy will be early first round picks; they are expected to be joined in the first round by Jeudy’s teammate, Henry Ruggs III, Clemson’s Tee Higgins, and possibly  LSU’s Justin Jefferson, Arizona State’s Brandon Aiyuk, or Colorado’s Denzel Mims.

I looked at the CBS 7-round mock draft and calculated the Draft Value used on wide receivers. Why CBS? Because they were the first website I found that put together a clean table of all draft picks for all 7 rounds, making it easy to calculate draft value. Draft value is simply calculated as the value assigned to each pick, according to my draft value chart, that is used on a wide receiver.

Based on the CBS projections — which has WRs going at 12, 14, 15, 21, 30, 34, 37, 42, 50, 51, and 58 — this would be an outstanding draft class for wide receivers. And while none would be selected in the top 10, there would be a total of 201.6 points of draft capital spent on wide receivers. That would make this one of the top 10 drafts for wide receivers since the common draft era beginning in 1967.

The graph below shows the draft capital used on the position in each draft since 1967. [continue reading…]

{ 0 comments }

2020 Draft Value: Which Teams Gained And Lost The Most?

Which teams have gained and lost the most draft value? Using the 2019 team records and the draft value chart, this is a relatively simple question to answer. The table below shows the pick in the first round each team earned based on its 2019 performance, along with their record, the total draft value assigned based on their 2019 performance, the current draft value they have as of today, and the difference between those two numbers.

Earned Pick #Team2019 RecordDraft Value AssignedCurrent Draft ValueDifference
5Dolphins5-1154.793.638.9
9Jaguars6-1049.671.521.9
25Vikings10-63756.519.5
28Ravens14-235.650.715.1
12Raiders7-946.260.214.0
15Broncos7-944.853.99.1
27Seahawks11-536.242.46.2
11Jets7-946.451.95.5
3Lions3-12-159.564.65.1
21Eagles9-739.842.42.6
3149ers13-334362.0
23Patriots12-438.639.91.3
14Buccaneers7-945.4460.6
10Browns6-104949.30.3
7Panthers5-1152.752.70.0
30Packers13-334.534.2-0.3
17Cowboys8-842.240.4-1.8
32Chiefs12-433.331-2.3
6Chargers5-1153.851.2-2.6
1Bengals2-1467.464.4-3.0
16Falcons7-944.241.1-3.1
4Giants4-1257.252-5.2
29Titans9-73529.1-5.9
20Rams9-740.434.4-6.0
13Colts7-945.938.1-7.8
24Saints13-33826.8-11.2
8Cardinals5-10-151.137.8-13.3
26Texans10-63723.5-13.5
2Redskins3-1362.548.5-14.0
22Bills10-639.123-16.1
19Bears8-841.524.4-17.1
18Steelers8-84223.1-18.9

And here’s the same information but in chart form: the X-Axis shows the Football Perspective Draft Value assigned to each team based on its 2019 performance, and the Y-Axis shows the current draft value for each team. Teams above the line gained value, while teams below the line lost value. [continue reading…]

{ 0 comments }

The 2019 Draft Class Was Another QB-Heavy Draft

The 2019 Draft was another good one for quarterbacks. Oklahoma QB Kyler Murray was the first overall pick to the Cardinals, Duke passer Daniel Jones was taken by the Giants with sixth pick, and Ohio State’s Dwayne Haskins was the 15th pick to Washington. The Broncos took Missouri Tiger Drew Lock with the 42nd pick, rounding out the class of top prospects.

Over the last 20 years, there were 56 quarterbacks selected in the first round, or just under three per year; there were also 68 quarterbacks taken in the first 50 picks, so the 2019 class was slightly more quarterback-heavy than normal.  It was also the 14th time in the last 20 drafts that a quarterback went first overall.

The draft below shows the draft capital — using the Football Perspective Draft Value Chart to assign draft capital to each pick — used on quarterbacks in all drafts since 1967.  As you can see, 2019 was not as quarterback-heavy as 2018, but it was still a draft that saw more draft capital used on quarterbacks than average.

[continue reading…]

{ 1 comment }

The NFL Draft is a good way to measure how the league values particular positions. Last year, it seemed as though the running game was back in vogue: after quarterback, running back was perhaps the most highly valued position in the 2018 Draft, and a lot of draft capital was used on non-pass rushing linebackers.

Which positions did NFL teams focus on in the 2019 NFL Draft? We can use the Football Perspective Draft Value Chart to answer that question pretty easily for the first 224 picks (all picks after that have been excluded, since they have a draft value of zero).  This was a draft for interior defensive linemen and edge rushers, but even more notable was the absence of draft capital spent on interior offensive linemen.

Consider that 3 out of every 22 players on a football field, at all times, is a guard or center.  All else being equal, you would expect 14% of all draft picks and all draft capital to be spent on interior offensive linemen.  That means 1 out of every 7.3 draft picks should be an offensive guard or center, but in the first 73 draft picks, there were just 5 interior offensive linemen selected.  Just 8% of the first 100 picks were guards or centers, and overall, only 8.4% of all draft capital was spent on guards and centers. Here’s the full list of draftees. [continue reading…]

{ 0 comments }

In March 2013, the Steelers let Mike Wallace leave in free agency for Miami, which would give Pittsburgh a compensatory draft pick at the end of the 3rd round of the 2014 Draft. That seemed to encourage some bad drafting behavior. A couple of months later, during the 2013 Draft, Pittsburgh traded its own 2014 3rd round pick to Cleveland for the 111th pick in the Draft to grab safety Shamarko Thomas. Pittsburgh traded its own 3rd round pick next year for the Browns 4th round pick that year because the team needed Thomas.

Well, Thomas ended up busting, and the Steelers used the compensatory pick on Dri Archer, another bust. Pittsburgh wound up trading the 83rd pick in the 2014 Draft for the 111th pick in the 2013 Draft, which is rarely a smart move. For Cleveland, the team used that 83rd pick to move up in the 1st round and get Johnny Manziel, so the story doesn’t have a happy ending there, either. And the actual 83rd pick turned out to be Louis Nix III, which means everyone tied to these transactions (including the Dolphins) with a pair of snake eyes.

Why that context when talking about the 2019 Draft? Well, the Steelers are going to get a 3rd round compensatory pick in the 2020 Draft after letting Le’Veon Bell leave for the Jets in March 2019. That seemed to encourage Pittsburgh to freely give away its own 2020 3rd round selection…

1)
Steelers trade: 20th overall, 52nd overall (2nd round), 2020 3rd round pick
Broncos trade: 10th overall

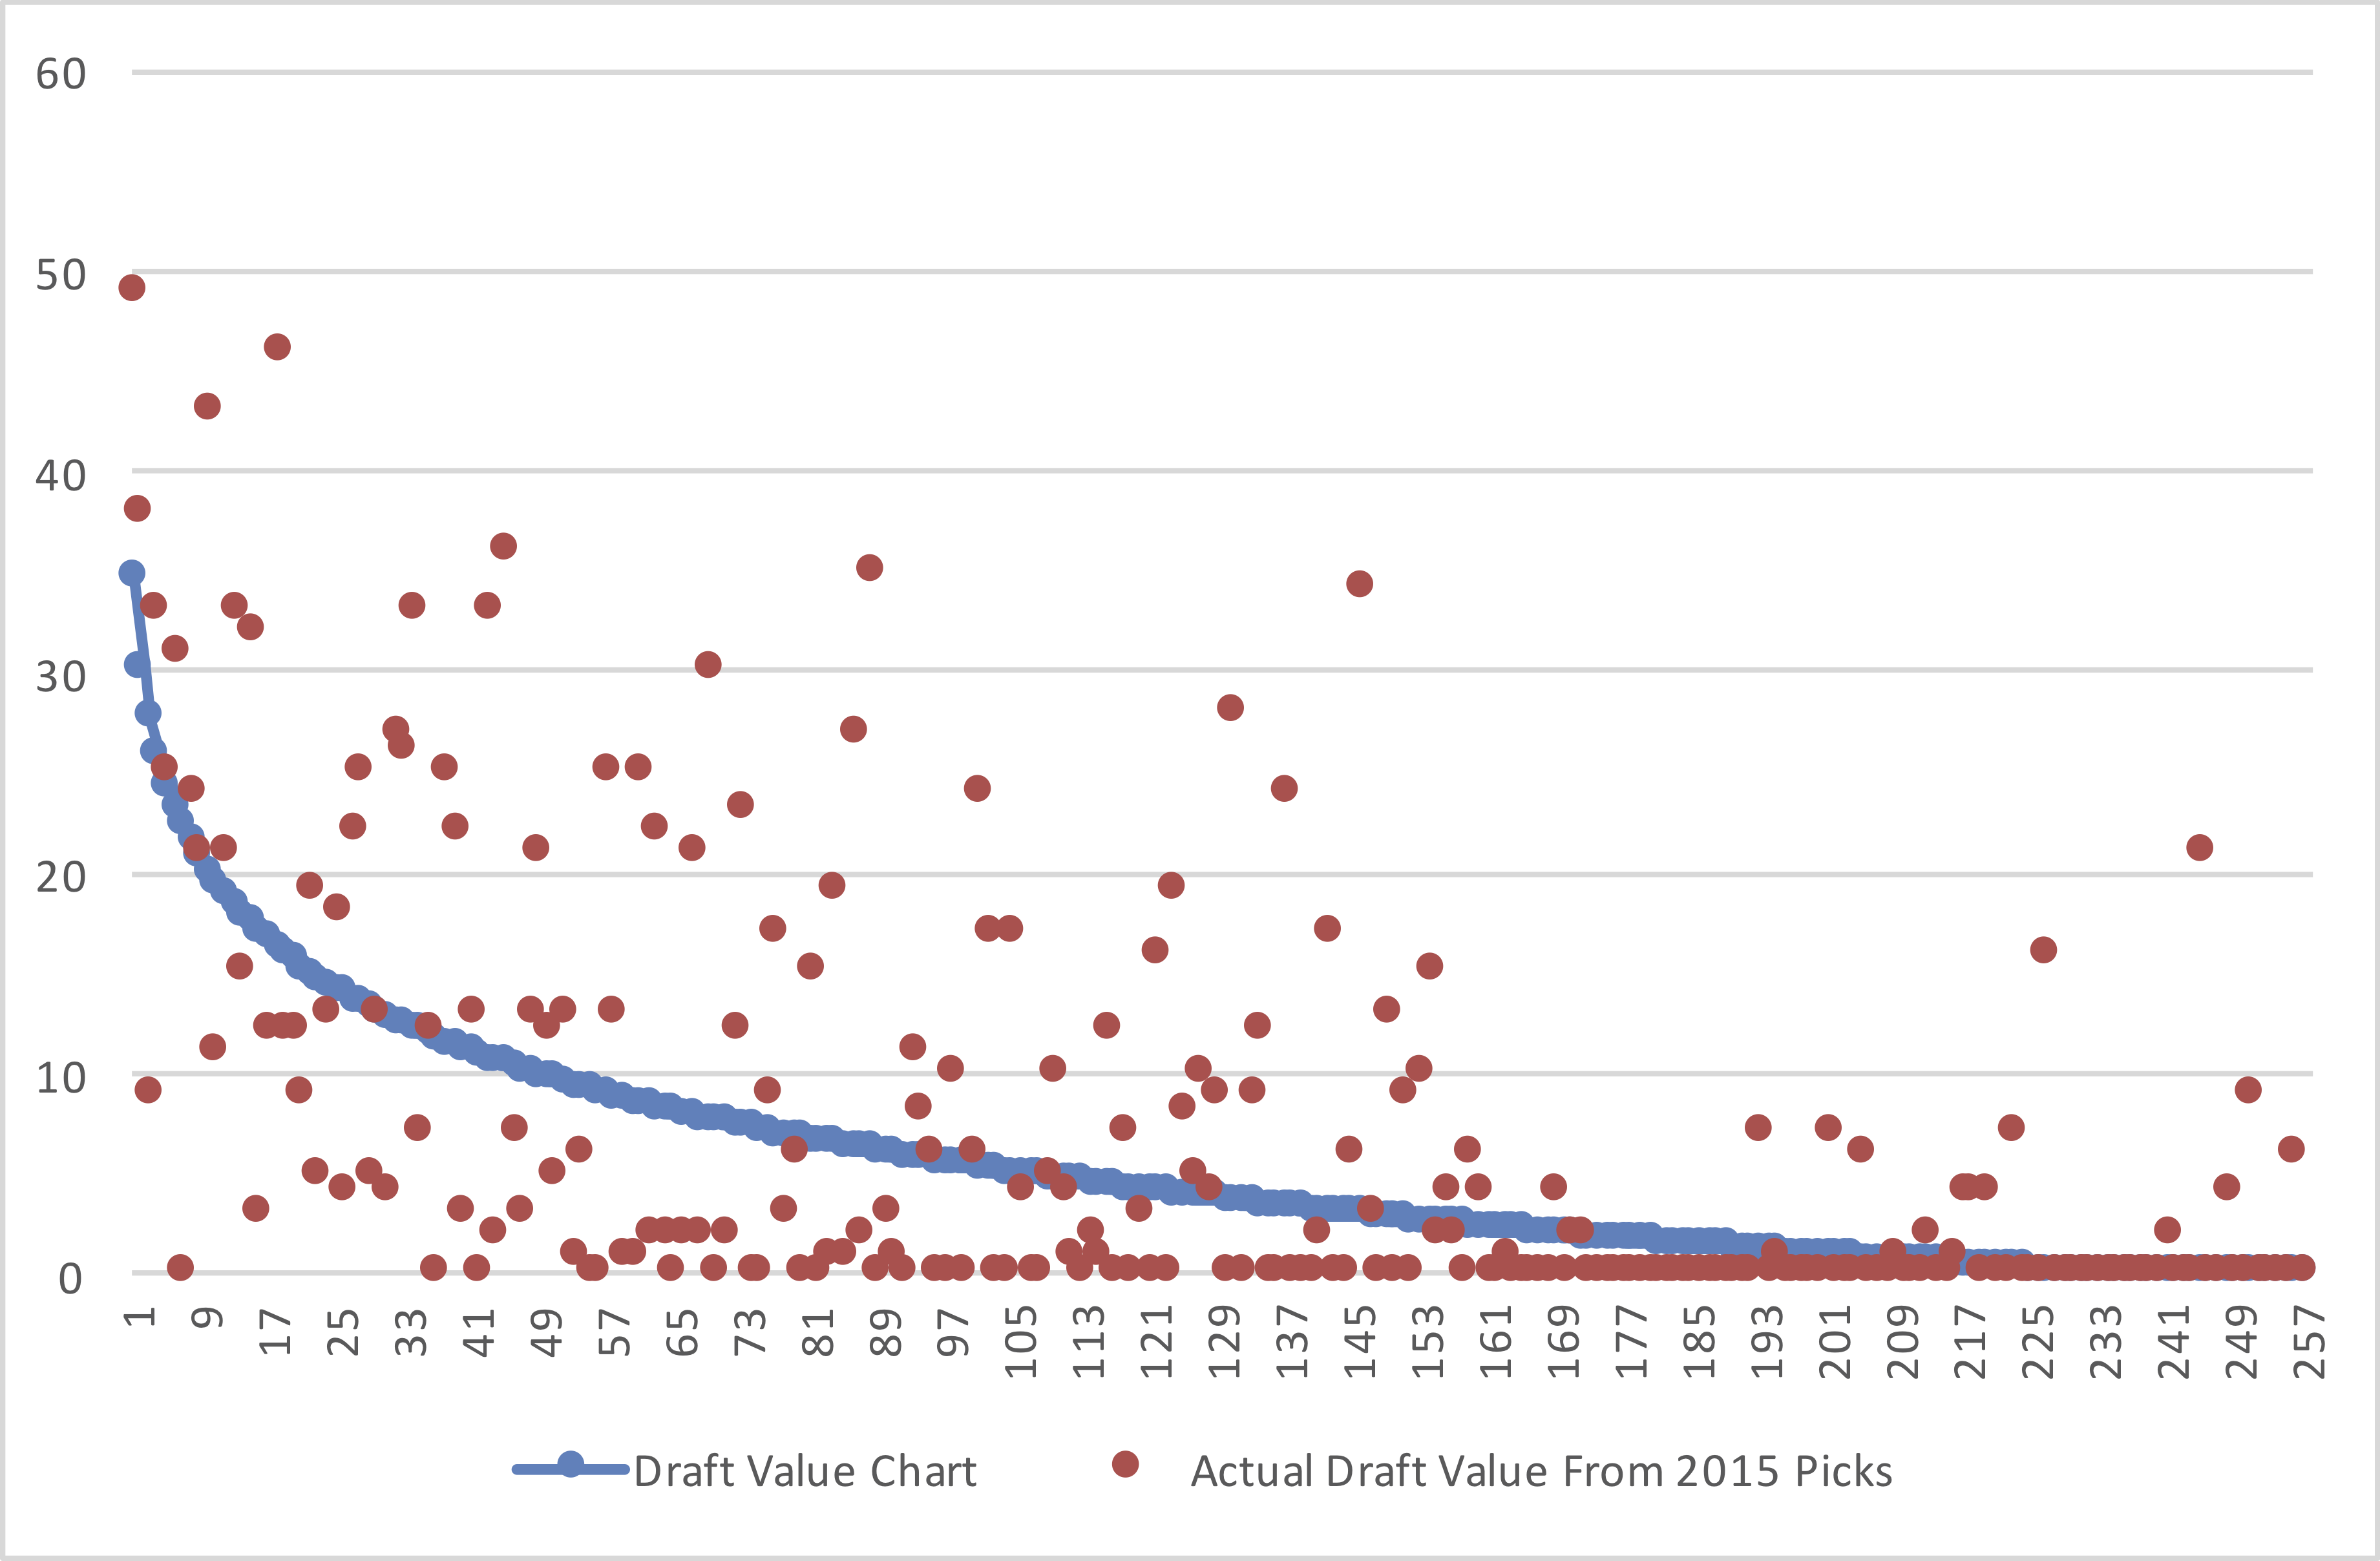
Pittsburgh traded up Michigan inside linebacker Devin Bush, while Denver would take Iowa TE Noah Fant with the 20th pick. How much did Pittsburgh give up?  Let’s assume the 2020 3rd round pick is valued at the 96th pick in this Draft, which is the last pick in the 3rd round (so this puts in some discount for losing a future pick rather than a current one).  By my draft value chart, it means that Pittsburgh paid 153 cents on the dollar, sending 30.4 points of AV for 19.9 points of AV.  By the traditional draft value chart, Pittsburgh gave up 104 cents on the dollar, a more reasonable sum.

The reality is that the Steelers likely viewed the 2020 3rd round pick as free money, courtesy of losing Bell.  The price to move up was not out of the ordinary, but the ordinary transaction is a bad one for the team moving up.

2)

Packers trade: 30th overall, 114th overall (4th round), and 118th overall (4th round)
Seahawks trade: 21st overall

By my chart, Seattle did a solid job here, forcing the Packers to pay 141 cents on the dollar.  By the traditional chart, the Seahawks were basically looking to get whatever they could to trade down, as Green Bay paid only 93 cents on the dollar!  It is rare for the team trading up to pay so little, so this is a strong sign that it was a buyer’s market for moving up (is that a reflection of teams getting smarter or the talent distribution in this particular draft?)

Green Bay moved up for Maryland safety Darnell Savage, while Seattle would trade this pick again an hour later. This was probably a good trade for both sides, as the Packers were able to get the player they wanted while only giving up a pair of 4th round picks, and the Seahawks added a few more swings at the plate later on.

3)

Eagles trade: 25th overall, 127th overall (4th round), 197th overall (6th round)
Ravens trade: 22nd overall

Philadelphia moved up to draft Washington State tackle Andre Dillard, the second offensive tackle off the board. This was likely a necessity, as Philadelphia jumped Houston with the 23rd pick. On my chart, the Eagles gave up 127 cents on the dollar, while this was a near perfect match on the traditional chart (99.7 cents on the dollar). This is a trade that makes a lot of sense: Philadelphia didn’t have to overpay by much to make a trade that matched their needs perfectly.

4)

Redskins trade: 46th overall (2nd round), 2020 2nd round pick
Colts trade: 26th overall

Washington moved up to get Mississippi State edge rusher Montez Sweat, who was the 40-yard dash superstar this year. If we value Washington’s 2nd round pick as equal to the 64th pick in this year’s draft, the Redskins gave up 132 cents on the dollar for Sweat, who perhaps fell in the first round due to a misdiagnosed heart condition. By the traditional chart, this would be sending 101 cents on the dollar.

So this is a great trade for Washington if you view Sweat as a top-20 player and the 2020 2nd round pick as the 64th pick in this year’s draft. The concern, of course, is that the Redskins might be very bad next year. If this turns out to be, say, the 36th pick in the draft, and you apply no time value discount, the traditional chart would say Washington paid 140 cents on the dollar while my chart would say Washington paid 158 cents on the dollar.

It is always risky for a bad team to trade a future pick, but Sweat at least profiles as the sort of player you can understand trading up for, especially since the premium wasn’t that significant.

For Indianapolis? This was another smart way to add value.

5)
Giants trade: 37th overall (2nd round), 132nd overall (4th round), 142nd overall (5th round)
Seahawks trade: 30th overall

The Giants picked up the 132nd pick in the Odell Beckham trade and the 142nd pick in the Damon Harrison trade. Both of those trades were hard to defend on the merits, but now New York has muddied the ultimate analysis for those trades! By sending those two picks, along with the Giants early 2nd round pick, New York was able to get Georgia cornerback Deandre Baker.

By my chart, the Giants paid 140 cents on the dollar, but on the traditional chart, it was a trade of just 98 cents on the dollar.  Again, teams often (mistakenly) view extra picks as free picks: here, at least for Giants fans, the price to move up was not very high.

6) Falcons trade: 45th overall (2nd round), 79th overall (3rd round)
Rams trade: 31st overall, 203rd overall (6th round)

By my chart, Atlanta sent 127 cents on the dollar to move up; by the traditional chart, Atlanta sent 106 cents on the dollar. The Falcons grabbed Washington offensive tackle Kaleb McGary, giving up two solid picks in the process. Still, this was not an egregious overpay, which is something we have seen in past years as teams try to trade back into the end of the first round. Last year, the Ravens moved up to the 32nd pick for Lamar Jackson, and in doing so, gave up the 52nd pick and a 2019 2nd rounder and also moved down 7 slots in the 4th round.  Atlanta at least paid a cheaper price than that, but this was still a good way to grab some extra value by Los Angeles.

{ 1 comment }

Kyler Murray Will Break The Mold Tonight

Kyler Murray is going to be drafted tonight, likely very early in the 2019 Draft. At 5’10, he is really short for a first round quarterback: like really short.

Davey O’Brien (yes, that Davey O’Brien), standing 5’7, is the shortest quarterback ever selected in the first round. He was the 4th overall pick in the 1939 Draft. There have been no quarterbacks taken in the first round who were 5’8 or 5’9, and only five were standing exactly 5-foot-10: Ted Marchibroda (yes, that Ted Marchibroda), Travis Tidwell, Ernie Case, Boley Dancewicz, and Frankie Albert. All of these players were drafted in 1950 or earlier.

The modern draft era begins in 1967, when the AFL and NFL joined forces for the common draft. Since then, the shortest quarterbacks drafted are 6’0 Michael Vick and Johnny Manziel. And only 6 quarterbacks who were 6’1 went in the first round: Baker Mayfield, Jim McMahon, Clint Longley, Bob Griese, Rex Grossman, and Cade McNown. There have been no quarterbacks who were 5’11 and drafted in the first round, and tonight, Murray will become the first 5’10 quarterback drafted in the first round since 1950.

The graph below shows the distribution, by height, of quarterbacks selected in the first round since 1967. [continue reading…]

{ 0 comments }

Yesterday, I took another look at the draft value chart and the appropriate values we should assign to each draft pick. One conclusion was that the value of all draft picks has increased, as more AV is going to players on rookie contracts.

Today, I want to specifically examine the claim that since the NFL instituted the rookie wage scale as part of the 2011 CBA, teams are giving more playing time and production to players on rookie contracts. For all graphs today, I will be separating players into two categories: players who are in their first 4 seasons will be graphed in red, and veterans in their 5th seasons or later will be graphed in black. [continue reading…]

{ 1 comment }

Revisiting the Draft Value Chart

It has now been seven years since I created the Football Perspective Draft Value Chart (longtime readers know that at Pro-Football-Reference, I created something similar 11 years ago).

You can see all the values for the Football Perspective Draft Value Chart here and there’s a link on the home page to those same values embedded in the FP Draft Value Calculator. The FP chart was derived from analyzing drafts from 1970 to 2007, and by looking at the marginal Approximate Value produced by players in each of their first five seasons. In short, I gave players credit for all AV produced above 2 points of AV each year. If a player had AV scores of 0, 4, 1, 7, and 10, that translates to 15 marginal points. To create the Draft Value Chart, I simply calculated the average number of marginal points produced by each draft pick from ’70 to ’07 and smoothed out the results.

But now, with 7 more years of data, we can look at the drafts from 2008 through 2014, and see how those players have faced in their first 5 seasons. How has the FP Chart done since then?

When analyzing results over a small period, there will obviously be outliers. One out of every 7 players taken with the 75th pick doesn’t turn into Russell Wilson, one out of every 7 players taken with the 154th pick doesn’t turn into Richard Sherman, and so on. The 92nd pick, with T.Y. Hilton, Trai Turner, Cliff Avril, Joe Barksdale, Shawn Lauvao, and Jerraud Powers was extremely good at getting consistent starters (Stedman Bailey being the exception).

And even the number one picks have been very good over this stint: Jake Long, Matthew Stafford, Sam Bradford, Cam Newton, Andrew Luck, Eric Fisher, and Jadeveon Clowney is a pretty good stretch; JaMarcus Russell just missed the cut. Here are the average results from these 7 drafts in terms of marginal AV produced by these players in their first five years:

Now, how does that compare to the Football Perspective Drat Values? And what would the results from ’08 to ’14 look like if we smoothed the results? I’m glad you asked! I’ve reprinted the results below, but added the FP Draft Value Chart line in red, and a smoothed, best-fit line of the ’08 to ’14 results in blue.

On first glance, I have two immediate takeaways.

One, the FP Draft Value Chart looks pretty good: it’s directionally correct, and holds up over time and a small sample.  It doesn’t have the super steep decline of the JJ Draft Value Chart, which has the 3rd pick worth twice as much as the 11th pick, and the 11th pick worth twice as much as 35th pick.

The other takeaway is that almost all the picks are more valuable, and that is not a function of small sample size: it’s a function of the rookie wage scale. Players taken in the 3rd, 4th, and 5th rounds are now expected to contribute, because the bar has been lower.  If a 4th round pick costs a fraction of what a veteran costs, teams will be more willing to give that player a chance to produce even if he isn’t very good.  This artificially inflates AV, since AV is tied to metrics like starts and games played.  Teams are giving more starts and snaps to players on rookie contracts because of the rookie salary cap, and that leads to more AV — and distorts the draft value chart a bit.

My overall suspicion is the success of first overall picks from ’08 to ’14 distorts the steepness of the graph — it doesn’t appear like the 2nd and 3rd picks are doing any better than they used to — and that is likely due to small sample size (although the first overall picks since ’14 also seem pretty good so far, too!).   And on a relative basis, I am not sure much has changed in the draft value chart world.  But I do think it’s fair to acknowledge that draft picks are more valuable than they used to be and my Draft Value Chart implies, and that’s worth thinking about when teams trade multiple picks for one pick.

As always, please leave your thoughts in the comments.

{ 1 comment }

Last year, I wrote a two-part series on how teams were using more highly drafted players. In 2017, 50% of all passes came from players selected in the top 32 of the draft, but I suspected that 2018 could be even more tilted in favor of highly drafted players. The reasons I suspected all came true, namely:

Thanks to those new starters, plus returning starters Eli Manning, Jared Goff, Matthew Stafford, Cam Newton, Jameis Winston, Alex Smith, Mitchell Trubisky, Carson Wentz, Marcus Mariota, Matt Ryan, Blake Bortles, Philip Rivers and 101 pass attempts from Blaine Gabbert – and yes, those 101 attempts were necessary — 2018 was a record-setting year.  Over half of all pass attempts in the NFL came from players drafted in the top 10 just the second time that’s happened since 1967 (the year of the common draft).
[continue reading…]

{ 0 comments }

The 2014 Draft, Five Years Later

The 2014 Draft is now 5 years in the rear view mirror, which makes it a good time to review the results of that draft.

The graph below shows each player from the 2014 Draft. The X-Axis shows the amount of draft capital spent on each pick, in reverse order. So those players on the left side of the graph were drafted early, with late round picks on the far right side of the graph. The Y-Axis shows the amount of Career AV that player has produced, according to PFR.

[continue reading…]

{ 1 comment }

2019 Draft Value

As regular readers know, I have my own draft pick value chart, which — unlike the Jimmy Johnson chart which was designed to reflect the value given up by teams in trade — is based on the actual value produced by players, historically, with that pick. I also have a Draft Pick Value Calculator, which uses my values, and a version that uses the Jimmy Johnson values.

With that in mind, we can assign draft values to all of the picks in the 2019 Draft, now that the compensatory picks have been handed out.  Those grades are shown below. [continue reading…]

{ 0 comments }

The Patriots Are Smarter Than Everyone

The New England Patriots just won the Super Bowl, which means they should be picking last in each round.

But because they are the New England Patriots, that’s not the case. In fact, New England is tied with the Browns for having the 8th-most draft capital in the 2019 Draft… even after trading away three picks! How did that happen?

Let’s start with what the Patriots lost.

  • Last March New England traded with Cleveland to acquire defensive tackle Danny Shelton, sending a 2019 3rd round pick for Shelton and the Browns 2018 5th round pick. Shelton wound up being only a part-time player for the Patriots (he played on 31% of the team’s defensive snaps), although New England also sent that 2018 5th round selection to Oakland to acquire Cordarrelle Patterson.
  • This past September, the Patriots against traded with the Browns, sending the team’s 2019 5th round pick to Cleveland for wide receiver Josh Gordon. The return was pretty good, as Gordon had 720 yards and 3 touchdowns in 11 games.
  • Finally, back in September 2017, the Patriots traded their 2019 6th round pick to the Lions for defensive back Johnson Bademosi. While only lasting a season in New England, Bademosi played in every game on defense and special teams.

Okay, so New England entered the 2019 Draft down its 3rd, 5th, and 6th round picks, and also had the last pick in the 1st, 2nd, 4th, and 7th rounds. That sounds really bad! But New England was able to add a ton of value through the compensatory draft picks process along with a couple of shrewd trades.

  • New England also got the 252nd pick in the draft — which is essentially worthless, but hey it’s still a pick! — for Cameron Fleming.

And on the trading front, New England did very well, too.

  • During the 2018 Draft, the Patriots held the 51st pick. The Bears really wanted that pick, so Chicago traded up with New England to draft WR Anthony Miller. In return, the Patriots got back Chicago’s 2019 2nd round pick (#56) to Bears and Chicago’s 2018 4th round pick.
  • With the Bears 2018 4th round pick, New England traded down with the Browns to move down in the 4th round and pick up a 6th rounder. New England then send the Browns 4th round pick to Detroit for the Lions 2019 3rd round pick, as Detroit traded up for DT Da’Shawn Hand. So the Patriots wound up turning the 51st pick in the 2018 Draft into the 56th and 73rd picks in the 2019 Draft and a 2018 6th rounder (Christian Sam).

Based on my draft value chart, the Patriots had 24 points of draft value based on winning the Super Bowl — i.e., having the last pick in every round. New England lost 8.2 points of value in traded, and then got back a whopping 27.7 points of value in comp picks and trade. The Patriots also have three close-to-meaningless picks at the end of round 7, too, which are all valued at zero in my draft value chart. [1]New England traded down from 233 to 250 in the 7th round of last year’s draft with Philadelphia, picking up the Eagles 2019 7th round pick — now #239 — in the process. The Patriots … Continue reading

Here’s a visual to show you how New England did. The first column shows, with blue circles surrounded by red, shows the four picks the Patriots earned based on their 2018 season and that the team still has. The next column — white circles surrounded by red — shows the picks the Patriots lost via trade. And the right column at the end — red circles surrounded by blue — shows the picks New England added by being smarter than everyone else. The Y-Axis shows the draft value (on my chart) of those picks:

For reference, the Patriots have even more draft capital in the 2019 Draft than the Jets, who own the 3rd overall pick in the draft but lost their second round pick in the trade for Sam Darnold. New England has 6 picks in the first 3 rounds of the Draft, which only happens when the rest of the league allows the Patriots to be smarter than them.

References

References
1 New England traded down from 233 to 250 in the 7th round of last year’s draft with Philadelphia, picking up the Eagles 2019 7th round pick — now #239 — in the process. The Patriots also got back from the Browns in the Gordon trade the 243rd pick in the draft, a 7th round pick Cleveland had that originally belonged to Kansas City. And the Patriots picked up that comp pick at the very end of the draft for Fleming.
{ 0 comments }
Previous Posts