
You can hear me on the Bill Barnwell podcast today discussing the origins of the draft value chart, why the top picks are overvalued, and why it still might be a good idea to overpay to trade up in the draft.
Last season, Mitch Trubisky was the second overall pick, Patrick Mahomes went 10th overall, and Deshaun Watson was taken with the 12th selection. It didn’t take long for Watson to start: after Tom Savage was the Texans week 1 starter, Watson replaced him after halftime and started the following week.
Trubisky sat behind Mike Glennon, who had just signed a contract with $18.5M of guaranteed money. Glennon started for four games, and Trubisky sat the rest of the way. Glennon has since been released, earning $18.5M while averaging 4.12 ANY/A in four starts.
As for Mahomes, he sat on the bench behind Alex Smith the entire season. Well, almost the entire year: Mahomes started the meaningless week 17 finale. But there was a good reason for his benching: Smith led the NFL in passer rating in 2017, although he’s since been traded to the Redskins.
Watson wasn’t a top-10 pick, of course, but with three (or four?) quarterbacks likely to go early in the top 10 of the 2018 draft — Sam Darnold, Josh Rosen, Josh Allen, and Baker Mayfield — I wanted to see how early we should expect those quarterbacks to first start a game.
In the table below, I looked at all quarterbacks selected in the top 10 of the common draft (since 1967) and how many team games (treating all seasons as 16-game seasons) it took until their first start. [continue reading…]
There were 66 wide receivers last year who had salary cap hits of at least $2,000,000. Let’s exclude Julian Edelman, who missed the entire season due to injury, and the 18 wide receivers from the 2014-2017 Draft classes, who were all on rookie deals. That leaves 47 veteran wide receivers with cap hits of at least two million dollars last season.
I am also going to eliminate Tavon Austin from the discussion. His contract was so out of whack with reality that it only serves to bias the results in the direction of “there is not much correlation between receiving production and receiving salary.” Since I think the results in this study will find that the correlation is already pretty low between salary and production, my hunch is most people would naturally want to know how much things change (a decent amount, actually) if you remove Austin. He had the 4th-highest cap charge of any wide receiver last year and essentially zero production.
That leaves 46 veteran wide receivers. The R^2 between salary and receiving yards was 0.35 (0.25 if you include Austin), which sounds moderately high but in practice doesn’t mean much. Here’s the best fit formula:
2017 Receiving Yards = 308 + 53.0 * 2017 Salary Cap Charge (in millions)
What this means is that for every million dollars a team spent on a wide receiver last year, you would expect to get an extra 53 receiving yards. In other words, one receiving yard was worth $18,884. A wide receiver at $5M would be expected to produce 573 receiving yards; a wide receiver with a $10M cap charge should produce 838 receiving yards.
Big names like Jordy Nelson, Dez Bryant, Randall Cobb, and DeSean Jackson underperformed their lofty salaries last season. Meanwhile, Adam Thielen, Doug Baldwin, Marquise Goodwin, Kenny Stills, and Jermaine Kearse overperformed their mediocre salaries.
Is getting an extra 53 receiving yards really worth $1M? (If you include Austin, the best-fit formula is 349 + 44.3 * 2017 Salary Cap Charge, meaning you need to spend $1M to get just 44 more receiving yards). Well, part of the answer to that depends on what $1M gets you at other positions. This effect may not be linear, either. This is data snooping, but the players south of $8M appear much less correlated with salary; in other words, the difference between a $4M and an $8M player may be small, but the difference between an $8M player and a $12M player might be large.
This also doesn’t mean that elite wide receivers are overpaid. Consider that Antonio Brown had a cap hit of $13.62M last year, which based on the formula above, means we would expect him to gain 1,029 receiving yards. Since Brown had 1,533 receiving yards, he exceeded expectation by 504 yards. That was the third most of any receiver: [continue reading…]
There were 66 wide receivers with salary cap hits of at least $2,000,000 in 2017, based on data from Over The Cap. There were 67 wide receivers in 2017 who had at least 700 Adjusted Catch Yards, which is receiving yards with a 20-yard bonus for touchdowns and a 5-yard bonus for catches (for reference, Jeremy Maclin with a 40-440-3 line is the cutoff here at exactly 700 ACY). In other words, I wanted to set a bar for both salary cap hits and production that was pretty low, but not so low that the data would be overpopulated with fringe players.
There were 89 wide receivers who had either cap hits of $2M or 700 ACY in 2017. The correlation coefficient between the two variables was 0.31, indicating a moderately positive correlation but nothing more. The graph below shows those wide receivers with salary cap dollars (in millions) on the Y-Axis, and Adjusted Catch Yards on the X-Axis. The most valuable receivers would be on the bottom right (low cap hit, high production) while the least valuable would be on the upper left (high cap hit, low production). [continue reading…]
The Rams defensive line is kind of nuts
On paper this is a tremendous signing, but there is some question over where Suh will line up and whether playing in a 3-4 defense alongside Donald really maximizes his value. Which made me wonder: how often has a team had two former (or future) All-Pro defensive tackles? (Note: (the Eagles now have Haloti Ngata and Fletcher Cox, but Cox has “only” been a second-team All-Pro by the AP, although he was a first-team All-Pro in 2017 by the Sporting News and the Pro Football Writers Association).
It turns out, more often than you might think, although often it’s in a reserve role. In fact, eight teams had three such players!
The 1996 Raiders started Russell Maryland and Chester McGlockton (1995 All-Pro) at defensive tackle, and had a 32-year-old Jerry Ball (1991 AP) and 22-year-old La’Roi Glover (2000 AP) on the bench! The 1992 Seahawks had Cortez Kennedy (1992-1994 AP) and Joe Nash (1984 AP) as starters on the inside, and an end-of-career Keith Millard (1988-1989 AP) on the bench for two games.
The other six: the 1984 49ers (Gary Johnson, Michael Carter, Louie Kelcher), 1981 Bears (Steve McMichael, Alan Page, Dan Hampton), 1974 Chiefs (Curley Culp, Buck Buchanan, Tom Keating), 1968 Chiefs (Buck Buchanan, Ernie Ladd, Curley Culp), and the 1964 and 1965 Bills (Tom Sestak, Jim Dunaway, Tom Keating).
The last time that a team had two former All-Pros on the same roster? Well, it happened twice in 2011 with Albert Haynesworth. He began the season in New England, where he lined up next to Vince Wilfork. He was cut in mid-season and joins the Bucs, where he lined up next to Gerald McCoy. At that point in time, McCoy was not yet an All-Pro, but he would be two years later.
If we limit this to teams that had two players who had been or would be first-team Associated Press All-Pros at DT who also started at least eight games in that season, then this hasn’t happened in a decade. In 2008, Haloti Ngata and Trevor Pryce were on the Ravens, while Vince Wilfork and Richard Seymour were on the Patriots.
Among the most terrifying combinations in terms of both players actually being productive at the same time? Dan Hampton and Steve McMichael on the 1985-1986 Bears, Jerome Brown and Reggie White on the 1990 and 1991 Eagles, Louie Kelcher and Gary Johnson on the 1980 Chargers.
The table below lists all combinations where two former or future first-team All-Pro DTs according to the Associated Press were teammates and each started at least eight games. This includes a very similar Rams duo 50 years ago:
There have been only two players in NFL history to record a 100-yard receiving game before turning 21 years old. Can you name them?
| Trivia hint 1 | Show |
|---|---|
| Trivia hint 2 | Show |
|---|---|
| Trivia hint 3 | Show |
|---|---|
| Click 'Show' for the Answer | Show |
|---|---|
The Steelers rookie was the youngest player since the NFL merger to record a catch: he was 20 years, 299 days old when he recorded his first NFL reception. He is remarkably young, of course: he was the youngest player in the 2017 NFL Draft and also one of the most productive as a rookie. As a sophomore at USC, Smith-Schuster had 1,454 yards in 14 games. He had 123 receiving yards in his first game in college, which came three months shy of his 18th birthday.
He had a remarkable rookie season even if you consider him just an average 21-year-old, and not a really young 21-year-old:
| Games | Receiving | |||||||||||||||
|---|---|---|---|---|---|---|---|---|---|---|---|---|---|---|---|---|
| Rk | Player | Year | Age | Draft | Tm | Lg | G | GS | Tgt | Rec | Yds ▼ |
Y/R | TD | Y/G | Ctch% | Y/Tgt |
| 1 | Randy Moss* | 1998 | 21 | 1-21 | MIN | NFL | 16 | 11 | 124 | 69 | 1313 | 19.03 | 17 | 82.1 | 55.6% | 10.59 |
| 2 | Amari Cooper | 2015 | 21 | 1-4 | OAK | NFL | 16 | 15 | 130 | 72 | 1070 | 14.86 | 6 | 66.9 | 55.4% | 8.23 |
| 3 | Mike Evans | 2014 | 21 | 1-7 | TAM | NFL | 15 | 15 | 122 | 68 | 1051 | 15.46 | 12 | 70.1 | 55.7% | 8.61 |
| 4 | Keenan Allen | 2013 | 21 | 3-76 | SDG | NFL | 15 | 14 | 105 | 71 | 1046 | 14.73 | 8 | 69.7 | 67.6% | 9.96 |
| 5 | Sammy Watkins | 2014 | 21 | 1-4 | BUF | NFL | 16 | 16 | 128 | 65 | 982 | 15.11 | 6 | 61.4 | 50.8% | 7.67 |
| 6 | JuJu Smith-Schuster | 2017 | 21 | 2-62 | PIT | NFL | 14 | 7 | 79 | 58 | 917 | 15.81 | 7 | 65.5 | 73.4% | 11.61 |
| 7 | Josh Gordon | 2012 | 21 | 2-1 | CLE | NFL | 16 | 13 | 96 | 50 | 805 | 16.10 | 5 | 50.3 | 52.1% | 8.39 |
| 8 | DeAndre Hopkins | 2013 | 21 | 1-27 | HOU | NFL | 16 | 16 | 91 | 52 | 802 | 15.42 | 2 | 50.1 | 57.1% | 8.81 |
| 9 | Percy Harvin | 2009 | 21 | 1-22 | MIN | NFL | 15 | 8 | 91 | 60 | 790 | 13.17 | 6 | 52.7 | 65.9% | 8.68 |
| 10 | Hakeem Nicks | 2009 | 21 | 1-29 | NYG | NFL | 14 | 6 | 74 | 47 | 790 | 16.81 | 6 | 56.4 | 63.5% | 10.68 |
| 11 | Larry Fitzgerald | 2004 | 21 | 1-3 | ARI | NFL | 16 | 16 | 115 | 58 | 780 | 13.45 | 8 | 48.8 | 50.4% | 6.78 |
| 12 | Jeremy Maclin | 2009 | 21 | 1-19 | PHI | NFL | 15 | 13 | 91 | 56 | 773 | 13.80 | 4 | 51.5 | 61.5% | 8.49 |
| 13 | Reggie Bush | 2006 | 21 | 1-2 | NOR | NFL | 16 | 8 | 121 | 88 | 742 | 8.43 | 2 | 46.4 | 72.7% | 6.13 |
| 14 | Antonio Bryant | 2002 | 21 | 2-63 | DAL | NFL | 16 | 15 | 93 | 44 | 733 | 16.66 | 6 | 45.8 | 47.3% | 7.88 |
| 15 | Kenny Britt | 2009 | 21 | 1-30 | TEN | NFL | 16 | 6 | 75 | 42 | 701 | 16.69 | 3 | 43.8 | 56.0% | 9.35 |
| 16 | Christian McCaffrey | 2017 | 21 | 1-8 | CAR | NFL | 16 | 10 | 113 | 80 | 651 | 8.14 | 5 | 40.7 | 70.8% | 5.76 |
| 17 | Kenny Stills | 2013 | 21 | 5-144 | NOR | NFL | 16 | 10 | 50 | 32 | 641 | 20.03 | 5 | 40.1 | 64.0% | 12.82 |
| 18 | Andre Reed* | 1985 | 21 | 4-86 | BUF | NFL | 16 | 15 | 48 | 637 | 13.27 | 4 | 39.8 | |||
| 19 | Ricky Nattiel | 1987 | 21 | 1-27 | DEN | NFL | 12 | 3 | 31 | 630 | 20.32 | 2 | 52.5 | |||
| 20 | Gern Nagler | 1953 | 21 | 14-167 | CRD | NFL | 11 | 11 | 43 | 610 | 14.19 | 6 | 55.5 | |||
Something particularly notable about his production last year? His catch rate was over 70% and his yards per reception was over 15, all while gaining at least 800 yards. Since 1992, he was just the 4th player to hit those three marks:
| Games | Receiving | |||||||||||||||
|---|---|---|---|---|---|---|---|---|---|---|---|---|---|---|---|---|
| Rk | Player | Year | Age | Draft | Tm | Lg | G | GS | Tgt | Rec | Yds | Y/R | TD | Y/G | Ctch% | Y/Tgt |
| 1 | Jordy Nelson | 2011 | 26 | 2-36 | GNB | NFL | 16 | 9 | 96 | 68 | 1263 | 18.57 | 15 | 78.9 | 70.8% | 13.16 |
| 2 | Tyreek Hill | 2017 | 23 | 5-165 | KAN | NFL | 15 | 13 | 105 | 75 | 1183 | 15.77 | 7 | 78.9 | 71.4% | 11.27 |
| 3 | John Taylor | 1993 | 31 | 3-76 | SFO | NFL | 16 | 16 | 74 | 56 | 940 | 16.79 | 5 | 58.8 | 75.7% | 12.70 |
| 4 | JuJu Smith-Schuster | 2017 | 21 | 2-62 | PIT | NFL | 14 | 7 | 79 | 58 | 917 | 15.81 | 7 | 65.5 | 73.4% | 11.61 |
When it comes to projecting future NFL success, Smith-Schuster had about as good a rookie year as it gets: not only was he incredibly young, but he was also remarkably efficient and very productive.
Ndamukong Suh is once again a free agent, and the Los Angeles Rams are one of the teams that he is considering joining. The Rams, of course, already have Aaron Donald, a three-time All-Pro according to the Associated Press. He’s one of just two active defensive tackles who are three-time 1APs by the AP, and Suh is the other.
Disclaimer: The Associated Press is just one of several organizations throughout history that have named All-Pro teams. The AP is not better than other organizations at identifying the best players and there’s no reason to focus on AP selections rather than all All-Pro organizations. Well, maybe one reason: laziness. And I’m feeling lazy today, so I am only going to focus on the AP All-Pro selections.
Here are all the players to be named an All-Pro DT by the AP three or more times: all the players between Sapp and Buchanan are in the Hall of Fame, and there’s a good chance that the four since Sapp will one day be in the Hall of Fame, too.
Aaron Donald (3)
Ndamukong Suh (3)
Kevin Williams (5)
Richard Seymour (3)
Warren Sapp (4)
John Randle (6)
Cortez Kennedy (3)
Randy White (7)
Joe Greene (5)
Alan Page (6)
Bob Lilly (7)
Merlin Olsen (5)
Buck Buchanan (4)
Alex Karras (3)
Ernie Ladd (3)
Tom Sestak (3)
Henry Jordan (5)
Bud McFadin (3)
Leo Nomellini (5)
Art Donovan (4)
Arnie Weinmeister (4)
Here are the AP All-Pros at DT each year since the beginning of the honor in 1950: [continue reading…]
In 2017, the San Francisco 49ers spent $47,419,179 in salary cap dollars on the team’s offense. That was the fewest in the NFL, and only the Browns and Jets were under $60M. In 2018? San Francisco has $111,833,332 in salary cap dollars allocated to offensive players, the most in the NFL.
How did that happen? Well, it’s pretty simple.
- The 49ers have $38.8M allocated to quarterbacks, by far the most in the NFL. The Lions are second at $27.6M, meaning this is a truly untenable number. This is mostly due to Jimmy Garoppolo, of course, and his contract is structured unevenly for cap purposes. At it stands, the ex-Patriot will have a $37M cap hit in ’18, a $20M cap hit in ’19, and between $26.6 and $27M in ’20, ’21, and ’22. The 49ers pushed an absurd amount of salary cap dollars into 2018 thanks to a $28M roster bonus.
- The 49ers have $13.0M allocated to running backs, which trails only the Le’Veon Bell-led Steelers and Bills (not only LeSean McCoy, but also backup Chris Ivory and FB Patrick DiMarco have large contracts for their roles). Fullback Kyle Juszczyk ($4,45M cap hit in 2018) is by far the highest paid player at his position, after signing an off-market contract last year. But the team matched the insanity in 2018, signing Jerick McKinnon to a huge contract that carries a $10.5M cap hit in 2018, the second highest (Bell) in the league. That came a year after the 49ers traded the 143rd and 161st picks in the draft to move up to select Joe Williams, a RB that Kyle Shanahan claimed he would “be sick” if the 49ers didn’t grab.
- At wide receiver, San Francisco has $23.3M in salary cap dollars, which is slightly above-average, too. This is mostly allocated to Pierre Garcon ($9.25M), Marquise Goodwin ($6.28M on a new contract this month), and Aldrick Robinson ($2.2M).
The 49ers went a little cheap at TE (Garrett Celek at $2.7M) and are about average on the offensive line. Joe Staley has a cap hit back down to $7.7M, and the 49ers will have a reasonably priced RT in either Trenton Brown or Garry Gilliam. At guard, Jonathan Cooper, Zane Beadles, and Josh Garnett will compete for two spots, with the big money player being new C Weston Richburg. The 49ers lured Richburg from the Giants with one of the richest contracts in the league for any center.
The contracts paid to the running backs were obvious overpays, and Garoppolo’s contract pays him as though he’ll continue to be the player he was for five starts last year. Thirteen months ago, wouldn’t think adding Garoppolo, McKinnon, and a fullback would transform the 49ers from the cheapest to the most expensive offense in the league, but here we are.
If you squint, you can see it. New York lost Odell Beckham and Brandon Marshall for the season before the team even won its first game. Both players will be back, along with 24-year-old Sterling Shepard and not-yet-24-year-old Evan Engram. The Giants also signed Cody Latimer and added a quality left tackle in veteran Nate Solder. New York made the playoffs two years ago, and while Eli Manning had one of the worst seasons of his career in 2017, you can see a high-level functioning offense with new head coach Pat Shurmur, new OC Mike Shula, Manning, Beckham/Marshall/Shephard/Engram, and rookie RB Saquon Barkley.
But I’d be floored if the Giants took a RB with the second overall pick. In my opinion, New York is going to trade the second pick for a king’s ransom or draft a quarterback. And it’s because the Giants have an aging, below-average quarterback as their QB1, and that’s true even though his name is Manning.
Even if you ignored 2017 due to all of the injuries the Giants offense experienced, it’s not like there would be a lot of reason for optimism about how well Manning would play into his late 30s. Why’s that?
1) At age 35 in 2016, Manning was below-average, ranking 22nd out of 31 qualifying passers in ANY/A.
2) Manning was born on January 3rd, making him “old for his age” if you know what I mean. Had Manning been born four days earlier, he would have been considered 36 in 2016, 37 in 2017, and 38 this season.
3) Even if you give Manning the benefit of the doubt and ignore his 2017 performance and the fact that he’s old for his age, we wouldn’t expect a below-average QB at age 35 to be average at age 37, much less average at age 38 or 39. You would expect a QB to lose about 0.5 ANY/A from age 35 to age 37, and it’s not like Manning started from a very high porch.
Since Manning didn’t have much left to lose, the effects of age will likely hit him hard. The graph below shows Manning’s RANY/A — i.e., his Relative ANY/A, which is just ANY/A minus league average ANY/A — for each year of his career. He had sustained regular season success for a five-year period from 2008 to 2012, and another mini-peak in 2014 and 2015, but the graph doesn’t pain the picture of a quarterback who will be a difference maker in 2018 or 2019 as his physical skills decline. [continue reading…]
Are you sick of reading my words? Well today you can listen to them (or not; not only is this site free, but participation is voluntary).
I joined Joe Caporoso on the Jets podcast Turn On the Jets to discuss the team’s blockbuster trade up from the #6 to #3 pick. You can listen on iTunes here or on Google Play or Spotify . In addition, Matt Miller of Bleacher Report also appeared discussing the trade, spinning the rosier version.
I was also a guest on Mike Schopp and the Bulldog (WGR 550 in Buffalo) discussing whether the Bills should pull off a similar move. You can listen here or on iTunes here.
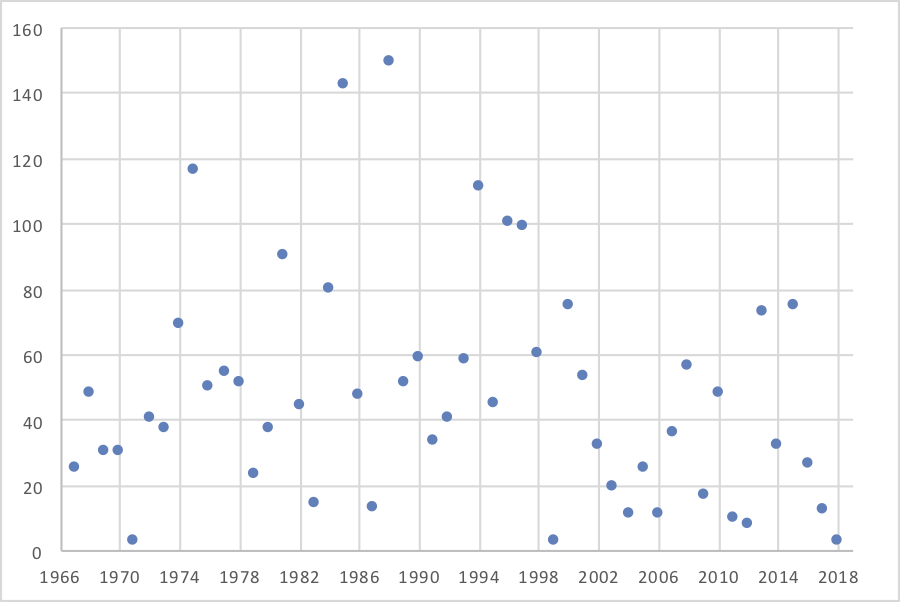
Last year, in 2017, Deshaun Watson was the third quarterback off the board with the 12th overall selection, and he was the leading favorite for rookie of the year before tearing his ACL in practice. In 2018, it is expected that the first three picks in the NFL Draft will be quarterbacks, just like it was in 1971 and 1999. That’s the best-case scenario for the third QB, but every draft is different: in 2015, Jameis Winston and Marcus Mariota were the first two picks, and then the third QB selected was Garrett Grayson with the 75th pick. Twice, the third QB in the draft wasn’t taken until the 6th round! In 1988, it was Syracuse’s Don McPherson going at pick 149 in a draft that didn’t see a quarterback go in the first two rounds. In 1985, Steve Bono was taken with the 142nd pick as the third passer off the board.
The graph below shows the draft position where the third QB was selected in each draft from 1967 to 2018, with the assumption being that QB3 will go with the third pick this year:
When picking a quarterback in the first round, what sort of career should you expect? What’s the median expectation? How many are above the line where you would consider him a good pick (which may be a different question)?
I looked at 25 years of drafting, from 1990 to 2014 (it’s too early to grade quarterbacks drafted since then, and maybe even too early to grade two of the three from the first round of 2014). There were 60 quarterbacks selected in the first rounds of those drafts. I took a stab at ordering them from best to worst, but don’t worry too much about some of the rankings. You can feel free to re-order them in your own way. [1]For example, I had Bryan Frye look at these, and he had Alex Smith, Trent Dilfer, Teddy Bridgewater, and JaMarcus Russell all 5+ spots lower, and Jeff George, Tommy Maddox, Vince Young, and Drew … Continue reading
But take a look at this list and decide where your cut-off is for drafting a first round quarterback. Where is the cutoff if you have a top-5 pick where you feel like it was a worthwhile investment? For me, it’s probably around somewhere between QB15 and QB20. Those odds aren’t too great: it means only about 30% of first round quarterbacks are really players you would be happy to build your team around. But your mileage may vary: [continue reading…]
References
| ↑1 | For example, I had Bryan Frye look at these, and he had Alex Smith, Trent Dilfer, Teddy Bridgewater, and JaMarcus Russell all 5+ spots lower, and Jeff George, Tommy Maddox, Vince Young, and Drew Bledsoe all 5+ spots higher. |
|---|
Only twice in NFL history have the first three selections all been quarterbacks.
In 1971, the Patriots drafted Jim Plunkett with the first pick, followed by the Saints selecting Archie Manning, and the Oilers drafting Dan Pastorini third overall. The returns were not great: New England, New Orleans, and Houston went a combined 111-183-3 with those three under center, with a 3-2 record (all from Pastorini).
Then in 1999, the Browns took Tim Couch first overall, followed by Donovan McNabb to the Eagles and Akili Smith to the Bengals. The results were better, but only because of McNabb: the trio went 117-100-1 with those teams.
This year, the Cleveland Browns, New York Giants, and New York Jets now own the top three picks, with the Browns also owning the fourth overall pick. There has been speculation that the Browns would consider taking Penn State running back Saquon Barkley with the first pick, but that seems unlikely now that the Jets have decided to pay insurance to guarantee a top-3 quarterback.
This means two things: one, if the Browns don’t take Barkley, he could only go at 2, since the Jets won’t draft him. And the Browns could wind up getting QB3 or at best QB2 if they take Barkley first overall, since we know the Jets are taking a passer. Unless Cleveland views the top three quarterbacks as interchangeable and Barkley as future Hall of Famer, the Browns are going to draft a quarterback with the first pick.
And that leaves the Giants in an interesting spot at #2 overall. New York probably should move on from Eli Manning, who will be 38 years old before the 2018 playoffs begin. Manning was born on January 3rd, making him a very old 36-year-old quarterback in 2017. And he was a very unproductive 36-year-old quarterback in 2017, which makes it hard to see why the Giants wouldn’t reboot the franchise, so to speak.
But even if the Giants don’t agree, we just saw the Jets send a mammoth amount of draft capital to the Colts for the #3 pick. Gang Green sent 54.6 points of draft value — equivalent to the first overall pick and the 10th overall pick — for the third pick in the draft. The bidding for the 2nd overall pick begins there, and it defies any sense of logic to think a RB or a guard (Notre Dame’s Quenton Nelson will be one of the first non-QBs selected) is worth 55 points of draft value.
So New York will either take a quarterback at #2, or trade the pick for a ton of value. Surely the Jets offered the Giants the same package they sent to Indianapolis, which means the Giants already decided the #2 pick was worth more than 54.6 points of draft value. That signals a desire to take a quarterback or to wait for a better offer as we get closer to draft day.
Where will that offer come? The Broncos, Dolphins, and Bills are the likely suitors (the Jets could also try to get into the #1 or #2 slot, too). Denver could offer the #5 pick, the #40 pick, and a 2019 first rounder to get the second overall pick. In that scenario, the Giants would actually still get Nelson (with the draft going QB-QB-QB-Barkley-Nelson) and get the 40th pick and a 2019 first rounder. Of course, this only works if the Giants are all in on Manning.
The Dolphins probably don’t have the juice to make the move, but don’t ignore the possibility of Miami sending the 11th pick, the 42nd pick, and the team’s first round picks in both 2019 and 2010. GM Chris Grier and Executive Vice President of Football Operations (whatever that means) Mike Tannenbaum are both on the hot seat, and head coach Adam Gase is 16-16 after two seasons and without any sense of hope for the short-term future. Miami’s had just five players record 7+ points of AV last year; two are gone (Jarvis Landry and Ndamukong Suh), and a third is 36-year-old Cameron Wake.
The rebuild is in on Miami (Reshad Jones and Kiko Alonso are your other leaders in AV, by the way), and it’s unlikely that Tannenbaum and Grier are still around in 2020. As a result, you can see a situation where the duo decides there’s no reason not to offer up three first round picks, as drafting the next Marino might be the only way to keep their jobs. The question: would the Giants take 11, 42, and two future firsts for the 2nd overall pick? That would be very similar to what Washington gave up in the RG3 trade, although a slightly lesser haul. I assume the Giants would take it, because it’s not like history fondly recalls Washington’s gambit there. New York could certainly “settle” for something less than RG3, and with a new GM in Dave Gettleman, having two first round picks in 2019 and 2020 would be a heck of a way to start the rebuild. [continue reading…]
The Jets and Colts pulled off a blockbuster trade yesterday. Indianapolis sent the Jets the third overall selection, which gives them the right to draft one of Sam Darnold, Josh Rosen, Josh Allen, or Baker Mayfield. It’s possible (likely?) that one of those guys would have still been there at #6, but the Jets didn’t want to take that risk, or (it appears) risk putting the future of the quarterback position in the hands of Lamar Jackson, Mason Rudolph or Luke Falk (or Teddy Bridgewater).
The price to play it safe and insure that the Jets would get one of their top three options at quarterback was not cheap. In return for the third pick (worth 27.6 points in the Football Perspective Draft Pick Value calculator), New York gave up the sixth pick (worth 23.2 points), the 37th pick (11.6 points), the 49th pick (9.8 points), and a 2019 second round pick. If we assume the 2019 second round pick to be say, the 40th pick overall, that’s another 11.1 points. Discount it 10% for having to wait a year to lose it, and we can approximate it as worth 10 points.
That’s 27.6 points points received in return for trading 54.6 points, which is a whopping 198 cents on the dollar. It’s hard to overstate how much value that is: the Jets sent the equivalent of the first overall pick (34.6 points) and the 10th overall pick (19.9 points), and are now firmly in the land of massive overpays to trade up for a top-5 QB.
The Jets are now rebuilding without a 2nd round pick this year or a 2nd round pick next year and starting with a roster that is light on talent overall. The only way this trade works out is if the draft pick turns out to be a star quarterback, but the odds of that happening are about 20%. My suspicion is the odds of that are even lower when you have a below-average support system around that quarterback.
This is a curious trade given that the Jets will likely be left taking the third QB off the board. The Jets could have stayed put and taken the best QB on the board at 6 (which would involve some risk, of course) and have three second round picks to surround that player. Or trade down and take a QB like Jackson or Rudolph and surround him with three second round picks plus whatever else the Jets could have acquired via a trade down. It might be looking at a situation of the leftovers of Darnold/Rosen/Allen/Mayfield vs. Jackson + 4 2nd round picks or Rudolph plus 3 second round picks and 1 first round pick.
But there’s nothing easier in the world than overpaying to trade up for a QB that’s the safe choice. The Jets paid 198 cents on the dollar to avoid having to take the risk in not getting one of the consensus top 4 quarterbacks. That is a very hefty insurance policy for a team that is light on talent to begin with.
This is the busiest week of the year for roster turnover. I’m short on time today, but wanted to alert all of you that Footballguys.com has a free agency tracker for all your needs.
http://subscribers.footballguys.com/apps/freeagenttracker.php?sortby1=rel&filter=
Please use the look and let us know what you think have been the most interesting moves of the week!
Joe Thomas entered the NFL in 2007, and retired this week after 11 years with the Browns. During his time with Cleveland, the Browns had a 0.273 winning percentage, the worst record in the NFL. I wrote about how Thomas had one of the worst AV-adjusted winning percentages of all time, and that was before Cleveland went winless in 2017.
Thomas is an obvious future Hall of Famer. He was a 6-time first-team All-Pro choice by the Associated Press, and a 10-time Pro Bowler. He is one of just five players, along with Merlin Olsen, Mel Renfro, Barry Sanders, and Lawrence Taylor, to make the Pro Bowl in each of his first ten seasons.
But there’s another way that Thomas is a remarkable player. He might just be more Ogden than Jonathan Ogden, and that’s saying something. Here is what Doug wrote back when the Approximate Value system was in its infancy: [continue reading…]
Yesterday, I wrote about Mike Evans and how 68 of his 71 receptions were “successful” receptions. Today, I’m going to present that data for all top wide receivers, tight ends, and running backs.
A “successful” reception is one that picked up a first down on 3rd or 4th down, gained 60% of the necessary yards on 2nd down, or 40% of the necessary yards on 3rd down.
| Player | Pos | Tar | Rec | Yards | FD | TD | FD% | Yd/Rec | SR |
|---|---|---|---|---|---|---|---|---|---|
| Mike Evans | WR | 136 | 71 | 1004 | 55 | 5 | 77% | 14.1 | 96% |
| Marquise Goodwin | WR | 104 | 56 | 962 | 46 | 2 | 82% | 17.2 | 95% |
| Marvin Jones | WR | 108 | 61 | 1101 | 44 | 9 | 72% | 18.0 | 93% |
| Hunter Henry | TE | 62 | 45 | 579 | 32 | 4 | 71% | 12.9 | 93% |
| DeAndre Hopkins | WR | 169 | 96 | 1378 | 70 | 13 | 73% | 14.4 | 93% |
| Julio Jones | WR | 148 | 88 | 1445 | 67 | 3 | 76% | 16.4 | 92% |
| Kelvin Benjamin | WR | 78 | 48 | 692 | 30 | 3 | 63% | 14.4 | 92% |
| Kenny Stills | WR | 103 | 58 | 847 | 38 | 6 | 66% | 14.6 | 91% |
| Rob Gronkowski | TE | 104 | 69 | 1083 | 57 | 8 | 83% | 15.7 | 91% |
| Alshon Jeffery | WR | 121 | 57 | 789 | 44 | 9 | 77% | 13.8 | 91% |
| Keelan Cole | WR | 75 | 40 | 735 | 31 | 3 | 78% | 18.4 | 90% |
| Rishard Matthews | WR | 87 | 53 | 795 | 36 | 4 | 68% | 15.0 | 89% |
| Mike Wallace | WR | 92 | 52 | 748 | 33 | 4 | 63% | 14.4 | 88% |
| Seth Roberts | WR | 65 | 43 | 455 | 22 | 1 | 51% | 10.6 | 88% |
| Antonio Brown | WR | 163 | 101 | 1533 | 72 | 9 | 71% | 15.2 | 88% |
| Albert Wilson | WR | 63 | 42 | 554 | 32 | 3 | 76% | 13.2 | 88% |
| DeSean Jackson | WR | 91 | 50 | 668 | 36 | 3 | 72% | 13.4 | 88% |
| Stefon Diggs | WR | 94 | 64 | 849 | 43 | 8 | 67% | 13.3 | 88% |
| Cooper Kupp | WR | 94 | 62 | 869 | 43 | 5 | 69% | 14.0 | 87% |
| Jared Cook | TE | 85 | 54 | 687 | 35 | 2 | 65% | 12.7 | 87% |
| Ted Ginn | WR | 70 | 53 | 787 | 32 | 4 | 60% | 14.8 | 87% |
| Davante Adams | WR | 118 | 74 | 885 | 46 | 10 | 62% | 12.0 | 86% |
| Keenan Allen | WR | 159 | 102 | 1395 | 74 | 6 | 73% | 13.7 | 86% |
| Brandin Cooks | WR | 113 | 65 | 1082 | 43 | 7 | 66% | 16.6 | 86% |
| Devin Funchess | WR | 109 | 63 | 840 | 41 | 8 | 65% | 13.3 | 86% |
| Michael Thomas | WR | 149 | 104 | 1245 | 70 | 5 | 67% | 12.0 | 86% |
| Cameron Brate | TE | 77 | 48 | 591 | 34 | 6 | 71% | 12.3 | 85% |
| Paul Richardson | WR | 75 | 41 | 638 | 30 | 6 | 73% | 15.6 | 85% |
| A.J. Green | WR | 141 | 75 | 1078 | 56 | 8 | 75% | 14.4 | 85% |
| T.Y. Hilton | WR | 102 | 54 | 936 | 35 | 4 | 65% | 17.3 | 85% |
| Zach Ertz | TE | 110 | 74 | 824 | 47 | 8 | 64% | 11.1 | 85% |
| Mohamed Sanu | WR | 95 | 67 | 703 | 41 | 5 | 61% | 10.5 | 85% |
| Jordy Nelson | WR | 89 | 53 | 482 | 38 | 6 | 72% | 9.1 | 85% |
| Jermaine Kearse | WR | 102 | 65 | 810 | 37 | 5 | 57% | 12.5 | 85% |
| Michael Crabtree | WR | 102 | 58 | 618 | 35 | 8 | 60% | 10.7 | 84% |
| Kyle Rudolph | TE | 82 | 57 | 532 | 32 | 8 | 56% | 9.3 | 84% |
| Robby Anderson | WR | 113 | 63 | 941 | 36 | 7 | 57% | 14.9 | 84% |
| Danny Amendola | WR | 85 | 61 | 662 | 40 | 2 | 66% | 10.9 | 84% |
| Eric Decker | WR | 83 | 54 | 563 | 31 | 1 | 57% | 10.4 | 83% |
| Jimmy Graham | TE | 89 | 53 | 459 | 29 | 10 | 55% | 8.7 | 83% |
| Emmanuel Sanders | WR | 94 | 47 | 555 | 30 | 2 | 64% | 11.8 | 83% |
| Tyreek Hill | WR | 105 | 75 | 1183 | 41 | 7 | 55% | 15.8 | 83% |
| Pierre Garcon | WR | 66 | 40 | 499 | 25 | 0 | 63% | 12.5 | 83% |
| DeVante Parker | WR | 96 | 57 | 671 | 33 | 1 | 58% | 11.8 | 82% |
| Delanie Walker | TE | 110 | 74 | 808 | 44 | 3 | 59% | 10.9 | 82% |
| Adam Thielen | WR | 143 | 91 | 1278 | 60 | 4 | 66% | 14.0 | 82% |
| Marqise Lee | WR | 95 | 56 | 702 | 40 | 3 | 71% | 12.5 | 82% |
| Travis Kelce | TE | 122 | 83 | 1038 | 55 | 8 | 66% | 12.5 | 82% |
| Sterling Shepard | WR | 84 | 59 | 731 | 36 | 2 | 61% | 12.4 | 81% |
| JuJu Smith-Schuster | WR | 79 | 58 | 917 | 39 | 7 | 67% | 15.8 | 81% |
| Demaryius Thomas | WR | 138 | 83 | 950 | 54 | 5 | 65% | 11.4 | 81% |
| Doug Baldwin | WR | 112 | 72 | 956 | 43 | 8 | 60% | 13.3 | 81% |
| Robert Woods | WR | 85 | 56 | 781 | 37 | 5 | 66% | 13.9 | 80% |
| Martavis Bryant | WR | 83 | 50 | 603 | 30 | 3 | 60% | 12.1 | 80% |
| Evan Engram | TE | 114 | 64 | 722 | 37 | 6 | 58% | 11.3 | 80% |
| Charles Clay | TE | 73 | 49 | 558 | 29 | 2 | 59% | 11.4 | 80% |
| Terrance Williams | WR | 78 | 53 | 569 | 31 | 0 | 58% | 10.7 | 79% |
| Amari Cooper | WR | 94 | 48 | 680 | 30 | 7 | 63% | 14.2 | 79% |
| Vernon Davis | TE | 68 | 43 | 649 | 23 | 3 | 53% | 15.1 | 79% |
| Adam Humphries | WR | 83 | 61 | 631 | 35 | 1 | 57% | 10.3 | 79% |
| Dez Bryant | WR | 133 | 69 | 839 | 44 | 6 | 64% | 12.2 | 78% |
| Julius Thomas | TE | 61 | 41 | 388 | 18 | 3 | 44% | 9.5 | 78% |
| Larry Fitzgerald | WR | 161 | 109 | 1156 | 66 | 6 | 61% | 10.6 | 78% |
| Ryan Grant | WR | 65 | 45 | 573 | 29 | 4 | 64% | 12.7 | 78% |
| Jason Witten | TE | 88 | 63 | 560 | 26 | 5 | 41% | 8.9 | 78% |
| Jack Doyle | TE | 102 | 75 | 663 | 35 | 4 | 47% | 8.8 | 77% |
| Tyrell Williams | WR | 70 | 43 | 728 | 30 | 4 | 70% | 16.9 | 77% |
| Jesse James | TE | 64 | 43 | 372 | 20 | 3 | 47% | 8.7 | 77% |
| Kendall Wright | WR | 91 | 59 | 614 | 33 | 1 | 56% | 10.4 | 75% |
| Nelson Agholor | WR | 94 | 62 | 768 | 36 | 8 | 58% | 12.4 | 74% |
| Jarvis Landry | WR | 157 | 112 | 987 | 61 | 9 | 54% | 8.8 | 74% |
| Trent Taylor | WR | 61 | 43 | 431 | 27 | 2 | 63% | 10.0 | 72% |
| Eric Ebron | TE | 87 | 53 | 574 | 32 | 4 | 60% | 10.8 | 72% |
| Tyler Kroft | TE | 61 | 42 | 404 | 23 | 7 | 55% | 9.6 | 71% |
| Christian McCaffrey | RB | 114 | 80 | 651 | 36 | 5 | 45% | 8.1 | 71% |
| Jamison Crowder | WR | 104 | 66 | 800 | 37 | 3 | 56% | 12.1 | 71% |
| Brandon LaFell | WR | 84 | 52 | 548 | 25 | 3 | 48% | 10.5 | 71% |
| Tyler Lockett | WR | 64 | 41 | 488 | 22 | 2 | 54% | 11.9 | 71% |
| Golden Tate | WR | 120 | 92 | 1003 | 45 | 5 | 49% | 10.9 | 71% |
| Todd Gurley | RB | 88 | 64 | 788 | 31 | 6 | 48% | 12.3 | 70% |
| Jeremy Maclin | WR | 71 | 40 | 440 | 23 | 3 | 58% | 11.0 | 70% |
| George Kittle | TE | 63 | 43 | 515 | 23 | 2 | 53% | 12.0 | 70% |
| LeVeon Bell | RB | 105 | 85 | 655 | 31 | 2 | 36% | 7.7 | 69% |
| Alvin Kamara | RB | 101 | 81 | 827 | 38 | 5 | 47% | 10.2 | 69% |
| Randall Cobb | WR | 92 | 66 | 653 | 29 | 4 | 44% | 9.9 | 67% |
| Austin Hooper | TE | 65 | 49 | 526 | 19 | 3 | 39% | 10.7 | 65% |
| Austin Seferian-Jenkins | TE | 74 | 50 | 357 | 18 | 3 | 36% | 7.1 | 64% |
| James White | RB | 73 | 56 | 429 | 25 | 3 | 45% | 7.7 | 63% |
| Duke Johnson | RB | 92 | 74 | 693 | 34 | 3 | 46% | 9.4 | 62% |
| Kareem Hunt | RB | 65 | 53 | 455 | 18 | 3 | 34% | 8.6 | 60% |
| Jerick McKinnon | RB | 68 | 51 | 420 | 20 | 2 | 39% | 8.2 | 59% |
| Carlos Hyde | RB | 89 | 60 | 360 | 18 | 0 | 30% | 6.0 | 58% |
| Melvin Gordon | RB | 83 | 58 | 476 | 22 | 4 | 38% | 8.2 | 57% |
| Theo Riddick | RB | 71 | 53 | 444 | 20 | 2 | 38% | 8.4 | 57% |
| LeSean McCoy | RB | 77 | 59 | 448 | 23 | 2 | 39% | 7.6 | 56% |
| Mark Ingram | RB | 71 | 58 | 416 | 19 | 0 | 33% | 7.2 | 55% |
| Shane Vereen | RB | 53 | 44 | 254 | 8 | 0 | 18% | 5.8 | 52% |
| Javorius Allen | RB | 60 | 46 | 250 | 16 | 2 | 35% | 5.4 | 50% |
| Giovani Bernard | RB | 61 | 43 | 380 | 16 | 2 | 37% | 8.8 | 49% |
| Tarik Cohen | RB | 71 | 53 | 354 | 10 | 1 | 19% | 6.7 | 40% |
As for Bears rookie Tarik Cohen, he had just 40% of his 53 receptions be successful! That was remarkable, but you can view all of his receptions here and see the results for yourself, including seven catches for zero or negative yards.
What stands out to you?
Tampa Bay’s Mike Evans is one of the best wide receivers in the NFL. You probably already knew that, but I think his traditional stats tend to underrate the value Evans brings to the Bucs. He ranked just 15th in receiving yards and only 23rd in receptions, but he’s more valuable than those numbers indicate.
The biggest reason? Evans is a first down machine, with 77% of his catches last year turning into first downs. There were 43 players last season who had at least 60 receptions, and the only player with a highest first down rate was TE Rob Gronkowski. But even when Evans isn’t getting a first down, he’s still doing something productive.
If we break down his 71 catches:
- All 15 of his catches on 3rd/4th down went for a first down;
- 26 of his 37 catches on 1st down went for a first down; of the other 11, six went for 8 or more yards, three went for 6 yards, and the other two went for 4 and 5 yards. This means all 37 of his 1st down catches picked up either a first down or at least 40% of the yards needed to go for a first down, which means these were all successful catches.
- On 2nd down, 14 of Evans’ 19 receptions went for first downs; of the other 5, one was a 13-yard gain on 2nd-and-15 and one was a 6-yard gain on 2nd-and-10. That leaves just three catches where Evans failed to pick up at least 60% of the necessary yards to get a first down: a 6-yard catch on a 2nd-and-15, a 4-yard catch on a 2nd-and-7 (arguably a successful play in its own right), and a 3-yard catch on a 2nd-and-10. And that was it.
To recap, all of Evans’ catches on 3rd/4th down went for a first down, and nearly all of his catches on 1st and 2nd down went for first downs, too. Of that remaining group, all of his first down catches gained at least 40% of the distance needed for a first, and all but three of his second down catches gained at least 60% of the ‘to go’ yardage. Just 4% of his catches last year were “unsuccessful”, the lowest rate of any player in the NFL last season.
Over the last week, the Browns have made four trades, putting a small dent in the team’s historic draft capital. Cleveland traded away the first pick in the third round, #65 overall, to Buffalo for QB Tyrod Taylor, and sent the 123rd pick (Carolina’s 4th round pick, acquired two years ago for punter Andy Lee) and a 2019 7th rounder to Miami for WR Jarvis Landry. Cleveland also sent rookie QB DeShone Kizer — fresh off the third 15-loss season in NFL history — to the Packers for CB Damarious Randall, while swapping 4th and 5th round picks (Cleveland sent the first picks in the 4th and 5th rounds, #101 and #138, in exchange for #114 and #150). And finally, the Browns sent DT Danny Shelton and the 159th pick (Kansas City’s 5th round pick, acquired when Cleveland sent the Chiefs OL Cameron Erving) to the Patriots for a 2019 3rd round choice.
Cleveland still holds the first pick in rounds 1, 2, 6, and 7 of the 2018 Draft, along with the Texans first round pick (#4 overall, courtesy of the Deshaun Watson trade), Texans second round pick (#35 overall, from the Brock Osweiler trade), the Eagles second round pick (#64, Carson Wentz), and lower picks in the fourth and fifth round after the Green Bay trade. [continue reading…]
From 1994 to 2013, there were 37 quarterbacks drafted in the first round of the NFL draft who were *not* selected with the first overall pick. Why am I looking at those quarterbacks? Well, passers selected with the first overall pick are a special case, distinct from all other quarterbacks. The odds of success are much higher there than elsewhere, as you will soon find out.
And why those years? Well, it’s too early to grade the recent draft classes, and that arguably includes the 2014 class. But if we were to include the 2014 class, I suspect we would have three picks that go down as bad ones: Blake Bortles at #3, Johnny Manziel at #22, and Teddy Bridgewater at #32. We know that Manziel was a terrible pick, and the balance of the evidence suggests that Bortles (21-40 career record) and Bridgewater (28 starts in four years) have failed to live up to expectations. But to avoid debating those guys, I decided to look at the 20-year period ending just before the class of 2014.
How did those 37 quarterbacks fare? A whopping 16 of them won fewer than 20 games in the NFL:
Jim Druckenmiller
Akili Smith
Cade McNown
Ryan Leaf
Brady Quinn
Brandon Weeden
EJ Manuel
Heath Shuler
Matt Leinart
Tim Tebow
Jake Locker
J.P. Losman
Patrick Ramsey
Blaine Gabbert
Christian Ponder
Robert Griffin
Another three — Joey Harrington, 26-50 (-24), Jason Campbell, 32-47 (-15), and Josh Freeman, 25-36 (-11) — lost at least ten more games than they won and never made a Pro Bowl. Another three — Vince Young, Kyle Boller, and Rex Grossman — had more interceptions than touchdowns and started for four or fewer seasons. Those three were busts, too, giving us 22 out of 37 picks that go down as clearly disappointing (59%).
There are seven quarterbacks (19%) who were clear hits, winning 20 more games than they lost:
Ben Roethlisberger, 135-63 (72)
Aaron Rodgers, 94-48 (46)
Donovan McNabb, 98-62 (36)
Matt Ryan, 95-63 (32)
Joe Flacco, 92-62 (30)
Steve McNair, 91-62 (29)
Philip Rivers, 106-86 (20)
That leaves eight quarterbacks. Byron Leftwich, Mark Sanchez, and Trent Dilfer could charitably be described as better than your average first round (non-first overall) quarterback, although Leftwich was a starter for just 3 seasons and Sanchez and Dilfer own two of the worst era-adjusted passer ratings of all time. If you include those three as disappointments, that brings the miss rate to just over two-thirds of all passers (25 out of 37).
So with 25 disappointments and 7 hits, that leaves a middle ground of 5 passers. Chad Pennington is your #8 quarterback: he’s the best of the rest, although he finished with a 44-37 record that keeps him far short of the +20 win club. After that, it’s dealer’s choice how you want to rank Ryan Tannehill, Daunte Culpepper, Kerry Collins, and Jay Cutler. But just know that two of those guys are in the top 10 of the 37 non-first overall first round quarterbacks from this 20-year sample. The median expectation might be a guy like Campbell, while even the 67th percentile result could land you a Tannehill.
In short: if the quarterback isn’t the first overall pick, the odds are still pretty poor of landing a star. The hit rate is about 20%.
Do you know who the leader in rushing yards in a single postseason?
| Click Show for Answer | Show |
|---|---|
What about the rushing leader among players who played in only three postseason games?
| Click Show for Answer | Show |
|---|---|
What about the rushing leader in the last 10 years in a postseason?
| Click Show for Answer | Show |
|---|---|
Over his four-year career, Jarvis Landry has a whopping 400 receptions, the most in NFL history for any player in his first four years. Now a member of the Browns after yesterday’s trade, what can we expect from him? Cleveland, of course, went 0-16 last year, which might actually be a good thing for Landry’s numbers. You see, over the course of his career, Landry has been much better in losses than wins.
Landry has averaged 69.4 receiving yards per game in losses, but that number drops by 13.4 yards per game in wins to just 56 yards per game. That’s a sizable discount, especially when most receivers average about five more yards per game in wins than losses.
The table below looks at all receivers over the last four seasons to average at least 50 receiving yards per game over more than 32 games, and with a sizable amount of games in both wins and losses (so no Patriots or Jaguars here). Take a look: [continue reading…]
Back in August, I asked you 38 questions that served as prop bets for the 2017 NFL season. Thanks to the tireless work of Jeremy De Shelter, who helped compile all the results. A couple of weeks ago, I looked at Part I. Let’s move on to Part II, beginning with the projected best and worst teams in the NFL…
Number of double digit wins by the Patriots
Number of double digit losses by the Browns
Cleveland lost 9 games by double digits in 2017, a year after losing 10 such games in 2016. It is still the 4th-most double digit losses by a Browns team since 1999. Meanwhile, New England won “only” 8 games by double digits last year, after winning 10 such games in 2016.
This was a lopsided bet in favor of the Patriots. 82% of you took the New England side, making this a big win for the minority.
Margin of victory for the Texans biggest win
Number of TD passes by the Texans TD passing leader
You might think that Deshaun Watson runs away with this if he stays healthy, as he led the team with 19 touchdown passes in 7 games. But he also led the team to a 43-point blowout of the Titans, so the margin of victory side easily won here. This was a close race, but 55% of you picked the Texans biggest win side.
Yards from scrimmage from the the leader of this group: Mike Gillislee, James White, Rex Burkhead, Dion Lewis
Yards from scrimmage from David Johnson in Arizona wins
Well, Johnson missed 15 games in 2017 due to injury, recording 91 yards from scrimmage in his lone win. The majority of you (57%) picked the Johnson side, but the Patriots side obviously won, as Lewis had 1,110 yards from scrimmage. If you knew that Lewis would lead with such a high number you might not have picked Johnson (who had less than 1,000 yards in Cardinals wins in 2016), so maybe this wasn’t just an easy win for the minority side.
Number of Receiving TDs by the player with the MOST in this group: Odell Beckham, A.J. Green, Jarvis Landry and Antonio Brown
Number of Receiving TDs combined by Pierre Garcon, Randall Cobb, and Adam Thielen
Another one of my favorite style of bets. A few months ago, you might have been shocked to learn that it was Landry (along with Brown) who led the first group in receiving touchdowns at 9 scores. On the other side, Garcon had a goose egg despite having 500 receiving yards, Cobb caught four touchdowns, and Thielen had a monster year with 1,216 yards but also had just four touchdowns. Make this question about receiving yards and it’s an easy win for the combined group, but when it comes to touchdowns, the Landry/Brown side pulled out the win.
That was an upset, as only 27% of you picked the first side.
Yards from scrimmage for Jordan Howard
Number of receiving yards by the Bears receiving yards leader, times two
Howard had 1,611 yards from scrimmage in 2016, and that dropped to 1,247 last year. The Bears had terrible receivers and finished last in the NFL in passing yards, though, which made this one of the closest races. Kendall Wright finished as Chicago’s leading receiver with 614 yards, so Group B loses this bet, 1247-1228. In the pre-season, 63% of you said that Group B would win, and I can’t blame you. But this was another upset win even with a down year from Howard.
Lowest Yards per reception by any of Tavon Austin, Danny Amendola and Larry Fitzgerald, times two
Highest Yards per reception from this group: DeSean Jackson, Kenny Stills, Martavis Bryant, Ted Ginn Jr., J.J. Nelson [No minimum]
Fitzgerald averaged 10.6 yards per reception, Amendola 10.8, and Austin 3.6! So the number to beat here was just 7.2 because of Austin. Nelson was at 17.5 all by himself, making this another win for the majority. A whopping 80% of you picked Group B, which would have been a loser if not for Austin’s 13-catch, 47-yard season. I’m not too sure how I feel about this one. The next one? That was a pretty interesting line that built in the idea of an injury that actually happened.
Number of wins by the Packers, -1.5
Number of interceptions thrown by Aaron Rodgers
From 2014-2016, Rodgers played in 48 games and averaged 7.3 interceptions per season while the Packers averaged 10.7 wins per year. So we had to subtract some wins from Green Bay to make this line interesting. Two thirds of you picked the Packers line in the preseason, thinking the 1.5-win hook wasn’t enough.
Rodgers was limited to 7 games and threw 6 interceptions. Green Bay went 7-9, which means Option A finished with 5.5 and Option B finished with 6. Score a nailbiter for the minority vote.
Lower number will be Tom Brady rank in passer rating, +1.5 [If Brady fails to throw 224 passes, this side loses]
Lower number will be Antonio Brown rank in receiving yards
Another fun line with two Hall of Famers. Brown led the NFL in receiving yards, while Brady ranked 3rd in passer rating. The lower number wins here, because Brady was the favorite. Even without the hook, Brown won this contest.
In the preseason, 63% picked the Brown side. Well done.
TDs scored (passing, rushing and receiving combined) by the player with the 4th most TDs among players in the NFC South, +4
TDs scored (passing, rushing and receiving combined) by the player with the 2nd most TDs among players from teams in California
This was as close as it got in the preseason, meaning this was a great line. The California side got 51% of the vote, with Philip Rivers or Derek Carr the likely runner up. As it turns out, Rivers had 28 TDs but he was the runner up because Jared Goff scored 29 (28 passing, 1 rushing); Carr finished with 22. In the NFC South, the question here was whether all four QBs would have big good enough years to win this with the 4 TD edge. Cam Newton had 28 TDs, Drew Brees had 25, and Matt Ryan and Jameis Winston each had 20. If Goff didn’t have a breakout season, the NFC South wins because of the +4 TD edge. Score one for California over the NFC South.
Games started by rookie quarterbacks, +0.5
Games started by QBs who will be 38 years old during this season (i.e., Brees, Palmer, McCown)
I loved this line in the pre-season. Brees had 16 starts, McCown 13, and Palmer 7, combining for 36 starts. But the rookies did well, at least when it came to starts: DeShone Kizer started 15 games, Mitch Trubisky started 12, and Deshaun Watson 6. That combines for 33 starts, which allowed C.J. Beathard (5) and Nathan Peterman (2) put the rookies over the edge. In the preseason, 76% of you picked the 38-year old quarterbacks, likely not counting on Kizer to start 15 games.
And the last one of the day…
Number of rushing TDs by the QB with the most rushing touchdowns
Number of 100-yard rushing games by Ezekiel Elliott, +0.5
Elliott had 5 games with 100 rushing yards, and the tiebreaker goes to Elliott. But alas, Cam rushed for 6 touchdowns, giving Option A the win. In the preseason, 59% of you picked the rushing TD side, knowing there was a chance that an Elliott suspension would tip the scales.
What stands out to you?
There were three teams last season that overwhelmingly relied on one running back, and all three made the playoffs: the Chiefs with Kareem Hunt, the Steelers with Le’Veon Bell, and the Rams with Todd Gurley. Given the success the Jaguars had after drafting Leonard Fournette on the heels of the Cowboys revival after drafting Ezekiel Elliott, you might think that — combined with the sentence above — relying on one running back is trendy again.
But that’s the difference between anecdotes and data. The Bears were the fourth most “rely on one RB” team, and Chicago went 5-11. The Browns went 0-16 and were very Isaiah Crowell-heavy. And the Colts were the same with Frank Gore and it brought them a 4-12 record.
On the other side, both the Eagles and Patriots had three running backs finish with between 60 and 180 carries, and those teams met in the Super Bowl. The Seahawks didn’t exactly have a rushing game that you would envy, but no Seattle running back had even 70 carries and the team had a winning record.
Last year, I discussed the idea of rushing concentration indices. Let’s use Hunt as an example. He rushed for 1,327 yards, and all Chiefs running backs rushed for 1,462 yards. So Hunt rushed for 91% of all rushing yards produced by Kansas City running backs. To get the Chiefs RB rushing concentration index, we have to square that number, perform the same calculus for all Chiefs running backs, and sum the totals. For Hunt, squaring his percentage gets you 82%, and the tiny amount for all other Kansas City rushers brings us up to 83%.
On the other hand, we have Philadelphia. LeGarrette Blount had 43% of all Eagles rushing yards (square of that is 18%), Jay Ajayi had 23% (5%), Corey Clement had 18% (3%), Wendell Smallwood had 10% (1%), and Darren Sproles and Kenjon Barner each had three percent (0%). That gave the Eagles a RB rushing concentration index of 28%. That was the second lowest rate in the league. [continue reading…]
Frank Gore is already #5 on the career rushing list, while Adrian Peterson is currently in 12th place (but two years younger). In recent months, I’ve compared Gore and Peterson, as their careers which have been both very similar and very different. Both had severe knee injuries and might be the two best running backs to ever recover from ACL surgery, and both players are going to wind up very high on the career rushing list. Gore is now the favorite — surprisingly — to finish with more career rushing yards. On the other hand, Gore is much more of a compiler and Peterson a shining star. Gore ranks 34th in career rushing yards per game, while Peterson ranks 4th in that category.
So who do you prefer? The guy who ranks 5th in career rushing yards or 4th in career rushing yards per game? Or, if you like, there’s LeSean McCoy. Gore and Peterson already have crossed the 12,000-yard mark, and McCoy is likely to do so as well; either way, they are the three active players with the most rushing yards, making them a natural source of comparison. And assuming McCoy gets there, they will also be the only three players from this era (not including Tomlinson or younger players) to hit the 12,000-yard mark.
McCoy’s highs weren’t as high as Peterson, but they were a little higher (two first-team All-Pro seasons, a third season as a top-three fantasy running back, six Pro Bowls in the last seven years) than Gore. And his career volume probably won’t match Gore, but it will probably be higher than Peterson. McCoy is currently 29th in career rushing yards and 22nd in career rushing yards per game.
Let’s compare the three players year-by-year, starting at age 21. [continue reading…]
In one of the first posts at Football Perspective, back before the start of the 2012 season, I asked the question: who will lead the NFL in rushing from 2012 to 2021? At the time, the last seven running backs to lead the league in rushing over a 10-year period were LaDainian Tomlinson, Edgerrin James, Curtis Martin, Emmitt Smith, Barry Sanders, Eric Dickerson, and Walter Payton. That’s a pretty good list of the top running backs over the last 30 years, reinforcing how impressive it is to lead the league in rushing for a decade.
How did our predictions go? Well, see for yourself:
LeSean McCoy, Beanie Wells and DeMarco Murray all are entering their age 24 season, making them perhaps the best hope among the young runners with NFL experience. On the other hand, along with Richardson, Doug Martin, David Wilson, Ronnie Hillman and Lamar Miller made the 2012 draft strong at the position. In the NFC West, Isaiah Pead and Kendall Hunter (or LaMichael James) could be the future for their teams for the next decade. As always, it’s too early to say.
In the collegiate ranks, South Carolina’s Marcus Lattimore is expected to be the cream of the 2013 class, with Auburn transfer Michael Dyer and Wisconsin’s Montee Ball also in the mix. And based on past history, we can’t count out sophomores Malcolm Brown or De’Anthony Thomas. If you had to pick which player will lead the league in rushing yards from 2012 to 2021, Trent Richardson is the obvious choice. After him, I’d probably be pretty evenly split among McCoy, Martin and Lattimore.
Let’s just say that with the obvious exception of McCoy, those predictions don’t hold up super well in hindsight. Which, by the way, is one of the main points of this post. It’s really hard to figure out which running backs will turn into stars and which will wind up having nondescript careers. Players like Hillman or Pead or Hunter had flashes where you could squint and see a long career of success, while Martin had two seasons with 1400+ yards and (to date) no other seasons with even 500+ rushing yards.
Here are the actual leaders in rushing yards from 2012-to-2017; in other words, this is with 60% of the period done. [continue reading…]
A month ago, I took a look at the quarterback situation in the NFL. Most teams already have either a franchise-type quarterback or a quarterback on a cheap rookie contract. There are another five teams — the Dolphins, Giants, Bengals, Jaguars, and Ravens — that don’t really stand out as natural Cousins fits, either because of the cap hit of their current quarterback or that Cousins wouldn’t provide much of an upgrade, if any.
That leaves six teams — the Bills, Broncos, Browns, Jets, Vikings, and Cardinals — that are really looking for quarterbacks. Cleveland and New York have both a ton of cap space and a premium draft pick, which cuts both ways: either team can offer Cousins whatever money they want, or decide to not even enter the Cousins sweepstakes. The Cardinals don’t have much in the way of cap space or premium draft picks, making them the team wanting to add a franchise quarterback but without many resources. The Bills and Broncos have solid draft capital (Buffalo has two first round picks, Denver owns the fifth pick) but not a ton of salary cap room.
That leaves Minnesota as perhaps the team best positioned to add a quarterback just via free agency. The Vikings don’t have much draft capital but have enough salary cap space to offer Cousins a premium contract. Oh, but there’s just one problem: Minnesota had three quality quarterbacks in the locker room last year (Case Keenum, Teddy Bridgewater, and Sam Bradford), each of whom the team could justify building around in 2019.
So, where will Cousins go? Here are my thoughts.
Cleveland
Despite the most cap room of any team in football, this feels like a longshot. The Browns are not a win-now team and own the first and fourth picks in the draft. This should set Cleveland up to draft a quarterback to build for the future, rather than find a strong veteran passer (or find a veteran passer who isn’t Cousins).
Perhaps more importantly, what would cause Cousins to pick the Browns? Unless the money is significantly more than what other teams are offering, or there is an ability for Cousins to leave Cleveland after only a year or two, it doesn’t make much sense for the quarterback with the most leverage since Peyton Manning to have his choice of suitors and pick an 0-16 team. And given Cousins’ concerns with ownership in Washington, I wouldn’t be surprised if ownership in Cleveland was enough to write the team off his short list.
Buffalo
The Bills don’t have much to offer in the way of, well, much. Whether it’s cap space, skill position talent on offense, or location, Buffalo is going to rank close to last on the list for Cousins. If this turns into a beauty pageant, it’s hard to see Cousins choosing western New York. And I would suspect that the way the organization has treated Tyrod Taylor — who has had a similar Total QBR over the last three years to Cousins — won’t help the team’s cause.
Arizona
The Cardinals don’t have much cap space, but offer an upgrade in skill position talent (David Johnson, Larry Fitzgerald) and weather relative to Buffalo. The Cardinals have a new coaching staff in place, with offensive coordinator Mike McCoy now working under new head coach Steve Wilks (formerly defensive coordinator in Carolina). Arizona has the 15th pick and not much cap space, which means the team might be a more natural fit for drafting a quarterback. We would presume that every team on this list (with the possible exception of the Bills) would offer more money to Cousins, but Arizona is a solid fit for Cousins if you, ya know, ignore money. [continue reading…]
From ages 21 to 25, Larry Fitzgerald was remarkable. In NFL history, only Randy Moss had more receiving yards over a player’s first five years in his 20s, and only Moss averaged more yards per game (minimum 50 games). Fitzgerald had three seasons with 1400+ yards before turning 26; Moss had two, and nobody else has had more than one.
But then, Fitzgerald’s career declined during his prime years, making him somewhat like the wide receiver version of Ken Anderson. In the post-Kurt Warner/pre-Carson Palmer era, Fitzgerald’s numbers tanked save for one outlier season in 2011 due to remarkable yards after the catch numbers. During the six seasons from ages 26 to 31 — the prime seasons for most wide receivers — Fitzgerald hit the 1,200 yard mark just once, during that 2011 season.
Thought of another way, of Fitzgerald’s six best seasons by receiving yards, five of them came outside of the 26-31 window. I looked at the 42 players with 10,000 receiving yards who have already played through their age 34 seasons. I then calculated their average production in each year from age 21 to 34 (whether they played in the NFL or not), to set a baseline average for each season. Then, I calculated their percentage of receiving yards at age X vs. their average level. That is in black below. I also included Fitzgerald’s production relative to his baseline in red and yellow.
As you can see, Fitzgerald was way more productive than even the average elite wide receiver in his early 20s. But at age 26 and 27 he was below-average, and then he was well below average at ages 29, 30, and 31. His production the last three years has been back in line with that of the average elite wide receiver, meaning he’s been right around his career average.

Here’s another way to think of it: Fitzgerald gained 6,176 receiving yards during his “prime years” from ages 26 to 31, and 7,180 in the three years before and after those prime years. From ‘2009 to 2014, Arizona ranked 26th in Net Yards per Attempt; meanwhile, from ’06 to ’08 the Cardinals ranked 6th in NY/A and then 12th over the last three years.
In some ways, this makes him similar to Charlie Joiner, who struggled during his prime years but etched out a Hall of Fame career. Fitzgerald is a better receiver than Joiner was, but if you start with a higher baseline, you can squint and see the career parallels.
The table below shows, for the 42 receivers identified above, their total receiving yards in their six prime seasons from age 26-31, their total receiving yards in the six surrounding seasons (SSS) from ages 23-25 and 32-34, and the difference. Only Joiner has a larger negative (i.e., better outside of his prime years) than Fitzgerald:
| Player | Prime | SSS | Diff |
|---|---|---|---|
| Charlie Joiner+ | 3535 | 4864 | -1329 |
| Larry Fitzgerald | 6176 | 7180 | -1004 |
| Anquan Boldin | 5842 | 6564 | -722 |
| Isaac Bruce | 6255 | 6849 | -594 |
| Irving Fryar | 4698 | 5249 | -551 |
| Andre Reed+ | 5440 | 5743 | -303 |
| Joey Galloway | 4100 | 4401 | -301 |
| Harold Jackson | 4639 | 4938 | -299 |
| Jerry Rice+ | 8201 | 8176 | 25 |
| Don Maynard+ | 5355 | 5018 | 337 |
| Tony Gonzalez | 5924 | 5550 | 374 |
| Steve Largent+ | 6306 | 5675 | 631 |
| Antonio Gates | 5329 | 4685 | 644 |
| Shannon Sharpe+ | 4927 | 4264 | 663 |
| Art Monk+ | 5841 | 5143 | 698 |
| Randy Moss+ | 6458 | 5674 | 784 |
| Hines Ward | 6178 | 5278 | 900 |
| Stanley Morgan | 5436 | 4473 | 963 |
| Jason Witten | 5816 | 4745 | 1071 |
| Andre Rison | 5258 | 4127 | 1131 |
| James Lofton+ | 6230 | 4915 | 1315 |
| Steve Smith | 6688 | 5355 | 1333 |
| Terrell Owens+ | 7219 | 5851 | 1368 |
| Cris Carter+ | 6504 | 5100 | 1404 |
| Henry Ellard | 6668 | 5227 | 1441 |
| Andre Johnson | 7301 | 5823 | 1478 |
| Lance Alworth+ | 5803 | 4237 | 1566 |
| Keyshawn Johnson | 6129 | 4442 | 1687 |
| Gary Clark | 6303 | 4553 | 1750 |
| Reggie Wayne | 7494 | 5569 | 1925 |
| Donald Driver | 5576 | 3474 | 2102 |
| Santana Moss | 6142 | 3985 | 2157 |
| Muhsin Muhammad | 6086 | 3848 | 2238 |
| Tim Brown+ | 7036 | 4311 | 2725 |
| Torry Holt | 8078 | 5304 | 2774 |
| Keenan McCardell | 6393 | 3362 | 3031 |
| Marvin Harrison+ | 8370 | 5327 | 3043 |
| Derrick Mason | 6579 | 3482 | 3097 |
| Chad Johnson | 7102 | 3957 | 3145 |
| Rod Smith | 6604 | 3168 | 3436 |
| Jimmy Smith | 6887 | 3205 | 3682 |
| Michael Irvin+ | 7712 | 3538 | 4174 |
| Average | 6205 | 4920 | 1285 |
Fitzgerald actually gained fewer receiving yards during the six prime seasons than the average receiver on this list, but he had the second-most receiving yards during the six surrounding seasons. Football Perspective favorite Joey Galloway also makes an appearance near the top of the list, which won’t surprise regular readers.
What stands out to you?
From 2012 to 2014, Larry Fitzgerald averaged 55.1 receiving yards per game. This period covered his age 29 to 31 seasons, and were the worst three seasons of his career since his rookie season. It was reasonable, I think, to assume Fitzgerald was on the decline and possibly near the end of his career. After all, he ranked 40th in the NFL in receiving yards per game during this period, and was about to enter his age 32 season.
During this same period, Randall Cobb averaged 72.3 receiving yards per game despite being just 22, 23, and 24 years old. His career trajectory was seemed limitless: he averaged 64 receiving yards per game at age 22, 72 at age 23, and 80 receiving yards per game at age 24.
So from 2012 to 2014, an about-to-be-32-year-old-Fitzgerald averaged 55.1 receiving yards per game, and an about-to-be-25-year-old-Cobb averaged 72.3 receiving yards per game. Cobb was about to enter his prime years, while Fitzgerald had just left his behind. If there were odds on who would gain more receiving yards over the next three seasons, they would be heavily weighed in Cobb’s favor.
And yet, from 2015 to 2017, Fitzgerald ranked 12th in receiving yards per game at 70.7, while Cobb ranked 55th at 47.5 receiving yards per game. [continue reading…]
In 2017, Leonard Fournette rushed for 9 touchdowns this season, covering a total of 179 yards. His average rushing total, therefore, covered 19.9 yards. However, Fournette’s median length of rushing touchdown? That was just 2.0 yards. Fournette’s touchdown runs came from 90, 75, 5, 3, 2, 1, 1, 1, and 1 yard away.
Among players with at least 4 rushing touchdowns, Derrick Henry led the way with a median length of 17 yards; LeSean McCoy wasn’t too far behind at 14 yards.
The full data set below:
| Total Rk | Player | TDs | Yards | Avg | Median | Median Rk |
|---|---|---|---|---|---|---|
| 1 | Leonard Fournette | 9 | 179 | 19.9 | 2 | 83 |
| 2 | Derrick Henry | 5 | 171 | 34.2 | 17 | 17.5 |
| 3 | Kareem Hunt | 8 | 170 | 21.3 | 4.5 | 55.5 |
| 4 | Alvin Kamara | 8 | 147 | 18.4 | 7.5 | 37 |
| 5 | Mark Ingram | 12 | 139 | 11.6 | 3 | 70 |
| 6 | Bilal Powell | 5 | 136 | 27.2 | 2 | 83 |
| 7 | Melvin Gordon | 8 | 114 | 14.3 | 1.5 | 91 |
| 8 | Kenyan Drake | 3 | 109 | 36.3 | 42 | 5 |
| 9 | LeSean McCoy | 6 | 108 | 18.0 | 14 | 21 |
| 10 | Marshawn Lynch | 7 | 104 | 14.9 | 3 | 70 |
| 11 | Todd Gurley | 13 | 102 | 7.8 | 2 | 83 |
| 12 | Orleans Darkwa | 5 | 101 | 20.2 | 1 | 108.5 |
| 13 | Cordarrelle Patterson | 2 | 90 | 45.0 | 45 | 4 |
| 14.5 | Jordan Howard | 9 | 88 | 9.8 | 8 | 33 |
| 14.5 | DeMarco Murray | 6 | 88 | 14.7 | 2.5 | 77.5 |
| 16 | Aaron Jones | 4 | 75 | 18.8 | 13.5 | 23 |
| 17 | Elijah McGuire | 1 | 69 | 69.0 | 69 | 1 |
| 18 | Chris Thompson | 2 | 68 | 34.0 | 34 | 7 |
| 19 | Jonathan Stewart | 6 | 67 | 11.2 | 1.5 | 91 |
| 20 | Corey Grant | 2 | 64 | 32.0 | 32 | 8 |
| 21 | Matt Breida | 2 | 63 | 31.5 | 31.5 | 9 |
| 22.5 | Marcus Mariota | 5 | 62 | 12.4 | 9 | 29 |
| 22.5 | Jerick McKinnon | 3 | 62 | 20.7 | 3 | 70 |
| 24.5 | T.J. Yeldon | 2 | 59 | 29.5 | 29.5 | 10 |
| 24.5 | Alex Collins | 6 | 59 | 9.8 | 7.5 | 37 |
| 26 | Austin Ekeler | 2 | 56 | 28.0 | 28 | 12 |
| 27 | Jalen Richard | 1 | 52 | 52.0 | 52 | 2 |
| 28 | Ezekiel Elliott | 7 | 51 | 7.3 | 2 | 83 |
| 29 | Deshaun Watson | 2 | 50 | 25.0 | 25 | 14 |
| 30 | Dak Prescott | 6 | 49 | 8.2 | 10 | 26 |
| 31 | Jay Ajayi | 1 | 46 | 46.0 | 46 | 3 |
| 32 | Latavius Murray | 8 | 45 | 5.6 | 1.5 | 91 |
| 33 | Ty Montgomery | 3 | 44 | 14.7 | 6 | 46 |
| 34 | Devonta Freeman | 7 | 43 | 6.1 | 1 | 108.5 |
| 35 | Trey Edmunds | 1 | 41 | 41.0 | 41 | 6 |
| 36 | Cam Newton | 6 | 38 | 6.3 | 5 | 52.5 |
| 37 | D'Onta Foreman | 2 | 37 | 18.5 | 18.5 | 15 |
| 38 | Le'Veon Bell | 9 | 36 | 4.0 | 3 | 70 |
| 39.5 | Charcandrick West | 2 | 34 | 17.0 | 17 | 17.5 |
| 39.5 | Duke Johnson | 4 | 34 | 8.5 | 7 | 40.5 |
| 42 | Isaiah Crowell | 2 | 32 | 16.0 | 16 | 19 |
| 42 | Corey Clement | 4 | 32 | 8.0 | 7.5 | 37 |
| 42 | Dion Lewis | 6 | 32 | 5.3 | 6 | 46 |
| 44 | C.J. Anderson | 3 | 31 | 10.3 | 5 | 52.5 |
| 45 | Darrius Heyward-Bey | 1 | 29 | 29.0 | 29 | 11 |
| 46 | Adrian Peterson | 2 | 28 | 14.0 | 14 | 21 |
| 47 | Tavon Austin | 1 | 27 | 27.0 | 27 | 13 |
| 48.5 | Joe Mixon | 4 | 26 | 6.5 | 6 | 46 |
| 48.5 | Marlon Mack | 3 | 26 | 8.7 | 3 | 70 |
| 50.5 | Tevin Coleman | 5 | 25 | 5.0 | 3 | 70 |
| 50.5 | Carlos Hyde | 8 | 25 | 3.1 | 1.5 | 91 |
| 52 | Theo Riddick | 3 | 24 | 8.0 | 4 | 60 |
| 53 | Frank Gore | 3 | 23 | 7.7 | 5 | 52.5 |
| 55 | Jacoby Brissett | 4 | 22 | 5.5 | 6 | 46 |
| 55 | Ameer Abdullah | 4 | 22 | 5.5 | 5.5 | 49.5 |
| 55 | Kirk Cousins | 4 | 22 | 5.5 | 4.5 | 55.5 |
| 57.5 | Javorius Allen | 4 | 21 | 5.3 | 5 | 52.5 |
| 57.5 | Rex Burkhead | 5 | 21 | 4.2 | 2 | 83 |
| 59 | Rod Smith | 4 | 19 | 4.8 | 1.5 | 91 |
| 60.5 | Brock Osweiler | 1 | 18 | 18.0 | 18 | 16 |
| 60.5 | Blake Bortles | 2 | 18 | 9.0 | 9 | 29 |
| 62.5 | Tarik Cohen | 2 | 16 | 8.0 | 8 | 33 |
| 62.5 | C.J. Beathard | 3 | 16 | 5.3 | 4 | 60 |
| 64.5 | Brett Hundley | 2 | 15 | 7.5 | 7.5 | 37 |
| 64.5 | Matt Forte | 2 | 15 | 7.5 | 7.5 | 37 |
| 67 | Eli Manning | 1 | 14 | 14.0 | 14 | 21 |
| 67 | Giovani Bernard | 2 | 14 | 7.0 | 7 | 40.5 |
| 67 | Josh McCown | 5 | 14 | 2.8 | 1 | 108.5 |
| 70 | LeGarrette Blount | 2 | 13 | 6.5 | 6.5 | 42.5 |
| 70 | DeAndre Washington | 2 | 13 | 6.5 | 6.5 | 42.5 |
| 70 | Tyrod Taylor | 4 | 13 | 3.3 | 1.5 | 91 |
| 72.5 | Jamaal Charles | 1 | 12 | 12.0 | 12 | 24.5 |
| 72.5 | Cameron Artis-Payne | 1 | 12 | 12.0 | 12 | 24.5 |
| 74 | Tion Green | 2 | 11 | 5.5 | 5.5 | 49.5 |
| 76.5 | Brian Hoyer | 1 | 9 | 9.0 | 9 | 29 |
| 76.5 | Jared Goff | 1 | 9 | 9.0 | 9 | 29 |
| 76.5 | Case Keenum | 1 | 9 | 9.0 | 9 | 29 |
| 76.5 | Lamar Miller | 3 | 9 | 3.0 | 3 | 70 |
| 81 | Lance Dunbar | 1 | 8 | 8.0 | 8 | 33 |
| 81 | Drew Brees | 2 | 8 | 4.0 | 4 | 60 |
| 81 | Christian McCaffrey | 2 | 8 | 4.0 | 4 | 60 |
| 81 | Mitchell Trubisky | 2 | 8 | 4.0 | 4 | 60 |
| 81 | Mike Gillislee | 5 | 8 | 1.6 | 2 | 83 |
| 84.5 | Jamaal Williams | 4 | 7 | 1.8 | 1 | 108.5 |
| 84.5 | DeShone Kizer | 5 | 7 | 1.4 | 1 | 108.5 |
| 87 | Devontae Booker | 1 | 6 | 6.0 | 6 | 46 |
| 87 | Dalvin Cook | 2 | 6 | 3.0 | 3 | 70 |
| 87 | Terrance West | 2 | 6 | 3.0 | 3 | 70 |
| 89 | Elijhaa Penny | 2 | 5 | 2.5 | 2.5 | 77.5 |
| 91 | Kenjon Barner | 1 | 4 | 4.0 | 4 | 60 |
| 91 | Stevan Ridley | 1 | 4 | 4.0 | 4 | 60 |
| 91 | Peyton Barber | 3 | 4 | 1.3 | 1 | 108.5 |
| 96 | Kerwynn Williams | 1 | 3 | 3.0 | 3 | 70 |
| 96 | Malcolm Brown | 1 | 3 | 3.0 | 3 | 70 |
| 96 | Jalston Fowler | 1 | 3 | 3.0 | 3 | 70 |
| 96 | Wendell Smallwood | 1 | 3 | 3.0 | 3 | 70 |
| 96 | Russell Wilson | 2 | 3 | 1.5 | 1.5 | 91 |
| 96 | Doug Martin | 3 | 3 | 1.0 | 1 | 108.5 |
| 96 | Rob Kelley | 3 | 3 | 1.0 | 1 | 108.5 |
| 101.5 | Vince Mayle | 1 | 2 | 2.0 | 2 | 83 |
| 101.5 | Joe Flacco | 1 | 2 | 2.0 | 2 | 83 |
| 101.5 | Alfred Blue | 1 | 2 | 2.0 | 2 | 83 |
| 101.5 | Tommy Bohanon | 2 | 2 | 1.0 | 1 | 108.5 |
| 113 | Mike Tolbert | 1 | 1 | 1.0 | 1 | 108.5 |
| 113 | Trevor Siemian | 1 | 1 | 1.0 | 1 | 108.5 |
| 113 | C.J. Ham | 1 | 1 | 1.0 | 1 | 108.5 |
| 113 | Delanie Walker | 1 | 1 | 1.0 | 1 | 108.5 |
| 113 | Jacquizz Rodgers | 1 | 1 | 1.0 | 1 | 108.5 |
| 113 | Alex Smith | 1 | 1 | 1.0 | 1 | 108.5 |
| 113 | Zach Zenner | 1 | 1 | 1.0 | 1 | 108.5 |
| 113 | Chris Ivory | 1 | 1 | 1.0 | 1 | 108.5 |
| 113 | Jamize Olawale | 1 | 1 | 1.0 | 1 | 108.5 |
| 113 | Andre Ellington | 1 | 1 | 1.0 | 1 | 108.5 |
| 113 | Samaje Perine | 1 | 1 | 1.0 | 1 | 108.5 |
| 113 | Alfred Morris | 1 | 1 | 1.0 | 1 | 108.5 |
| 113 | Andy Janovich | 1 | 1 | 1.0 | 1 | 108.5 |
| 113 | Roosevelt Nix | 1 | 1 | 1.0 | 1 | 108.5 |
| 113 | Jimmy Garoppolo | 1 | 1 | 1.0 | 1 | 108.5 |
| 113 | Kyle Williams | 1 | 1 | 1.0 | 1 | 108.5 |
| 113 | Anthony Sherman | 1 | 1 | 1.0 | 1 | 108.5 |
| 113 | David Fales | 1 | 1 | 1.0 | 1 | 108.5 |
| 113 | Jameis Winston | 1 | 1 | 1.0 | 1 | 108.5 |
What do you think?