
Jameis Winston and Marcus Mariota have been linked together for a long time.
In college, Jameis Winston was the 2013 Heisman Trophy winner, and his Florida State team won the college championship that season. The next season, Marcus Mariota won the Heisman Trophy Winner and his Oregon Ducks knocked Winston and the Seminoles out of the playoffs.
The two quarterbacks then were selected as the first two picks in the 2015 Draft. Who was the better prospect? That was a tough debate for many analysts to answer. Four years later, the question of who is the better pro quarterback is just as difficult to solve.
Both have been average starters in the NFL. There have been 32 quarterbacks to throw 800+ passes since Winston and Mariota entered the NFL. Of those passers, Winston ranks 17th in ANY/A and Mariota ranks 20th. Stylistically, the two quarterbacks are very different: Mariota takes a ton of sacks (he has the 5th-worst sack rate of those 32 quarterbacks; Winston is square in the middle at 16th), while Winston throws a lot of interceptions (he has the 2nd-worst INT rate) but also is a deep thrower (he has the 3rd-best yards/completion rate).
But perhaps the biggest discrepancy between the two players through four years is their records. Mariota is an average 27-28, but that’s dragged down by a 3-9 rookie season; he has been slightly better than .500 every year since. Winston, meanwhile, has a 21-33 record; his 0.389 winning percentage is the 4th-worst of those 32 quarterbacks.
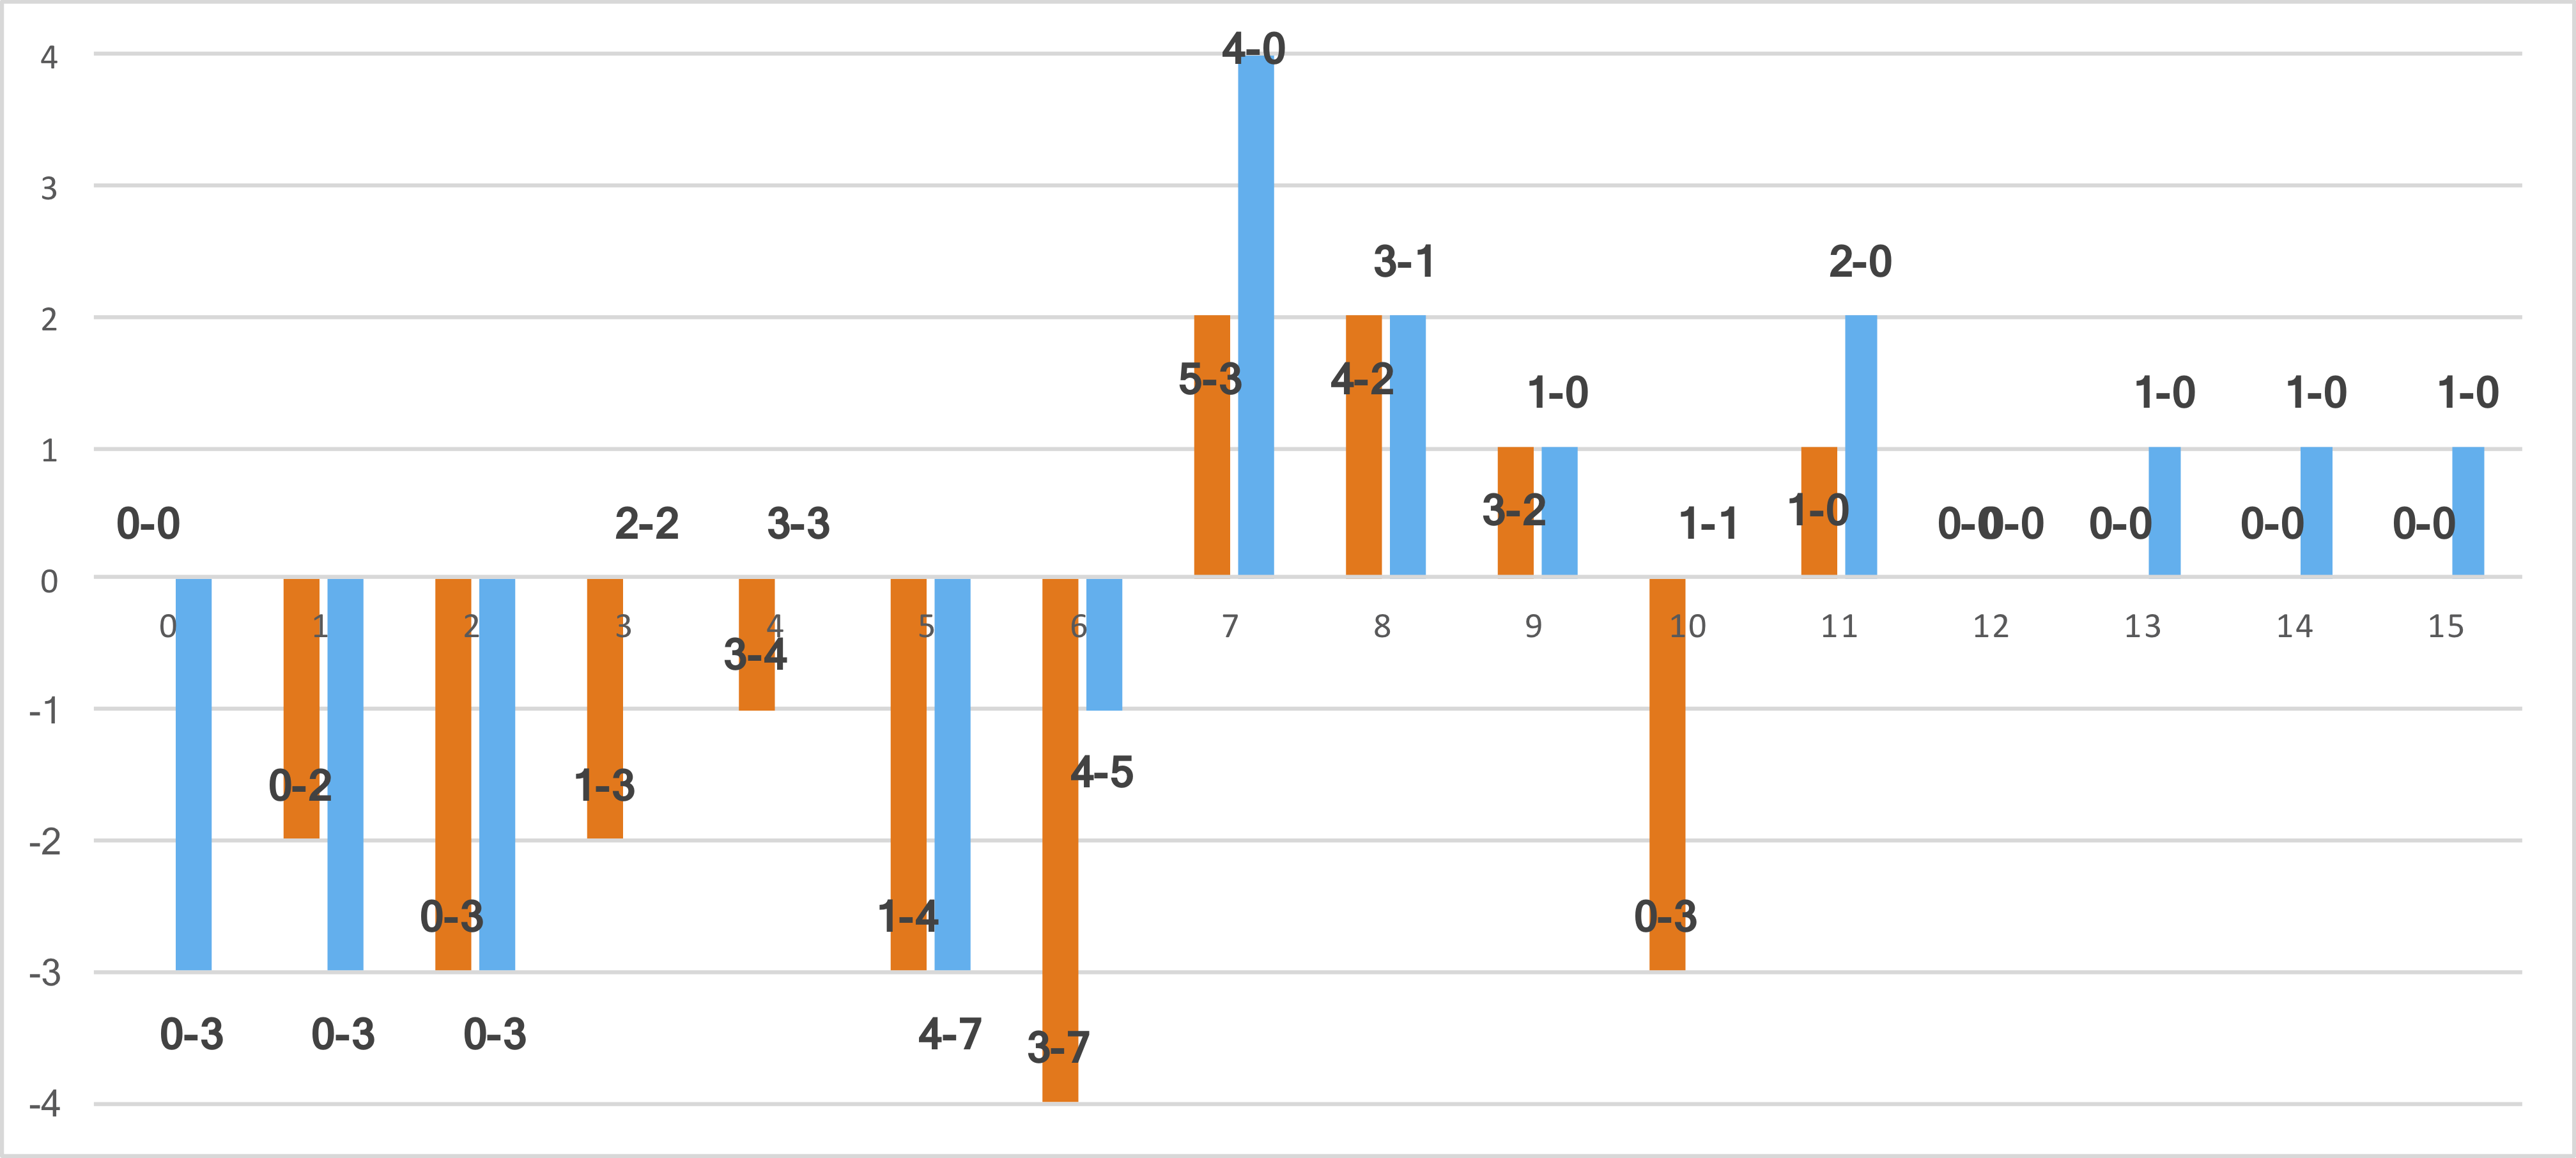
But how they got to those records tells a pretty revealing story. Mariota has started 55 games and has produced a 6.16 ANY/A average in those starts, while Winston has started 54 games and averaged 6.34 ANY/A. I calculated each quarterback’s ANY/A average in each game, and then combined those games into groups: an ANY/A of 0 to 0.99, 1 to 1.99, 2 to 2.99, etc. Then, I checked to see how many games under or over .500 each quarterback was in each group.
That’s shown below, with Winston’s numbers in orange and Mariota’s in blue. I have also included each quarterback’s full record for each category of games. For example, take a look at the graph below and look in the middle for the 7 on the X-Axis. This is all games where the quarterbacks averaged between 7 and 7.99 ANY/A. Mariota is four games over .500 in those games, going 4-0. Winston is two games over .500 in those games, going 5-3.
The biggest outliers concern Winston, particularly at the 6 and 10 marks. For Winston, he is 3-7 when averaging between 6 and 6.99 ANY/A, while Mariota is 4-5. More striking, perhaps, is at the 10-10.99 ANY/A mark: Winston there is 0-3! (Those losses were to Carolina, Washington, and Atlanta.) Mariota, meanwhile, is 7-1 when in games with an ANY/A of 9.00 or better.
With an ANY/A under 3.00, Winston is 0-5 and Mariota is 0-9; nothing unusual there. But then the divergence begins.
With an ANY/A between 3.00 and 4.99 — a bad game to be sure — Winston is 4-7 and Mariota is 5-5. You would not expect to win half of your games with that level of quarterback play, so I would say Mariota has gotten pretty good fortune there.
If you look at games with an ANY/A of 5.00 to 7.99, you would expect this to be the average group for most quarterbacks. Here, Winston is 9-14, while Mariota is 12-12. Winston has probably been a little unlucky, while Mariota has probably been a little lucky.
But the craziest grouping is from 8.00 to 10.99 ANY/A, which are all legitimate good to great quarterback games. Winston is just 7-7 in these games! Mariota, meanwhile, is 5-2, with one of those losses being a game that I profiled last year as not looking nearly as good as the stats implied.
At 11.00 ANY/A or better, Winston is 1-0, and Mariota shines here not by virtue of a perfect record, but with a whopping 5 such wins. He’s a bit more inconsistent (in a good way) than you would expect, with 5 out of 55 starts producing an ANY/A of 11.5 or better, and a 6th at 10.96 ANY/A.
I’ll leave the rest of the commentary today to you guys: what do you think?