
It’s time for a topical post here at Football Perspective, so let’s look at the careers of Roman Gabriel and Ken Stabler. Both were very good quarterbacks for a long time, and occasionally great quarterbacks for stretches. When they retired, each was a borderline HOF candidate. Statistically, Gabriel had the better career, including posting an ever-so-slightly better era-adjusted passer rating. Both are safely in the top-50 quarterbacks of all time, and while Stabler (who won a Super Bowl) is in the Hall of Fame, Gabriel probably was the better quarterback on a consistent basis.
But that’s not what I want to discuss today, because it’s not that interesting whether you have Gabriel at 28 and Stabler at 35 on your all time list, or vice versa. What *is* interesting is how they are two of the biggest outliers in two metrics that often go together.
When we think of quarterbacks who are very accurate — or inaccurate — you probably think about two metrics: completion percentage and interception rate. Often, these two numbers go hand in hand, like with, well, Joe Montana, Bart Starr, Roger Staubach, Tom Brady, Ken Anderson, or a host of others. Or the way the two metrics go in hand with passers like Mark Sanchez, Rex Grossman, or Derek Anderson.
But sometimes, some quarterbacks diverge in these two areas. And there are no better examples than the ultra-conservative Gabriel, and the ultra-aggressive Stabler.
Gabriel played from 1962 to 1977. I looked at the 32 passers with the most passing attempts during that span, and plotted them in the graph below. The X-Axis shows completion percentage, and the Y-Axis — plotted in reverse order — shows interception percentage. So to be “good” you want to be up (low INT%) and to the right (high CMP%). In the graph below, Anderson (shown in Bengals colors) is at the top right, but look where Gabriel lands (in Rams blue and white, and in a larger dot). His INT% is remarkable, but his completion percentage is just average. Gabriel is a real outlier when it comes to throwing interceptions for a player whose accuracy looks, well, average. When he retired, he ranked 2nd all-time (to a still young Anderson) in INT%, but 19th (out of 43 qualifiers) in completion percentage.
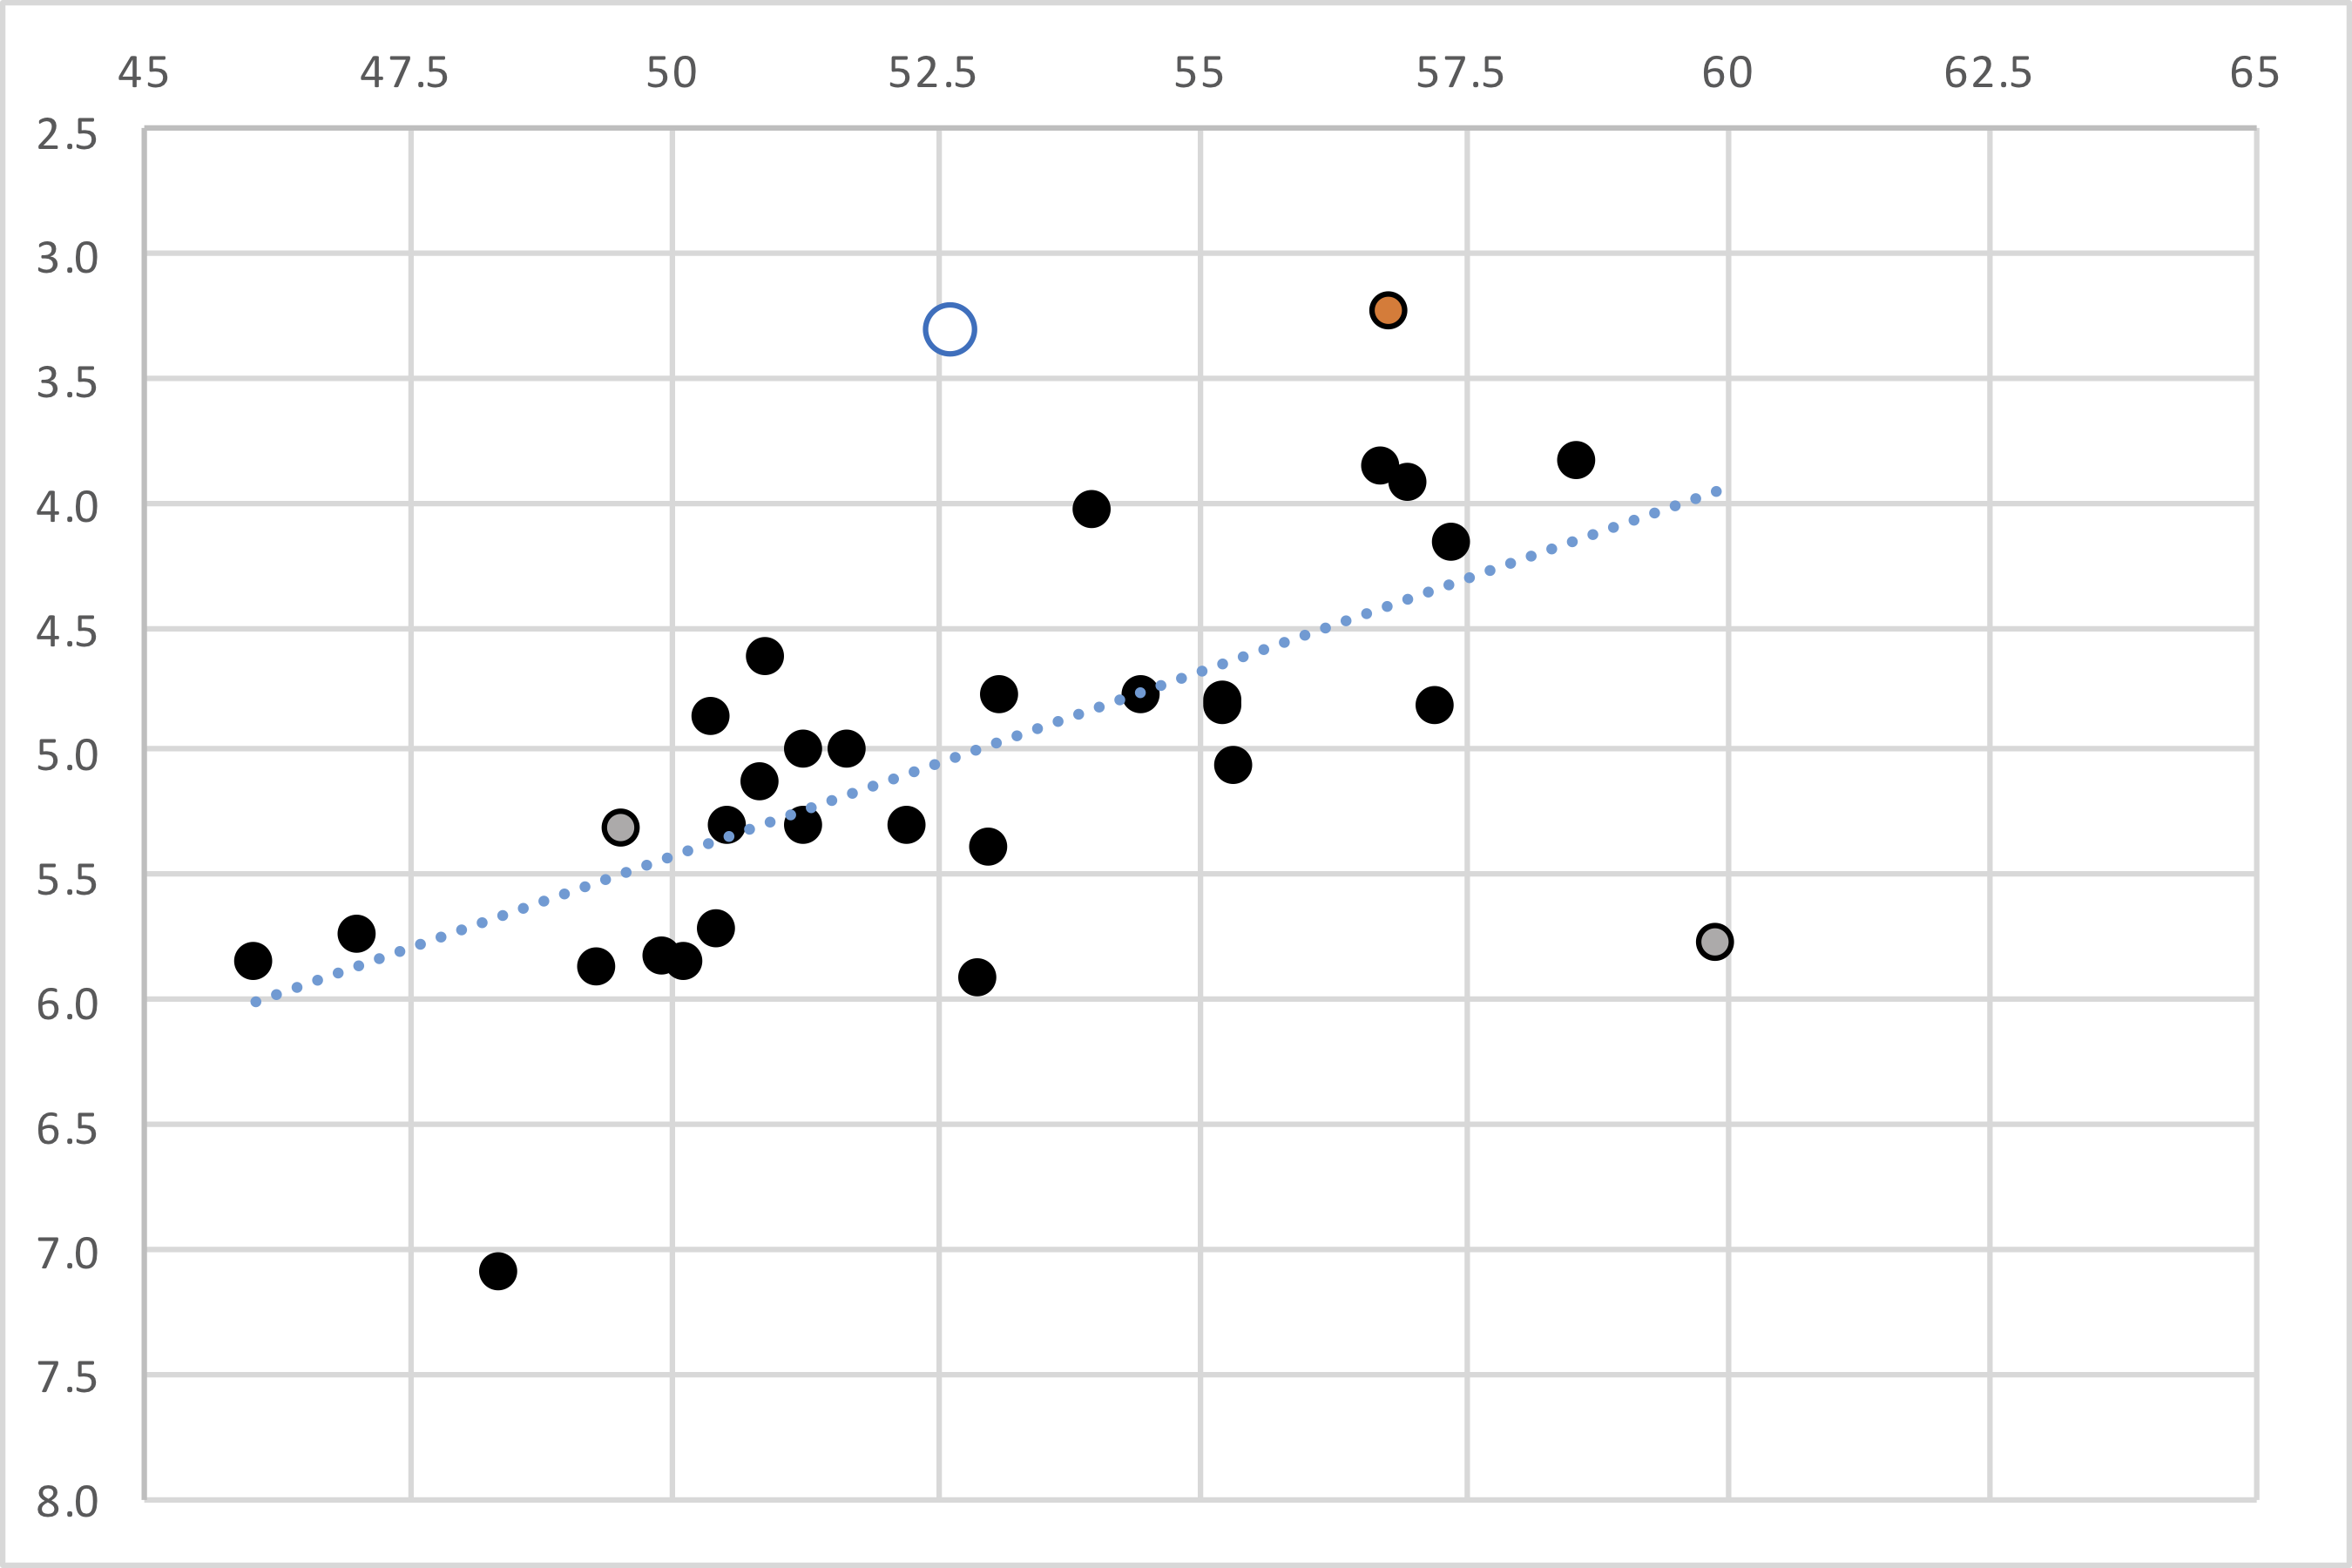
You’ll notice that while Gabriel is up high but to the left, there is a silver and black dot that is low and to the right. That’s Stabler (I also colored his Raiders teammate, Daryle Lamonica, in silver and black; he’s in a much different spot on the chart). The two quarterbacks overlapped a bit, and you can see even in this chart how different they were.
Now, let’s do the same thing for Stabler, looking at the 32 passers during his career with the most pass attempts. Again, the X-Axis shows completion percentage and the Y-Axis shows interception rate (but plotted in reverse order). You want to be up (low INT%) and to the right (high CMP%). That is where Montana sneaks in (colored in 49ers colors) at the top right of the graph, but Stabler is the weird large dot at the bottom right of the chart. His interception rate was awful (3rd-worst of his era) but his completion rate was outstanding (2nd-best to Montana).
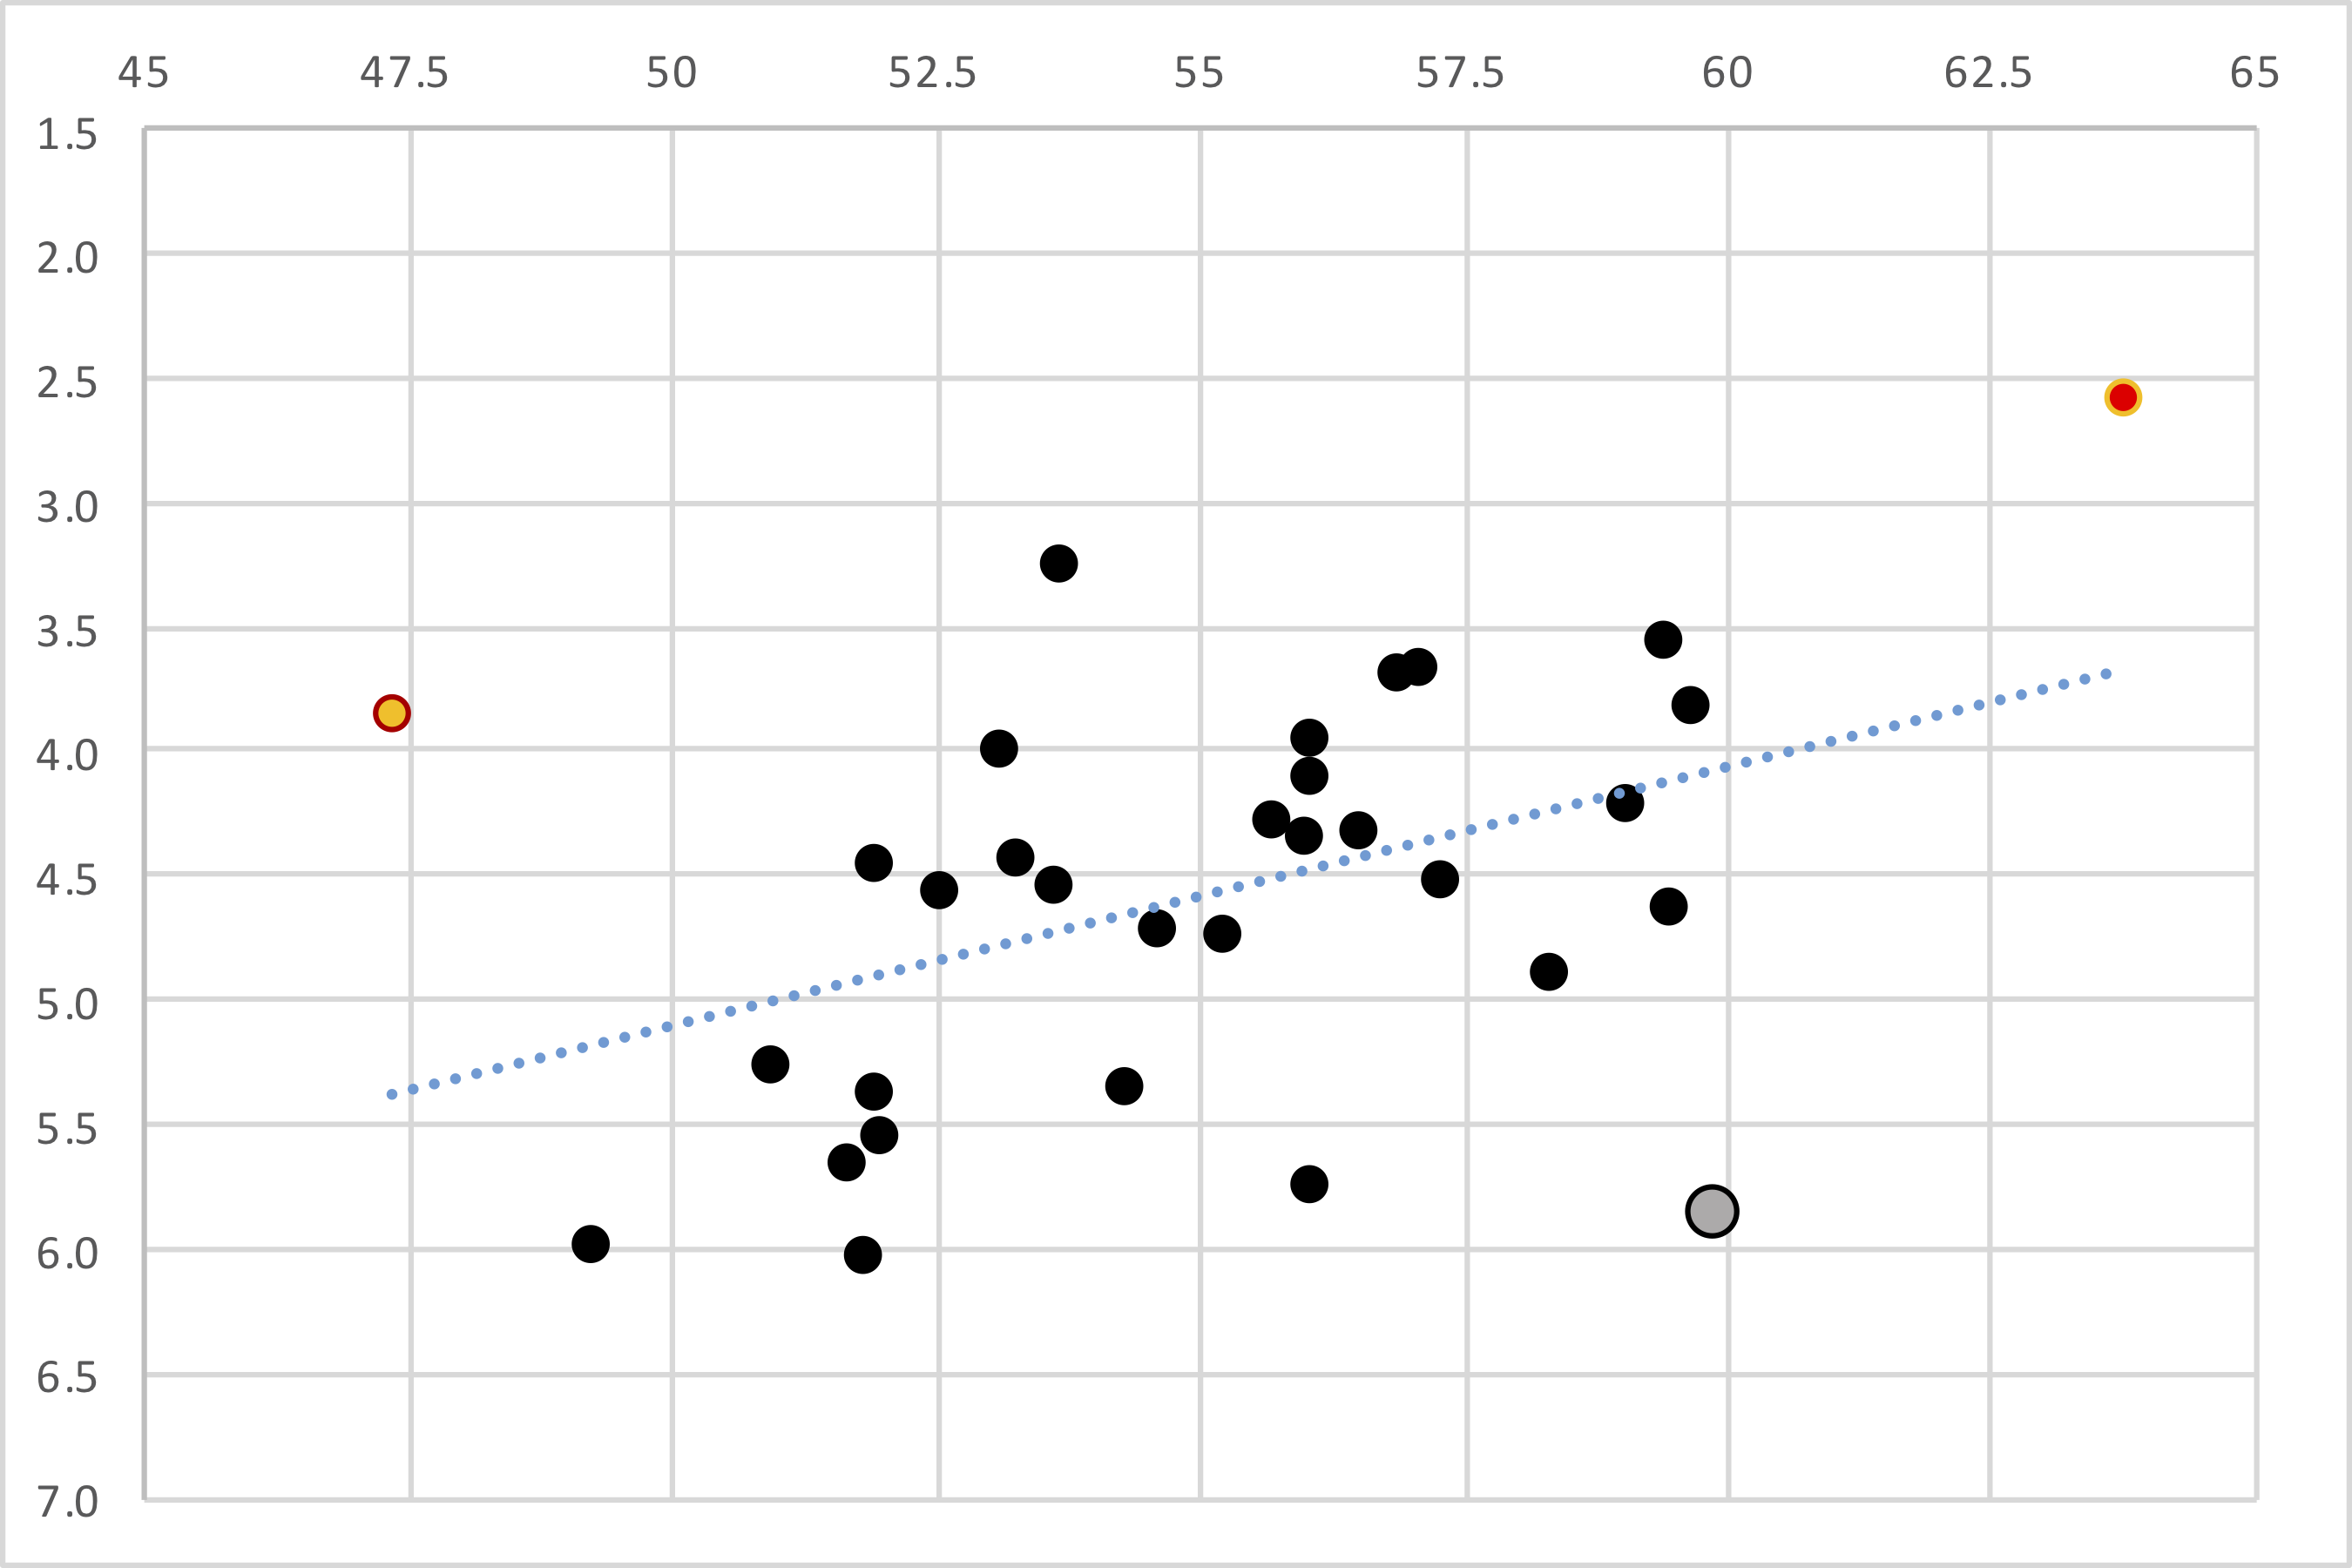
Including Montana, there are three dots that are way “up” on the chart above the trend line: Montana is at the top right, and Gabriel is in the middle at 53.7% and 3.3%, respectively. That other dot on the far left is Doug Williams — but he’s best discussed on his own day.