≡ Menu

Guest Posts: Immobile Quarterbacks

Longtime commenter Jason Winter has chimed in with today’s guest post. Jason is a part-time video game journalist and full-time sports fan. You can read more of him at his blog: https://jasonwinter.wordpress.com/, and follow him on twitter at @winterinformal.

As always, we thank Jason for contributing.


A couple months ago, Ryan Lindley had a historically bad postseason game. If he’d thrown just seven more passes in the regular season, he would have made history in another way, too.

Lindley threw 93 passes last season, while recording precisely zero rushes. There was nary a scramble, quarterback sneak, or even a kneeldown on his record for the 2014 season. At 6’3”, 229 lbs., he hardly seems the scrambling type, but he was also only 25 and was, shall we say, far from the best passer in the league. You’d think he might have resorted to using his legs at least once.

Lindley’s 93 passes gives him the second-most passes in a season for a player who recorded zero rushes. The record-holder is a somewhat better-known name: the recently deceased Earl Morrall, who recorded 99 pass attempts with the Colts in 1969 without a carry. On the one hand, Morrall was 10 years older than Lindley, though he was a fairly effective and semi-regular runner throughout his career, averaging 3.7 yards on 235 rushes in 255 career games. Lindley has thus far totaled seven yards on four carries, all coming in 2012. [continue reading…]

{ 7 comments }

Chris Borland and Playing Only One NFL Season

Late Monday night, 49ers linebacker and tackling machine Chris Borland announced that he was retiring due to concerns over the toll a longer career would have on his mind and body. Anyone can give a #hottake on this situation, but not everyone can come up with a list of the top players who played for exactly one season in the NFL.

My initial inclination was that the two best one-season careers came from Dieter Brock and Art Weiner, with former Vikings head coach Bud Grant getting an honorary nomination (you can read why, here). Brock was a great quarterback in Canada for 11 seasons who finally joined the NFL as a 34-year-old rookie in 1985. How did that happen?

The ’84 Rams were quarterbacked by Vince Ferragamo and Jeff Kemp, but they were essentially quarterbacked by Eric Dickerson. [1]Los Angeles ranked last in pass attempts and second in rushing yards, as Dickerson set the single-season rushing record. The team signed Brock in the off-season, and then traded an aging Ferragamo and a third round pick to Buffalo for tight end Tony Hunter. [2]Who would finish second on the ’85 Rams in both receptions and receiving yards. Kemp would lose the job in camp to Brock, who produced perfectly average numbers [3]His ANY/A average of 4.9 matched the league average. while playing with an insanely talented lineup (in addition to Dickerson, those Rams had Henry Ellard and sent four offensive linemen to the Pro Bowl: Kent Hill, Doug Smith, Dennis Harrah, and Jackie Slater. The fifth starter, Irv Pankey, was in the middle of a successful ten year run as the Rams left tackle.) In the playoffs, though, Brock struggled mightily, going 16/53 for 116 yards with 0 TDs and 2 INTs, which culminated in a shutout loss to the Bears in the NFC Championship Game. That would be enough for anyone to call it a career. [continue reading…]

References

References
1 Los Angeles ranked last in pass attempts and second in rushing yards, as Dickerson set the single-season rushing record.
2 Who would finish second on the ’85 Rams in both receptions and receiving yards.
3 His ANY/A average of 4.9 matched the league average.
{ 7 comments }

Sam Bradford and Breaking Out At Age 27

Bradford will move from St. Louis to Philadelphia via 195,000 eight-yard passes.

Bradford will be moving from St. Louis to Philadelphia, presumably via 195,000 eight-yard passes.

As a rookie at age 23, Sam Bradford averaged 4.73 Adjusted Net Yards per Attempt [1]Defined as Passing Yards + 20 * PTDs – 45 * INTs – Sack Yards Lost, all divided by total dropbacks (i.e., including sacks). at a time when the league average ANY/A was 5.73; as a result, we could say that Bradford had a Relative ANY/A of -1.00. The next year, he averaged 4.49 ANY/A with a RANY/A of -1.41. In 2012, he was at 5.64  and -0.30, and in seven games in ’13, he averaged 6.10 and +0.23.  In other words, he’s been mostly below-average for his career.

In order to calculate his career RANY/A to-date, we need to weight his production by his number of dropbacks, which were 624 in ’10, 393 in ’11, 586 in 2012 and 277 in his last season of play. Do the math, and Bradford has a career RANY/A of -0.68 entering the 2015 season. But could he have a breakout year playing with Chip Kelly in Philadelphia?

I decided it would be interesting to look at the question from the reverse angle: how many of the quarterbacks that were really good at age 27 were not so good before that? I defined “really good” to mean a RANY/A of +1.00 on at least 224 dropbacks since 1970 (i.e., a quarterback who had an ANY/A average at least one full yard better than league average, had a significant number of dropbacks, and did so since the merger). I also required that such quarterback had at least 500 career dropbacks through age 26 (Bradford has 1,880 career dropbacks prior to the 2015 season.)  There were 24 quarterbacks who met those criteria.

The best RANY/A season since the merger by an age 27 quarterback was Craig Morton; the Dallas quarterback hadn’t played much prior to 1970 (just 615 career dropbacks), but he had been effective in limited time before then (a career RANY/A of +1.58 prior to the ’70 season).

The second best age 27 season came from Boomer Esiason, in his MVP season of 1988. That year, he had 418 dropbacks and averaged 2.77 ANY/A better than the league average; prior to 1988, he had 1,531 career dropbacks, and a career RANY/A of +1.32. The table below shows that data for all 31 quarterbacks: [continue reading…]

References

References
1 Defined as Passing Yards + 20 * PTDs – 45 * INTs – Sack Yards Lost, all divided by total dropbacks (i.e., including sacks).
{ 7 comments }

Patrick Willis and the Hall of Fame

There are six modern players in the Hall of Fame who primarily played the inside linebacker position. [1]AV goes back to 1960, so I am defining modern as players who entered the league in that season or later. That means we have to exclude Sam Huff, Ray Nitschke, Bill George, Joe Schmidt, Mike  … Continue reading Ray Lewis will be number seven. Brian Urlacher, who retired the same year as Lewis, will likely be number eight. And Patrick Willis is now very likely to be number nine.

There is only one knock on Willis’ star-studded career: he played in just 112 games, spanning 8 seasons. But let’s compare Willis to the other six modern HOF inside linebackers (Mike Singletary, Nick Buoniconti, Jack Lambert, Harry Carson, Willie Lanier, and Dick Butkus), Lewis, and Urlacher. The best way I can think of to compare defensive players is through Approximate Value, the all-encompassing metric created by Pro-Football-Reference.com. I’ll leave it to a different writer to debate the merits of whether AV is an appropriate metric by which to measure Willis.

Through seven seasons, Willis accumulated 104 points of AV: he recorded 16 points as a rookie, then 13, 19, 15, 16, 16, and 10 in 2013. Those other eight inside linebackers averaged 83 points through seven seasons, which puts Willis’ remarkable start to his career in the proper light. In fact, other than Willis, just three defensive players have recorded over 100 points of AV through seven seasons: Lawrence Taylor, Reggie White, and Alan Page. [continue reading…]

References

References
1 AV goes back to 1960, so I am defining modern as players who entered the league in that season or later. That means we have to exclude Sam Huff, Ray Nitschke, Bill George, Joe Schmidt, Mike McCormack, Les Richter, Chuck Bednarik, and Bill Willis.
{ 45 comments }

Running Backs are More Desirable than Kickers

These guys like running backs

These guys like running backs

This time last year, the media chorus was signing that the running back position had been severely devalued in the modern NFL. Part of that, no doubt, was true: it is undeniable that less draft capital is being spent on running backs.

When I wrote about the 2014 Running Back Free Agent Market last year and how little they were being paid, I made sure to link to a pretty key point made by Jason Lisk at the Big Lead: the free agent class just wasn’t very good. Last year, the top free agent running backs were Toby Gerhart ($4.5M guaranteed, $7M over the first two years of his contract), Donald Brown ($4, $7), Rashad Jennings ($2.98, $5.25), Maurice Jones-Drew ($1.2, $5.0), Ben Tate ($2.5, $4.35), and Knowshon Moreno ($1.25, $4.25).

In case you forgot, here’s a quick summary of how those backs fared last year:

  • Gerhart averaged 3.2 yards per carry over 101 carries and was benched;
  • Brown averaged 2.6 YPC over 85 carries and was benched;
  • Jennings rushed for 639 yards in 11 games, missing 5 due to injury;
  • Jones-Drew averaged 2.2 YPC over 43 carries and is now retired;
  • Tate was cut after 106 carries and 8 games;and
  • Moreno was limited to 3 games due to injury.

This was an underwhelming class of free agent running backs that somehow fell far, far short of expectations.  Then, Chris Johnson joined the class, and signed a two-year, $8M contract with $4M guaranteed.  The Jets cut him after one season, where he gained 814 yards from scrimmage and scored two touchdowns in 16 games. [continue reading…]

{ 3 comments }

Trivia: Receiving Yards with Multiple Franchises

Last year, I asked you about rushing yards with multiple franchises. In light of the trade of Brandon Marshall to the Jets, I thought it would be fun to look at the same question but for receiving yards.

First, I stumbled upon a bit of trivia that caught me by surprise. Only one player has recorded over 5,000 receiving yards with two teams. Some hints: [continue reading…]

{ 5 comments }

In the comments to this post, Ryan noted that Mike Alstott led the Bucs with 557 receiving yards in 1996, but it was the fewest yards of any player who led his team in receiving yards that season. And in 1997, Karl Williams led Tampa Bay with just 486 receiving yards, also the fewest of any player who led his team in receiving yards that year.

Which made Ryan wonder: why isn’t there a list of the lowest team-leading receiving total across the league for each season? That’s a good question, so I went ahead and generated it for every season since 1950. For example, Jacksonville’s undrafted rookie Allen Hurns led the Jaguars with 677 receiving yards in 2014, but every other team had at least one player with more yards. [continue reading…]

{ 5 comments }

Darrelle Revis Returns

There are legitimate criticisms one could identify, and they aren’t just nits. Darrelle Revis will turn 30 in July, and his contract far outpaces that of every other cornerback in the NFL. He is getting $39M guaranteed at a rate of $7.8M in guaranteed money per season, numbers that are more than 50% higher than every other corner. He will count for $48M against the cap over the next three years. Nobody knows how Revis will age, but he’s had one ACL surgery and he’s never been a player with top notch speed, which means he can’t really afford to lose a step (quick, think how many cornerbacks — as opposed to wide receivers — you can think of that get by on veteran guile).

Revis is all about Revis, which is a crime in some circles. He’s not loyal, and is now switching teams — incredibly — for the third consecutive season. The Jets were one of the worst teams in football by any measure last year, and with no clear answer at quarterback and holes throughout the roster, squarely fall within the definition of a “rebuilding team.” And writing blank checks for 30-year-old cornerbacks is not exactly part of Rebuilding 101. [continue reading…]

{ 12 comments }

1,000 Days

1,000 days ago, Football Perspective opened its doors. There has been a post every day since then.

So while yesterday was the most exciting day in the NFL in a month, we will be taking the rest of the day off.

{ 7 comments }

The contract Miami is willing to give this guy is kind of nuts

The contract Miami is willing to give this guy is kind of nuts

Ndamukong Suh will be signing a 114 million dollar contract with the Dolphins today, with approximately $60M of that money guaranteed. Suh has often been compared to Reggie White, which makes some sense given that each player possessed rare a rare combination of size/strength/agility for any human being, and both were defensive linemen. Recently, Suh has been compared to White in another way, as some have referred to Suh as the best player to hit free agency since White.

Peyton Manning, of course, was a free agent a mere two years ago, but let’s not let facts get in the way of narrative. Suh was named a first-team All-Pro by the Associated Press last year; as it turns out, 25 players were so named between 1992 and 2014, and then switched teams the following offseason.

The table below shows all 25 players. Here’s how to read it. Suh is a defensive tackle, and his last year in Detroit was in 2014 (i.e., Year N). That season, he recorded 17 points of AV according to PFR. As of September 1st of 2015 (i.e., Year N+1), Suh will be 28.7 years old. His new team is Miami, and the final column shows how many points of AV each player produced in his first season with a new team. [continue reading…]

{ 4 comments }

Guest Post: An Argument For HOF Expansion

Bryan Frye is back with another fun guest post. Bryan, as you may recall, owns and operates his own great site at http://www.thegridfe.com/, where he focuses on NFL stats and history. You can view all of Bryan’s guest posts at Football Perspective at this link. You can follow him on twitter @LaverneusDingle.


What makes a Hall of Fame player in your opinion? Is it being in some arbitrary percentile grouping at his position? Perhaps it is a combination of stats and memorable moments. How about playoff performance? Maybe you give extra credit for champions. I certainly don’t know, and my personal Hall likely wouldn’t resemble yours. Any of those criteria you prefer, however, calls for an attendant expansion of the Hall of Fame. [1]Thanks to Adam Harstad, who was a great sounding board for my ideas and who probably helped keep this from being twice as long.

Arbitrary Percentile

One criterion people use to determine if a player belongs in the Hall of Fame discussion is his place relative to his contemporaries. If a quarterback or halfback is at or near the top of the league for a good portion of his career, he is almost guaranteed a bust in Canton. [2]The same can’t be said for some positions. I don’t hear many people talking about the legacies of Kevin Williams, Nick Mangold, or Lance Briggs. I’ve heard some analysts argue that the Hall should be reserved for the top 3-5% of players. If the top 3-5% (or any arbitrary percentage you choose) is your cutoff, then it follows that induction class sizes should increase to accommodate the increase in players. The 90th percentile of twelve starting quarterbacks includes one quarterback, whereas the 90th percentile of 32 starting quarterbacks includes three quarterbacks. Since the league has nearly thrice the teams it had fifty years ago, it makes sense to have a concomitant increase in class sizes. [continue reading…]

References

References
1 Thanks to Adam Harstad, who was a great sounding board for my ideas and who probably helped keep this from being twice as long.
2 The same can’t be said for some positions. I don’t hear many people talking about the legacies of Kevin Williams, Nick Mangold, or Lance Briggs.
{ 37 comments }

Trivia: St. Louis Rams and Receiver Turnover

From 2000 to 2008, Torry Holt led the Rams in receiving yards in every season. But since then, St. Louis has gone to the other extreme: in 2009, the leading receiver was Donnie Avery, followed by Danny Amendola in ’10, Brandon Lloyd in ’11, Chris Givens in ’12, Jared Cook in ’13, and, believe it or not, Kenny Britt in 2014. That’s seven different leading receivers for St. Louis over the last seven years. If that continues in 2015, the Rams will become just the 4th team since 1950 to have eight different leading receivers in eight seasons.

Now, no team has ever done it in nine straight years. So, today’s trivia question: Can you guess any of the three teams to run this streak for eight seasons? [continue reading…]

{ 2 comments }

Trivia: Cleveland Browns and Quarterback Turnover

In 2002, the Browns leading in passing yards was Tim Couch. It was Kelly Holcomb the next year, Jeff Garcia in ’04, Trent Dilfer the next season, and then Charlie Frye in 2006. Then, Derek Anderson led the team in passing yards in back-to-back years! Brady Quinn led the team in passing yards in ’08, and then Colt McCoy was the top quarterback for two years in a row. But we’re back to musical chairs in Cleveland, with Brandon Weeden leading in ’12, Jason Campbell in ’13, and Brian Hoyer last year. In 2015, it looks like either Johnny Manziel or Josh McCown will hold that honor.

That means over this 14-year period, the Browns will have had 12 different quarterbacks lead the team in passing yards. That, as you might suspect, is freakin’ insane, and will set an NFL record. Since Couch led the team in passing yards in ’01, it means that Cleveland has had 11 different quarterbacks lead the team in passing yards over the last 14 years. That’s tied for the record. Which brings us to today’s trivia question: can you name the only other team(s) to have such quarterback turnover?

Trivia hint 1 Show


Trivia hint 2 Show


Trivia hint 3 Show


Click 'Show' for the Answer Show

{ 8 comments }

The Emmitt Smith Rant

Emmitt Smith was a product of the system, the one where they gave him the ball.

Emmitt Smith was a product of the system, the one where they gave him the ball.

One of Doug Drinen’s first posts at the old PFR Blog was titled, “The Emmitt Smith Rant.” That was now nine years ago, and while not much has changed regarding Smith’s career since 2006, how many people other than me still remember that old post? So I’ve decided to revive Doug’s old post, with his permission, of course.

With greatness comes backlash, and every great player has collected his share of detractors. And while Football Perspective readers don’t underrate him, it feels as though Emmitt Smith has been remembered by a significant number of football fans as a less-than-special running back.  He played with Hall of Famers at quarterback and wide receiver, with Pro Bowlers at fullback, tight end, and several spots on the offensive line. As a result, it’s understandable that some diminish the peak numbers he produced during his prime.

And yes, he did put up some monster numbers during his prime.  From 1991 to 1995, Smith was historically dominant. Consider that among all running backs during their ages 22 through 26 seasons (i.e., Smith from ’91 to ’95), he rushed for 8,019 yards; the next closest player during those ages was LaDainian Tomlinson with 7,361.  Smith also rushed for 85 touchdowns: Tomlinson (72) is the only other player within 20 rushing touchdowns of Smith during those ages.

But let’s say you don’t want to give Smith “full credit” for those years.  What about what he did from 1998 to 2001? During those years, Chan Gailey and Dave Campo coached the team for two seasons each. Dallas went 28-36 during those years, and the passing attack ranked 17th in Net Yards per Attempt. In other words, these weren’t the Troy Aikman/Michael Irvin Cowboys. And while Larry Allen was still around, the offensive line was more name than substance at this point.

At the start of this four-year period, Smith was 29 years old. Through age 28, Smith had recorded 2,595 carries in the regular season, [1]In addition to 318 more in the playoffs. the most of any player through age 28 in NFL history. So you’ve got a situation where a running back had been worn down to an absurd degree, stuck on a mediocre team and on a mediocre offense. If Smith was not a special back, how would he do? [continue reading…]

References

References
1 In addition to 318 more in the playoffs.
{ 21 comments }

Here’s how NFL.com’s Lance Zierlein described Kansas inside linebacker Ben Heeney:

Undersized inside linebacker with a big motor and willingness to take chances. Lacks the athleticism to recover from mistakes in the running game and is too tight to cover in space against the pass.

But at the combine, Heeney didn’t appear out of his athletic class. He ranked a respectable 49th in the 40 yard dash and 58th in the broad jump, while performing at perfectly average levesl in the vertical jump and bench press.

But it’s the 3-cone drill where Heeney starred.   Based on my research from last year, the best-fit formula to project a prospect’s performance in the 3-cone drill is:

Expected 3-Cone = 6.98 – 0.023 * Height + 0.0081 * Weight

For every 12.3 pounds of weight, a player’s expected 3-cone time increases by 0.1 seconds.  Height, meanwhile, is positively correlated: taller players tend to perform better in this drill, which is probably due to stride length/having to take fewer steps.   Heeney, as Zierlein noted, is a bit undersized at inside linebacker: he weighed in at 231 pounds and stood at six feet even (though that combination has worked out well for other inside linebackers).

Given that height/weight combination, we would expect Heeney to complete the 3-cone drill in 7.20 seconds. But Heeney finished it just 6.68 seconds, 0.52 seconds better than expected. According to NFLSavant.com, Heeney is just the 9th inside linebacker in combine history to break 7 seconds in the 3-cone drill; Prior to Heeney, the top two times came in 2012, when undrafted Chris Galippo ran it in 6.90, and Luke Kuechley did it in 6.92.

The table below shows the results of all 207 participants in the 3-cone drill at the combine.  Thanks to NFLSavant.com for the data. [continue reading…]

{ 1 comment }

Guest Post: Touchdown Pass Vultures

Adam Steele is back for another guest post. And, as always, we thank him for that. You can view all of Adam’s posts here.


During the 2014 season, Chase noted that the league-wide touchdown pass rate was the highest it had been since the NFL merger. The final few weeks of the season dragged down the average a little bit, but 2014 still checks in as the most touchdown pass friendly year in NFL history. In response, a few commenters cited the possibility that teams were tallying more TD passes by sacrificing TD runs, which is a logical conclusion considering the very low rate of rushing touchdowns in 2014 (teams averaged 0.74 per game, the lowest since 1999). Today, I’m going to look into this further and see if teams really are inflating their passing TD numbers at the expense of the run.

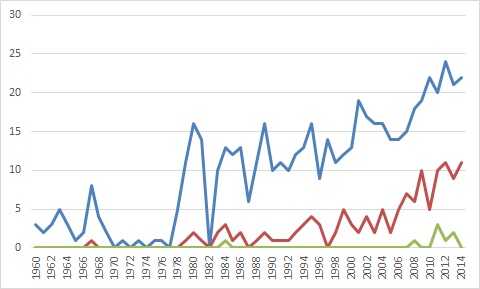
First, we have to establish a historical baseline, and I did this by looking at every NFL season since 1950. [1]AFL numbers were not included. In that time frame, teams averaged 2.26 offensive touchdowns per game, with 1.35 of those coming via the pass and 0.91 via the run. Translated into a ratio, offensive touchdowns have historically been 59.6% passing and 40.4% rushing. That 59.6% is the key number here, as it will be the baseline ratio for expected passing touchdowns. Below is a chart containing relevant information for each year since 1950. The “PaTD %” column represents the percentage of offensive touchdowns in a given year that were scored via the pass, and the “Inflation” column compares that year’s passing TD ratio with the historical average of 59.6%.

YearPassTD/GRushTD/GOffTD/GPaTD %Inflation
20141.580.742.3268%14.1%
20131.570.82.3766.2%11.1%
19651.571.012.5760.9%2.2%
19631.540.972.5161.4%3%
19621.531.092.6258.5%-1.9%
19521.511.022.5359.7%0.2%
20121.480.782.2665.4%9.7%
20101.470.782.2565.3%9.6%
19581.471.222.6954.5%-8.5%
19541.471.062.5258.1%-2.5%
20111.460.782.2465.1%9.2%
19871.450.862.3162.9%5.5%
19611.451.052.558.2%-2.4%
19671.450.982.4259.7%0.1%
19691.440.882.3262.1%4.2%
20041.430.812.2463.8%7%
19641.420.992.4158.9%-1.2%
19601.421.032.4557.9%-2.9%
19501.411.332.7451.4%-13.7%
20071.410.752.1665.1%9.2%
19831.40.982.3758.9%-1.2%
19511.391.222.653.3%-10.5%
20091.390.842.2262.3%4.6%
19951.380.82.1863.3%6.2%
19841.370.922.2960%0.7%
19981.370.792.1663.5%6.5%
19681.370.92.2760.4%1.4%
19591.371.12.4755.3%-7.1%
20021.360.92.2560.1%0.9%
19801.350.962.3158.4%-1.9%
19991.340.732.0764.7%8.6%
19851.330.992.3257.4%-3.6%
19661.330.952.2958.3%-2.1%
19811.320.982.357.3%-3.9%
19531.311.172.4952.8%-11.4%
19861.310.92.259.4%-0.4%
19961.30.762.0663.2%6.1%
19941.30.762.0663.2%6%
19891.30.872.1760%0.7%
19971.290.82.0961.6%3.4%
19901.280.842.1360.4%1.4%
20011.280.742.0263.5%6.6%
20001.280.832.1160.6%1.7%
20031.280.832.1160.5%1.5%
19821.270.922.1958.1%-2.5%
20061.270.832.0960.4%1.4%
20081.260.932.1957.6%-3.4%
20051.260.842.159.9%0.5%
19551.251.152.452%-12.7%
19881.240.952.1956.7%-4.8%
19791.21.092.2952.5%-11.9%
19751.191.132.3251.2%-14.1%
19571.181.12.2851.7%-13.3%
19701.170.81.9859.3%-0.5%
19931.150.681.8363%5.7%
19921.150.741.960.8%2%
19911.140.81.9458.8%-1.3%
19561.131.242.3747.5%-20.3%
19721.1112.1152.6%-11.7%
19761.11.062.1651.1%-14.3%
19711.070.911.9853.9%-9.6%
19781.041.012.0650.8%-14.8%
19731.040.911.9553.4%-10.4%
19741.0312.0450.7%-14.8%
19770.990.91.8952.4%-12%

As you can see, 2014 really did feature highly inflated passing TD totals, with 68.0% of offensive touchdowns coming through the air. This trend began in 2010, stabilized for four years, then jumped again significantly last season. The most obvious explanation is that teams are now passing more in general, so it would follow that they would also pass more to score touchdowns. But that’s only part of the story, as the rate of passing touchdowns has far outstripped the rate of overall called passes.

The main culprit appears to be goal line play selection, which has heavily favored the pass in recent seasons. Interestingly, from 1997-2009, there was no trend whatsoever, with passing TD ratios jumping around randomly from season to season. From 1980-1994, passing TD ratios were slightly lower, yet still very random. Even during the dead ball era of the 1970s, when the rules made passing far more difficult than it is today, teams still scored more often with passes than they did with runs. In fact, the famous 1956 season was the only time in the last 65 years where teams scored more rushing touchdowns than passing touchdowns.

But here’s what fascinates me the most: Despite the huge increases in total yardage and passing efficiency in recent years, offensive touchdowns have increased very little. In 2014, teams scored only 0.06 more offensive touchdowns than the historical average. In fact, the top 15 seasons for offensive TD production all came before the merger! If the NFL had been playing a 16 game schedule in the ’50s and ’60s, TD pass totals would be very similar to what we see today, and rushing TD totals would be higher.

So how does all this affect touchdown records for various quarterbacks? Since the 16 game schedule began in 1978, there have been 51 teams who scored at least 50 offensive touchdowns in a given season. Of those 51 teams, 33 of them had passing TD ratios above the historical average of 59.6%. In this chart, I list the primary QB, although the numbers represent team totals. The “Adjusted Pass TD” column is calculated by multiplying offensive touchdowns by .596, calculating how many TD passes would have been thrown by sticking with the historical average ratio. The “Change” column represents the difference in adjusted TD passes compared to actual TD passes, basically measuring how many TD pass were vultured from the run game.

YearTeamQBPassTDRushTDOffTDPaTD%Adj PaTDChangeInflation
2013BroncosManning55167177%42-1330%
2007PatriotsBrady50176775%40-1025.2%
1984DolphinsMarino49186773%40-922.7%
2011PackersRodgers51126381%38-1335.8%
2000RamsWarner37266359%381-1.4%
2011SaintsBrees46166274%37-924.5%
2004ColtsManning51106184%36-1540.3%
199849ersYoung41196068%36-514.7%
199449ersYoung37236062%36-13.5%
1981ChargersFouts34266057%362-4.9%
2012PatriotsBrady34255958%351-3.3%
1983RedskinsTheismann29305949%356-17.5%
1998VikingsCunningham41175871%35-618.6%
1998BroncosElway32265855%353-7.4%
2004ChiefsGreen27315847%358-21.9%
2011PatriotsBrady39185768%34-514.8%
2001RamsWarner37205765%34-38.9%
1985ChargersFouts37205765%34-38.9%
2010PatriotsBrady37195666%33-410.9%
1980CowboysWhite30265654%333-10.1%
2006ChargersRivers24325643%339-28.1%
2003ChiefsGreen24325643%339-28.1%
1986DolphinsMarino4695584%33-1340.4%
1999RamsWarner42135576%33-928.1%
2014BroncosManning40155573%33-722%
1991BillsKelly39165571%33-619%
2009SaintsBrees34215562%33-13.7%
199349ersYoung29265553%334-11.5%
1988BengalsEsiason28275551%335-14.6%
2008SaintsBrees34205463%32-25.7%
2005SeahawksHasselbeck25295446%327-22.3%
2012SaintsBrees43105381%32-1136.2%
2014CowboysRomo37165370%32-517.2%
2009VikingsFavre34195364%32-27.7%
198449ersMontana32215360%3201.3%
2004ChargersBrees29245355%323-8.2%
2002ChiefsGreen27265351%325-14.5%
2014PackersRodgers38145273%31-722.6%
1983CowboysWhite31215260%3100%
2014ColtsLuck4295182%30-1238.2%
2013EaglesFoles32195163%30-25.3%
2007ColtsManning32195163%30-25.3%
1985BengalsEsiason31205161%30-12%
1991RedskinsRypien30215159%300-1.3%
199249ersYoung29225157%301-4.6%
2000RaidersGannon28235155%302-7.9%
2011LionsStafford4195082%30-1137.6%
2007CowboysRomo36145072%30-620.8%
2003PackersFavre32185064%30-27.4%
1985DolphinsMarino31195062%30-14%
2009PackersRodgers30205060%3000.7%

I have plenty of thoughts about this chart, but I’m more interested to see what the readers think. Does this analysis change your opinion of any of these great QB seasons?

References

References
1 AFL numbers were not included.
{ 12 comments }

Connecticut cornerback Byron Jones made history at the 2015 combine, with an unbelievable broad jump of 147 inches. And the video was every bit as impressive as it sounds. Keep in mind that no other player in combine history has ever even hit the 140 inch mark, giving Jones a full 8″ lead on every other broad jump ever recorded in Indianapolis.

On the other hand, Alvin “Bud” Dupree did something special, too. Remember, the Kentucky outside linebacker weighed in at 269 pounds, and he managed to jump 138 inches. In combine history, no other player over 260 pounds has jumped more than 129 inches; lower the weight to over 250 pounds, and the best mark after Dupree is 131 inches. So the Wildcats edge rusher was really in a class of his own, too.

There were 249 prospects in Indianapolis who performed in the broad jump. I performed a regression analysis using weight and height as my inputs, since both variables were highly significant in predicting the broad jump. Here is the best-fit formula: [continue reading…]

{ 7 comments }

The GOAT.

The GOAT.

On February 20th, Football Perspective hosted a “Wisdom of Crowds” election with respect to the question: Who is the Greatest Running Back of All Time?™ Well, Football Perspective guest commenter Adam Steele offered to count the ballots, and I’ll chime in with some commentary.

There were 41 ballots entered, with each person ranking his or her top 20 running backs. The scoring system was simple: 20 points for a 1st place vote, 19 for a 2nd place vote, and so on. As it turns out, the race for the top spot was heated, with three players running away from the pack.

This chart is sortable by total points, points per ballot (using 41 as the denominator), GOAT votes, top 5 votes, and top 10 votes. In the interest of statistical significance, a player needed to appear on at least five ballots in order to be ranked in the table below. [continue reading…]

{ 113 comments }

As a general rule, shorter and heavier guys tend to dominate the bench press. When I looked at this last year, the best-fit formula to predict the number of reps of 225 a prospect could achieve was:

Expected BP = 30.0 – 0.560 * Height + .1275 * Weight

What does that mean? All else being equal, if Prospect A is 7 inches shorter than Prospect B, we would expect Prospect B to produce about 4 more reps than Prospect A. And for every eight pounds of body weight a player has, we would expect one additional rep out of that prospect.

Which brings us to Clemson outside linebacker Vic Beasley. Standing 6’3 and “only” 246 pounds, Beasley doesn’t exactly fit the profile of a bench pressing machine. But in Indianapolis, he pumped out an incredible 35 reps, tied for the third most at the combine (no other player under 300 pounds had even 33 reps). Given his height and weight, the formula above would project Beasley for 19.4 reps, which means he exceeded expectations by a whopping 15.6 reps. No other player came close to exceeding expectations to such a significant degree.

The table below shows the results of all players who participated in the bench press at the combine.  All data comes courtesy of NFLSavant.com.

[continue reading…]

{ 2 comments }

Weekend Trivia: Supplemental Draft

Given that the NFL draft and the lead-up to the draft have become so remarkably over-exposed, is there anything about the NFL that is under-exposed at this point? Or at least not over-exposed? Maybe the answer is no, but today’s trivia questions at least look at the hidden part of the draft: the supplemental draft.

After producing Steve Young and Bernie Kosar in the 1980s, the supplemental draft mostly went dead at producing quarterbacks from 1990 until Terrelle Pryor in 2011. Who is the only quarterback that was drafted in the supplemental during that time?

Trivia hint 1 Show


Trivia hint 2 Show


Trivia hint 3 Show


Click 'Show' for the Answer Show

Just as only one quarterback was selected in the supplemental draft in the 90s, there was only one quarterback chosen in the supplemental draft in the 1970s. Can you name him?

Trivia hint 1 Show


Trivia hint 2 Show


Trivia hint 3 Show


Click 'Show' for the Answer Show

{ 6 comments }

One of the biggest headlines from the combine were the jumps from Byron Jones, a cornerback from Connecticut. Most impressive was his broad jump, which was not only 8 inches better than everyone else in Indianapolis, but also 8 inches better than anyone else in combine history. More on his broad jump in a future post, but Jones’ 44.5″ vertical too shabby, either: it was the best since 2009, when Ohio State and eventual Chiefs safety Donald Washington jumped 45 inches (a feat later matched by one other player at this year’s combine).

But Jones didn’t have the most impressive vertical at the combine, because at 199 pounds, there’s an expectation that he would do fairly well in that drill.  Given his weight, we would expect Jones to jump about 35.5 inches, based on the best-fit formula derived here, and defined below:

Expected VJ = 48.34 – 0.0646 * Weight

One way to think of that formula is that for every 15.5 pounds of player weight, the expectation on the vertical is one fewer inch.  So at 230 pounds, the expectation would be 33.5 inches.  Which brings us to Alvin “Bud” Dupree, whom we lauded yesterday for the top performance in the 40-yard dash.  At 269 pounds, he would be expected to jump roughly 31.0 inches.  Instead, the Kentucky edge rusher jumped a whopping 42.0 inches — or 11.0 inches over expectation — making it the best weight-adjusted performance of any player in Indianapolis.

Below are the results of the Vertical Jump for every player at the combine. All data comes courtesy of NFLSavant.com. [continue reading…]

{ 5 comments }

Bud Dupree Ran The Top Weight-Adjusted 40 At 2015 Combine

Last year, I looked at various data from the NFL combine and tried to put the results from some of the drills in perspective. Let’s do that again with the 40-yard dash, with data courtesy of courtesy of NFLSavant.com.

The best-fit formula to project a 40-yard dash time, given a prospect’s weight, is:

Expected 40 Time = 3.433 + 0.00554 * Weight

Alvin “Bud” Dupree, an outside linebacker from Kentucky, weighed in at 269 pounds at the combine, giving him an expected 40 time of 4.92. But in Indianapolis, he ran the dash in just 4.56 seconds, meaning he exceeded expectations by an incredible 0.36 seconds. That was the top time of 2015, and would have been the second best in 2014 behind only to Jadeveon Clowney.

The full results from the Combine this year, below: [continue reading…]

{ 4 comments }

Good at catching footballs, in the event his team throws one

Good at catching footballs, in the event his team throws one

The Houston Texans finished 31st in pass attempts in 2014, ahead of only the Seattle Seahawks. The Texans were not exactly the beneficiaries of stellar quarterback play, either: Ryan Fitzpatrick handled 64% of the team’s pass attempts, with Case Keenum, Ryan Mallett, and Tom Savage taking the rest.

As a result, the 1,210 yards DeAndre Hopkins gained in 2014 is a lot better than it sounds. Houston threw for just 3,460 yards last year (excluding sacks), which means Hopkins gained 35% of all Texans receiving yards. Antonio Brown led the NFL with 1,698 receiving yards, but even that was just 34% of all Steelers receiving yards.

The table below shows the top 53 leaders in percentage of team receiving yards: [continue reading…]

{ 2 comments }

Call For Guest Posts

There’s no more enjoyable community than the Football Perspective community. Football Perspective has always encouraged guest submissions, but it’s worthwhile reminding folks of that every now and again.

If you ever want to submit a guest post, all you need to do is write it and email it to me at chase[at]footballperspective[dotcom]. I don’t need a bio or an explanation for why you should be considered for a guest post: at Football Perspective, content trumps all.

{ 1 comment }

Forsett, praising his Excess Yards

Forsett, praising his Excess Yards

In the comments to the Greatest Running Back of All-Time Post — and reminder, entries are due by midnight Thursday — a debate broke out between sn0mm1s and Jay Beck, among others, about how to value running backs generally, and specifically, the value of long runs.

One idea I’ve had before is that the yards a player gains after picking up a first down are similar to the yards picked up by a returner. For example, when a punt returner gains 10 yards instead of 5, that’s obviously worth 5 additional yards of field position to his team. But it’s not as valuable as 5 yards on 3rd-and-5; the return yards were gained outside of the context of the down-and-distance/series-of-downs nature of the game.

Does this mean that all yards gained after a first down are exactly as valuable as return yards? I’ll leave up that to the reader to decide. But I do think one thing is noncontroversial: Lamar Miller ran for a 97-yard touchdown on 1st-and-10 against the Jets in week 17, the most valuable 10 yards during that run were the first ten. The last 87 yards were slightly less valuable (on a per-yard basis), or akin to the yards a player would gain on a return.

At this point, you might be thinking, “Who cares?” And that’s a very good question: after all, return yards are valuable. And the last 87 yards of Miller’s run were certainly more valuable to Miami than the first 10 yards, even if that may not be true on a per-yard basis.

But I thought it would be interesting to look at all running plays this season, and break them into two categories: yards that came after a first down had already been achieved, and all other rushing yards. So a 10-yard run on 3rd-and-5 has five yards in each bucket; if it was 3rd-and-1, 9 yards get assigned to the “excess yards” bucket, and 1 yard to the “going towards picking up a first down” bucket. [continue reading…]

{ 19 comments }

Quarterbacks and Passing Milestones

The first 3,000 yard passer came in 1960, when Johnny Unitas reached such feat in the NFL and Jack Kemp and Frank Tripucka did so in the AFL. Joe Namath became the first 4,000-yard passer seven years later, and Dan Marino in 1984 was the first to reach 5,000 yards.

The graph below shows the number of 3,000 yard passers in blue, 4,000-yard passers in red, and 5,000-yard passers in green in each season since 1960.  As you can see — and no doubt already knew — passing productivity is on the rise:

YardPassers [continue reading…]

{ 11 comments }
Was this the best quarterback of his era?

Was this the best quarterback of his era?

There are a lot of great things about Football Perspective, but my favorite is the caliber of the commenters. The Football Perspective community is a great one, and has been going back to its days at the Pro-Foootball-Reference blog. In the recent Greatest QB of All Time, Wisdom of Crowds post, long-time commenters Kibbles and Brad O. got into a fascinating discussion in the comments about Norm Van Brocklin and Otto Graham.

I’ve decided to reproduce, unedited, their words here. Why? Well, for starters, I found the debate fascinating, but you may not have seen the whole thing buried in the comments. The Van Brocklin/Graham question is a great one, and any historian will enjoy reading their thoughts. I also present their words in an aspirational sense: the Football Perspective commenters are great, but these are the type of respectful, meaningful, and thought-out words that I hope breaks out more often.

I kicked things off by expressing a bit of disappointment that Van Brocklin finished only 25th in the Wisdom of Crowds poll.  He had a star-studded career, is the only quarterback to lead two different NFL teams to a title, and had some outstanding efficiency seasons. [continue reading…]

{ 72 comments }

Since 1950, there have been only 24 seasons where a team’s rushing leader rushed for more yards than its passing leader gained through the air. The last team to accomplish this feat was the 2009 Titans, when Chris Johnson rushed for 2,006 yards. That year, the Titans split the duties at quarterback, with Vince Young throwing for 1,879 yards and Kerry Collins finishing with 1,225.

Can you guess which team had the largest differential?

Trivia hint 1 Show


Trivia hint 2 Show


Trivia hint 3 Show


Click 'Show' for the Answer Show
[continue reading…]

{ 4 comments }

Greatest RB of All Time: Wisdom of Crowds Edition

Two weeks ago, Adam Steele administer a Wisdom of Crowds edition of the GQBOAT debate. Today, Adam has offered to run the same experiment but for running backs.  And we again thank him for that.


Who is the Greatest Running Back of All Time? In recent years, the practice of crowd sourcing has gained momentum in the analytics community, in some cases yielding more accurate results than mathematical models or expert opinions. For the initiated, here’s the gist: Every human being represents a data point of unique information, as all of us have a different array of knowledge and perspective about the world. Therefore, when you aggregate the observations of a group of people, they will collectively possess a greater and more diverse reservoir of knowledge than any single member of the group.

The readers of Football Perspective are an insightful bunch with areas of expertise spanning the entire football spectrum; we are the perfect group for crowd-sourcing these sorts of age-old football questions. And given how successful the last experiment was, there’s no reason not to look at other positions. If you’d like to participate in this experiment, there are just a few guidelines to follow:

1. Create a list of the top 20 running backs of all time, in order, using any criteria you believe to be important. I encourage readers to be bold in your selections – don’t worry about what others may think.

2. Commentary is not necessary, but most definitely welcome. In particular, I’d enjoy seeing a short blurb explaining the criteria you based your selections on.

3. Please compile your rankings BEFORE reading anyone else’s. Crowdsourcing works best when each source is as independent as possible.

4. Please DO NOT use multiple screen names to vote more than once.

The deadline to cast your ballot is midnight on Thursday the 26th, then analyze the results in a follow-up article. A first place vote is worth 20 points, second place 19 points, and so on. Let the process begin!

{ 154 comments }

An Early Look at 2015 Vegas Win Totals

Like last year, CG Technology (formerly Cantor Gaming) is the first Las Vegas book to release win totals. For your convenience, I have produced them below, and sorted the list by the difference between 2015 Vegas wins and 2014 wins. [continue reading…]

{ 3 comments }