Yesterday, I looked at how long it took the best quarterbacks to break out. Today, I want to apply what we learned from that post to 15 current NFL quarterbacks with fewer than 50 starts, all of whom were 26 years old or younger during the 2013 season.
Bradford looks to check down.
Bradford was overrated after he put up good counting stats but weak efficiency numbers as a rookie; he posted a -1.0 RANY/A in 2010, a -1.4 average in 10 starts in 2011, was at -0.3 in 16 starts in 2012, and then +0.2 in seven starts last year. Yesterday, we noted that great quarterbacks who came to terrible teams (Warren Moon and Drew Brees, in addition to former number one picks like Troy Aikman, Terry Bradshaw, Vinny Testaverde, and Steve Young) struggled initially. Bradford would seem to fit that mold, although he’s now 49 starts into his career. Are there other reasons to give him a pass?
St. Louis had the third-youngest offense in the NFL last year, and the man who has gained the most yards from Bradford over the last four years is Brandon Gibson. The former first overall pick has received very little help, and been saddled with a revolving door of mediocre receivers.
On the other hand, Kellen Clemens posted better numbers than Bradford last year, at least when you adjust for strength of schedule. As Bill Barnwell pointed out last week, Bradford’s big problem is his inability to throw the ball down the field, which jives with some of the work I’ve done Bradford’s historically low yards per completion averages. If not for Bradford’s first season of above-average work last year, I’d say his odds of ever being a franchise quarterback are very low. But there has been some progression, and he does fit the mold of number one pick being saddled with bad teammates. Of course, the presence of Brian Schottenheimer is enough to make me skeptical of Bradford’s ability to put it all together this year. Perhaps the best case scenario is a Testaverde-like revival with another team years from now.
Cam Newton (48 career starts): Career RANY/A of +0.30.
Not much to see here. Newton’s RANY/A has moved from +0.3 as a rookie to +0.7 in 2012 to -0.2 last year; it went under the radar because #QBWINZ, but Newton did have a down season in 2013. It’s hard to find any reasons for optimism for the Panthers this year after a mass exodus in the offseason, but that doesn’t say much about Newton’s long-term prospects. Add in his rushing ability, and Newton has shown enough to say that he’s still in contention (if he’s not already there) to go down as a franchise quarterback.
Andy Dalton (48 career starts): Career RANY/A of -0.01.
Look at that, Dalton is almost perfectly average! Bill Barnwell did a nice job profiling Dalton last week, and it does seem like what you see is what you will get from Dalton. After posting slightly below-average RANY/A numbers in 2011 and 2012, he was above-average (+0.4) last year. But the Bengals have one of the most talented offenses in the NFL if you exclude the quarterback position; at this point, you’d be hard-pressed to find many folks who believe Dalton will turn into a future star.
Of the 42 quarterbacks I looked at yesterday, 13 failed to be significantly above-average during any of their first three 16-game samples. Dalton doesn’t really resemble any of them: Bradshaw/Testaverde/Elway/Vick were former number one picks; Brady/Favre/Krieg/Kelly were on the border of being good enough on to not make the list, and were certainly ahead of where Dalton is now; McNabb and Cunningham were running quarterbacks. Moon played for a terrible team, and Gannon and Theismann sat for long stretches. That’s the full thirteen. The best case scenario may be that Dalton turns into a Krieg or a poor man’s Jim Kelly. Of course, he could also win a Super Bowl by riding the coattails of one of the more talented (and youngest) rosters in the league.
Christian Ponder (35 career starts): Career RANY/A of -1.19.
There are always excuses to be made for bad quarterbacks, and I’m sure that there are still some Vikings fans who believe in Ponder. He produced a -1.7 RANY/A as a rookie, improved to -0.9 in 2012, but was back at -1.1 in nine starts last year. Minnesota may not have a ton of talent at wide receiver, but Ponder’s failure to produce even with Greg Jennings is yet another strike against him. The Vikings drafted Teddy Bridgewater at the end of the first round in the 2014 draft, which seems like the beginning of the end for the former Florida State star.
Wilson is watching game tape right now.
Franchise quarterback achievement badge mode: unlocked.
Ryan Tannehill (32 career starts): Career RANY/A of -0.80.
Tannehill was at -0.7 RANY/A in 2012 and at -0.9 RANY/A last year; neither of those numbers put his future prospects in a positive light. There are excuses, to be sure: he was a raw prospect, the Dolphins offensive line was the worst in the NFL, he and Mike Wallace have the chemistry of a pair of tomatoes, etc., but the numbers are bleak enough to cast doubt on Tannehill’s future. Unless the argument is that Tannehill landed on one of the very worst offenses in the league — which would allow you to lump him in with the Aikmans, Bradshaws, Breeses, and Testaverdes of the world — there is simply no precedent for a quarterback being this below average for this long and then turning into a franchise passer. Barnwell is a little (and only a little) more bullish on Tannehill than I am, but 2014 would appear to be Tannehill’s last chance to convince the Dolphins that he was not a wasted pick. There are a couple of mitigating factors here — the running game has been terrible, and as an immediate starter, Tannehill is at a disadvantage relative to other quarterbacks on this list — but I’m not going to lose sleep over whether this prediction will look bad in a few years.
Andrew Luck (32 career starts): Career RANY/A of -0.06.
Since starting this site, Luck has been one of the quarterbacks I’ve profiled the most. He wins without much help and is an ESPN QBR star, but he’s below average in ANY/A. I’m inclined to grade Luck on a curve — after all, the Colts team he inherited didn’t look any better than the ’70 Steelers or ’89 Cowboys or ’87 Bucs. On the other hand, Reggie Wayne and T.Y. Hilton have given Luck some excellent targets, which has probably been enough to boost his ANY/A to league-average proportions.
Perhaps the best comparison will be to another quarterback drafted first overall by the Colts who had a magical history of producing comebacks: John Elway. In any event, Luck’s already a franchise quarterback.

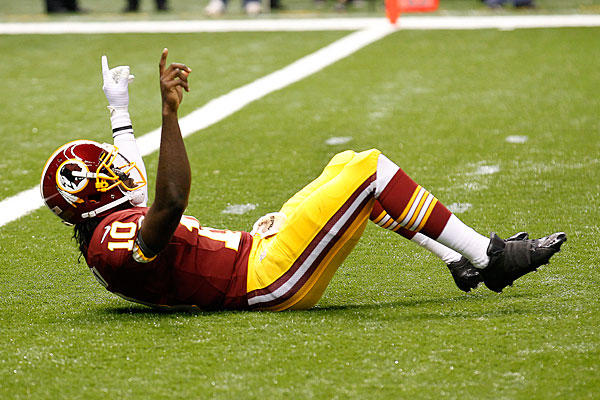
Can RG3 get up from a disastrous 2013?
Griffin’s career RANY/A is like measuring the temperature of a person with a foot in the freezer and a foot in a frying pan. As a rookie, he had a RANY/A of +1.5; last year, it was -0.4, and that number doesn’t begin to explain how ugly things were in D.C. The simplest explanation is that Griffin is a franchise quarterback who struggled last year as he recovered from ACL surgery and dealt with an ego-maniacal head coach. But it’s hard to just assume Griffin is a franchise quarterback after 2013. If Griffin one day turns into a Hall of Famer, we’ll remember that it was obvious from the start, as he had one of the greatest rookie seasons ever. If he flames out, the first chapter of that book has already been written, too.
Blaine Gabbert (27 career starts): Career RANY/A of -2.15.
Spoiler alert: Gabbert is not a franchise quarterback. He started at -2.2 RANY/A as a rookie on a team not dissimilar from the ’89 Cowboys; he’s followed that up, however, with a -1.2 RANY/A in 2012 and a -4.7 RANY/A over three starts last year. Suffice it to say if Gabbert turns into a franchise quarterback, it will have taken the greatest reclamation project in NFL history.
Colin Kaepernick (23 career starts): Career RANY/A of +1.06.
Kaepernick was mind-bogglingly efficient in 2012, producing a +1.6 RANY/A over 13 games and seven starts. That number dropped to +0.8 RANY/A last year, but much of that is due to the loss of Michael Crabtree. With an all-star crew of receivers set to take the field in 2014, I expect another very strong year out of Kaepernick. He may not be a finished product, but he already has the label (and contract) of a franchise quarterback.
Jake Locker (18 career starts): Career RANY/A of -0.25.
Maybe it’s because I’m a college football guy, too, but doesn’t it feel like Locker has already been around forever? I can’t believe he only has 18 career starts. And his RANY/A is nearly league-average, even if it doesn’t feel like Locker has been even that good. I was not a fan of him as a prospect, but he has been better than I feared. While we shouldn’t compare Locker’s first 18 starts to those of a quarterback who started immediately, I think Locker has shown enough that you can’t just write him off just yet. On the other hand, his numbers last year were a bit inflated by one of the NFL’s easiest schedules. Like Tannehill, this is the crucial season for Locker, who also carries with him the injury prone label. But if Locker can stay healthy and produce strong numbers, Ken Whisenhunt may prove that he really is a quarterback whisperer (to the extent he’s not whispering to someone named Skelton, or Kolb, or Anderson, or Leinart, or Lindley, or Hall….)
Nick Foles (16 career starts): Career RANY/A of +1.45
Foles had a rookie RANY/A of -0.8 before posting an absurd +3.3 RANY/A in 2013. Even the bigger Eagles homer would admit that much of Foles’ success was due to good fortune, the presence of Chip Kelly, or both. Foles may not have arrived just yet as a franchise quarterback, but if he turns into one, nobody will ever question when we first saw a glimpse of that ability.
Geno Smith (16 career starts): Career RANY/A of -1.70.
Smith was bad — really bad — for long stretches as a rookie. But he finished the season well, and terrible rookie numbers on a talent-deficient offense are not the death knell for a quarterback’s career. The Jets need to see a lot more from him this year, though, and he’ll need to produce roughly league-average numbers to make the Jets think he’s not just another Mark Sanchez.
Mike Glennon (13 career starts): Career RANY/A of -0.9.
Glennon had a very different rookie campaign than Smith, but the acquisition of Josh McCown sends Glennon to the bench, at least for now. We don’t know how he’ll fare in (or when he’ll see) his next three starts, but Glennon’s performance through 16 starts likely won’t be enough to write him off.
EJ Manuel (10 career starts): Career RANY/A of -1.0.
Manuel had a rough rookie year, especially when you consider how much worse he looked than Thaddeus Lewis. On the other hand, ten starts of bad (but not horrendous) play certainly isn’t enough to write off Manuel, not when Smith was worse for a longer stretch. Still, as with Smith, this is a big year for Manuel, especially after the team went out and acquired Clemson’s Sammy Watkins.