by Chase Stuart
on July 10, 2018
A couple of months ago, I asked this question on Twitter:
Do you know the answer? I’ll give you a couple of moments to think about it. First, a graph showing the 200 players with the most pass attempts in NFL history (all have at least 1,325 attempts). On the X-Axis is completion percentage; on the Y-Axis is Yards per Completion. There are no era adjustments here, which can also make it kind of fun: over time, completion percentages have skyrocketed, while the average yardage gained per completion has decreased. As a result, a player with a very high yards per completion percentage almost certainly played long ago, and therefore has a low completion percentage (and vice versa). Take a look: [continue reading…]
Tagged as:
Completion Percentage,
Yards per Completion
{ }
by Chase Stuart
on July 26, 2014
In 2013, the average completion went for 11.63 yards. That’s a pretty low number historically, although it’s actually a bit higher than some of the recent NFL seasons. Take a look at how Yards per Completion has generally been declining throughout NFL history:

If you want to discuss the quarterbacks who excelled in this metric, controlling for era is crucial. One simple way to measure the best passers when it comes to YPC is to measure how they fare in this metric relative to league average, and multiply that difference by the player’s number of attempts. For example, Nick Foles averaged 14.2 YPC last year, which was 2.6 YPC above average. Over the course of his 317 pass attempts, we could say he provided 529 yards above the average completion. That was the highest in the NFL last year, while Matt Ryan produced the lowest average. [continue reading…]
Tagged as:
Yards per Completion
{ }
by Chase Stuart
on December 1, 2013
You probably didn’t know it, but Cam Newton is having a down year, at least statistically.
| Year |
GS |
Cmp |
Att |
Cmp% |
Yds |
TD |
TD% |
Int |
Int% |
Y/A |
AY/A |
Y/C |
Y/G |
Sk |
Yds |
NY/A |
ANY/A |
Sk% |
| 2011 |
16 |
310 |
517 |
60.0 |
4051 |
21 |
4.1 |
17 |
3.3 |
7.8 |
7.2 |
13.1 |
253.2 |
35 |
260 |
6.87 |
6.24 |
6.3 |
| 2012 |
16 |
280 |
485 |
57.7 |
3869 |
19 |
3.9 |
12 |
2.5 |
8.0 |
7.6 |
13.8 |
241.8 |
36 |
244 |
6.96 |
6.65 |
6.9 |
| 2013 |
11 |
208 |
337 |
61.7 |
2353 |
17 |
5.0 |
9 |
2.7 |
7.0 |
6.8 |
11.3 |
213.9 |
31 |
235 |
5.76 |
5.58 |
8.4 |
Carolina’s defense has been outstanding, of course, so an 8-3 record and a seven-game winning streak have overshadowed any flaws in Newton’s game. The Panthers have held an average lead of 5.05 points per second this year, the third best rate in the league. As a result of that high Game Script, Newton is asked to do less on offense, but that doesn’t explain the declining efficiency numbers. Newton’s taking slightly more sacks and his rushing numbers are down across the board, but the biggest decline comes with respect to yards per completion.
[continue reading…]
Tagged as:
Cam Newton,
Panthers,
Steve Smith,
Targets,
Yards per Completion
{ }
by Chase Stuart
on September 29, 2013
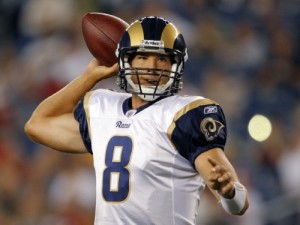
Bradford looks to check down.
As a rookie,
Sam Bradford ranked last in the league in yards per completion. That year, he averaged 9.92 YPC, 1.61 yards per completion lower than the league average of 11.53. In his second and third years — 2011 and 2012 — Bradford was a little better in that metric, but he still finished 0.65 and 0.34 yards per completion below league average in those seasons. So far in 2013, Bradford has earned his reputation as a checkdown artist: with a 10.21 YPC average, he’s averaged 1.43 fewer yards per completion than the average quarterback.
If you take a weighted average (based on his number of completions in each season), Bradford has been 0.98 yards per completion below league average over the course of his 980 career completed passes. In August, I noted that the Rams have experienced constant turnover at offensive coordinator and wide receiver since Bradford entered the league. This year, with Tavon Austin, Jared Cook, and developing talents like Chris Givens, expectations were high for Bradford. So far, we’ve seen more of the same from Bradford, which means lots of checkdowns and few big plays.
For his career, Bradford has averaged just 10.68 yards per completion. The table below shows the 164 quarterbacks since 1950 to complete at least 850 passes. The far right column represents the difference between each quarterback’s career yards per completion average minus the league average (calculated on a weighted-average basis for each quarterback based on his number of completions in each season) rate. As it turns out, Bradford ranks in the “top five” when it comes to the worst era-adjusted yards per completion averages.
[continue reading…]
Tagged as:
Rams,
Sam Bradford,
Yards per Completion
{ }

