≡ Menu

Longest Streaks Without Allowing a 100-Yard Rusher

Taylor was a Rams killer

Taylor was a Rams killer.

Last year, I looked at the longest streaks by teams without producing a 100-yard rusher. Today, the reverse: the run defenses that didn’t allow any opposing backs to hit the century mark week after week, year after year (note: all streaks are regular season only, unless otherwise specified). Two teams have gone 50+ straight games without allowing an opposing player to hit 100 rushing yards, and neither defense will surprise you.

The Fearsome Foursome Rams of Merlin Olsen and Deacon Jones fame went 51 straight weeks without allowing a 100-yard rusher. In the final week of the 1964 season, Jim Taylor rushed 17 times for 165 yards against the Rams (he also picked up 56 receiving yards). Over the next three years, no opponent rushed for over 100 yards against Los Angeles. That held true for the first nine weeks of the 1968 season, too, until San Francisco’s Ken Willard broke that mark with a 128-yard performance. That was the only time from 1965 through 1968 that the Rams allowed a 100-yard rusher. Incredibly, there was a stretch of 93 games where the Rams allowed a 100-yard back just five times… and three of them came at the feet of Jim Taylor! [1]In addition to Willard, Baltimore’s Tom Matte also accomplished that feat. And Matte did put up a 99-yard performance in 1965 against LA, too. By 1969, the Rams were positively pedestrian … Continue reading

In 1989, Gerald Riggs, then with Washington, rushed for an incredible 221 yards yards in week two against Philadelphia. That was noteworthy, because for the next 53 games, no opponent rushed for 100 yards against Reggie White, Jerome Brown, and the Philadelphia Eagles defense. We know how dominant the 1991 defense was, but the rush defense was pretty stringy in the surrounding years, too. It wasn’t until Emmitt Smith broke through with a 30-carry, 163-yard day in November 1992 that the streak was snapped. [continue reading…]

References

References
1 In addition to Willard, Baltimore’s Tom Matte also accomplished that feat. And Matte did put up a 99-yard performance in 1965 against LA, too. By 1969, the Rams were positively pedestrian against the run by their standards, allowing both Gale Sayers and Tom Woodeshick to hit the 100-yard mark. Then nobody did it again for 27 games.
{ 11 comments }

Declining Running Back Value in the Draft

A first round pick in '08, an afterthought in '14

A first round pick in '08, an afterthought in '14.

Running backs had a very rough time on the open market this year. To be fair, other than perhaps Chris Johnson, the market was full of question marks, platoon guys, or second stringers. And while players like Johnson and Maurice Jones-Drew were big names, they were devalued because of the “tread on their tires.” After all, we have been told time and time again that running back is a young man’s game, and that’s mostly true.  But one might argue that college running backs should be viewed as substitutes for veteran running backs. If teams are spending less capital on veteran running backs, they would start spending more capital on college running backs.

Except that’s not the case. It appears as though veteran running backs and college running backs are like Coke and Pepsi at a time when a lot of consumers have decided to stop drinking soda. In 2013, for the first time since 1963, no running back was selected in the first round of the draft. The top back off the board was Giovani Bernard at 37, the longest a draft had ever gone without hearing a running back’s name called. That was until this year, when the first 53 picks came and went without a single running back being selected. Bishop Sankey was the first back off the board to Tennessee with the 54th pick, although Jeremy Hill, and Carlos Hyde were drafted with two of the next three picks.

You’ve heard a lot about how running backs are being devalued in the draft. By nature, I’m a bit of a contrarian, but even I can’t spin this graph, which shows the percentage of draft capital spent on running backs in each NFL draft since 1950: [continue reading…]

{ 6 comments }

Interesting tidbit from Peter King this week about how the Vikings nearly acquired Johnny Manziel:

As the picks went by, starting soon after the Rams chose at 13, Cleveland GM Ray Farmer worked the phones, trying to find a partner to move up from their second pick in the round (26th overall) to grab Manziel. He couldn’t find a fit. Finally, with less than three minutes to go in Philadelphia’s 22nd slot, Farmer heard this from an Eagles representative over the phone: “If you’re not gonna jump in here, we’re gonna trade the pick right now.” It’s cloudy what his offer had been to this point, but now he had to sweeten it, and he offered the 83rd pick overall, a third-rounder, in addition to their pick four slots lower than Philly. Done deal. The Eagles liked that offer better than an offer from Minnesota, because the Vikings would have been moving up from 40.

As discussed in my round 1 recap, the Eagles made out like bandits picking up the 83rd pick to move down four spots. Not only did Philadelphia received 137 cents on the dollar according to my trade chart, but the Jimmy Johnson trade chart — which overvalues high picks and therefore cautions against trading down — had the Eagles receiving 112 cents on the dollar. [continue reading…]

{ 2 comments }

Four First Round Defensive Linemen

The St. Louis Rams may have had the best defensive line in football in 2013. At defensive end, the Rams had two stars in Robert Quinn (the Defensive Player of the Year) and Chris Long (who has recorded 33 sacks over the past three years). As part of the RG3 trade, St. Louis traded down in the first round of the 2012 draft and wound up selecting defensive tackle Michael Brockers, who had a breakout sophomore season. The other defensive tackle spot was manned by Kendall Langford, a solid if unremarkable 28-year-old player. That defensive line helped St. Louis record a sack on 9.2% of all pass plays in 2013, the second highest rate in the NFL (behind Carolina).

Then, the Rams drafted a defensive tackle in the first round of the 2014 Draft. And not just any defensive tackle, but Pittsburgh’s Aaron Donald, the combine superstar who led the nation in tackles for losses last year. Assuming Donald replaces Langford in the lineup, that gives the Rams for first round picks on the defensive line, which brings us to the first trivia question of the day.

Can you name the last team to have four different defensive linemen who were drafted in the first round start 8+ games in a season? [continue reading…]

{ 2 comments }

Best and Worst Drafts since 1970

Not all drafts are created equal. The 2014 NFL Draft was said to be very rich in talent, while last year’s iteration was considered relatively weak. We don’t have much data on which drafts scouts have labeled as “good” or “bad”, but I thought it might be fun to see which drafts have turned out to be the best and worst.

To do this, I looked at every draft from 1970 to 2008. Since there were only 222 picks in the 1994 draft, I looked at only the top 222 drafts in each of these drafts. The formula I used to measure each draft was pretty simple: use PFR’s Approximate Value grades to produce a value for each player, and then sum the values for each of the top 222 picks in each draft. More recent drafts will obviously be disadvantaged by this formula, since AV is a counting metric, which means the 2008, 2007, 2006, etc., drafts will look stronger in a few years. Regardless, take a look:

best worst drafts [continue reading…]

{ 3 comments }

Who is the Best Backup Quarterback Ever?

That's a pretty good backup.

That's a pretty good backup.

Determining the best backup quarterback ever is really complicated. Steve Young and Aaron Rodgers backed up Joe Montana and Brett Favre, respectively, but neither Young nor Rodgers morally feel like they belong in the discussion of best backup quarterbacks.

There are a couple of ways to measure how a backup quarterback fares. One way is on a game-by-game approach: i.e., the starter gets injured or pulled, and now the backup is in charge. That’s the sort of thing Frank Reich, at least anecdotally, excelled at. [1]Post for another day (or another author): Which quarterbacks were the best off the bench? The more interesting, and easier question to analyze, is to take a season-by-season approach. If a quarterback does not start his team’s season opener, he’s a backup. If he does, he’s not.

Using that concept, the name that immediately jumps to mind is Earl Morrall.  After all, he led two teams to Super Bowls during seasons that began with him on the bench. But what do the numbers say?

Ironically, my proposed definition excludes what is undoubtedly the greatest season in backup quarterback history: Kurt Warner in 1999. That season may have been a top-three season in quarterback history, but it began with Warner second on the depth chart to Trent Green. When Rodney Harrison ended Green’s season in the preseason, Warner become the starter, which would exclude his ’99 season from this analysis.

And, uh, ironically again, Morrall’s best season is excluded, too.  His top year was in 1968 when he won the NFL MVP, but since Johnny Unitas was injured in the preseason, Morrall isn’t labeled a backup by this formula, either. But I do think that the Warner and Morrall examples are rare enough that we can proceed with minimal concern. [continue reading…]

References

References
1 Post for another day (or another author): Which quarterbacks were the best off the bench?
{ 12 comments }

Will Blake Bortles be the Best QB of the 2014 Class?

A rare shot of Blake Bortles in a two-tone helmet.

A rare shot of Blake Bortles in a two-tone helmet.

The Jaguars drafted Blake Bortles with the 3rd pick in the 2014 draft. Nineteen picks later, the Browns took Johnny Manziel, and with the 32nd pick, the Vikings traded up to acquire Teddy Bridgewater.

If you believe in the efficient market theory, this means Bortles is the most likely of that group to wind up being the top quarterback from this year’s draft. But I wanted to look at other drafts where the top quarterback was selected very early but the next quarterback wasn’t drafted in quick succession (like say, Andrew Luck and RG3).

Since 1967, the first year of the common draft, a quarterback was selected in the top 6 [1]Why the top 6 and not the top 5? Only once was the top quarterback drafted with the fifth overall pick, but in three other drafts prior to 2014, the first quarterback went off the board at number six … Continue reading in 34 of 48 drafts. But in 22 of those 34 drafts, another team spent a top-12 pick on a quarterback, too. [2]Why top 12? In none of these drafts was the 2nd quarterback selected with the 13th, 14th, 15th, 16th, or 17th picks, which made 12 seem like a good cut-off.

That leaves 12 drafts where (a) a quarterback was drafted really, really early, and (b) no other quarterback went off the board for awhile (at least 14 picks between the quarterback selections in all 12 cases). Some further slicing, however, is required if we really want to do an apples-to-apples comparison. In six of those cases, a quarterback was selected with the number one overall pick, and based on research conducted by Jason Lisk, it doesn’t seem appropriate to compare quarterbacks not selected with the top pick to number one overall selections. [3]In reality, the number one picks in this sample were pretty underwhelming: Sam Bradford, JaMarcus Russell, Alex Smith, Michael Vick, Troy Aikman, and Steve Bartkowski are the six quarterbacks who … Continue reading I’d also throw out the 1973, 1976, and 1981 drafts, as the number two quarterbacks were all drafted after pick 30. [continue reading…]

References

References
1 Why the top 6 and not the top 5? Only once was the top quarterback drafted with the fifth overall pick, but in three other drafts prior to 2014, the first quarterback went off the board at number six (and never was the first passer selected at seven, eight, nine, or ten). Plus, since the Jaguars were rumored to be considering a trade down to #6 to draft Bortles, it seemed to make sense to use 6 as a cut-off.
2 Why top 12? In none of these drafts was the 2nd quarterback selected with the 13th, 14th, 15th, 16th, or 17th picks, which made 12 seem like a good cut-off.
3 In reality, the number one picks in this sample were pretty underwhelming: Sam Bradford, JaMarcus Russell, Alex Smith, Michael Vick, Troy Aikman, and Steve Bartkowski are the six quarterbacks who would have otherwise made the cut-off.
{ 6 comments }

College Observations from the 2014 Draft

Messing with Texas

By now, you’ve probably heard that no player from the University of Texas was drafted. Jackson Jeffcoat was the Big 12 co-Defensive Player of the Year, but that honor wasn’t enough to enable him to hear his named called on any of the three draft days. [1]as Bill Barnwell points out, Jeffcoat’s tumble provided a good counter to those arguing that Michael Sam was going to go undrafted despite being the SEC co-Defensive Player of the Year solely … Continue reading The draft was first instituted in 1936, and not since 1937 had an NFL draft has been Longhorn-free.  From 2000 to 2013, players selected from the University of Texas were, in the aggregate, responsible for about 37 points of value per season using the values from my pick value chart.  That’s the 10th most of any school during that period, behind only Miami (FL) (51), Southern Cal (49), Florida State (42), LSU (39), Ohio State (39), Georgia (39), Alabama (38), and Florida (38). But UT wasn’t the only school that had a rough weekend:

  • Illinois, which ranked 37th in draft value from 2000 to 2013 (14 points), was the next highest-ranked school after Texas to get shut out of the 2014 draft.  Hawaii (53rd), Rutgers (59th), and Cincinnati (66th) were other top-70 programs from ’00 to ’13 that did not have a player selected this year. A couple of other schools from power conferences — Northwestern and Kansas — were also left out in the cold.
  • For Texas and Illinois, injury was added to insult. No only were no Longhorns drafted, but three Aggies — Jake Matthews, Mike Evans, and Johnny Manziel – went in the first round, while TCU had a first round pick (Jason Verrett), Texas Tech had a second round pick (Jace Amaro) and Baylor had five players drafted.  No Illini went in the draft, but Northern Illinois had two players (including 1st round safety Jimmie Ward), Eastern Illinois had a second round pick (Jimmy Garoppolo) and even Illinois State had a player selected (Shelby Harris in the 7th round).
  • It was also a rough draft for a few other schools. Miami normally dominates the draft, but only three Hurricanes were selected: two offensive lineman and a punter.  Brandon Linder was drafted 93rd overall to Jacksonville, followed by Pat O’Donnell to Chicago at 191 and Seantrel Henderson to the Bills at 237.
  • The Georgia Bulldogs had just two players drafted, both in the fifth round: quarterback Aaron Murray and tight end Arthur Lynch.
  • Sooners fans probably want to gloat over Texas, but this was a pretty ugly year for Oklahoma, too.  The school’s highest-drafted player was Jalen Saunders at 104. That marks the first time since 1997 that no Sooner was drafted in the top 100 picks.

Small Schools Making Draft History

There were four players who came from schools that haven’t had a single player drafted in the last 20 years.

  • At pick 198, New England took defensive end Zach Moore out of Concordia University in St. Paul, Minnesota. He’s not only the first player ever drafted from the school, but no player from the Division 2 program has ever made it to the NFL. Last year, Concordia only ranked as the 26th best football team in Division 2 through 13 weeks (by reference, Pittsburgh State ranked 8th).
  • Finally, Terrence Fede out of Marist was drafted by the Dolphins with the 234th pick. Fede, like Desir and Moore, made history by becoming the first player ever drafted out of his school. Marist, located in New York state, plays in the Pioneer Football League, but ranked as just the 70th best FCS school last year.

The Crimson Tide Reign is Over

For three straight years, more draft capital was spent on Alabama players than those from any other school. The reign is over, as Alabama tumbled all the way down to … fourth place. Texas A&M led the way: while only three Aggies were selected, they were drafted high enough to make College Station the most valuable town for the 2014 draft with 60.3 points of value. Next up was LSU (57.0), which also led the way with 9 players drafted (but only one in the top 50). In third place was Notre Dame (54.7 points, 8 players drafted, three in the top 75), followed by Alabama (54.3, 8 players), Florida State (54.2, 7 players), Auburn (52.4, 4), Louisville (49.9, 4), and Ohio State (49.8, 6).

Texas A&M, Louisville, and Notre Dame had excellent drafts especially by their standards: none of the three ranked in the top 20 from ’00 to ’13 in draft value provided (the Fighting Irish were 21st, the Aggies were 24th, and the Cardinals were down at #50).  Other schools that had comparably big years: UCLA, Auburn, Buffalo, Central Florida, South Carolina, and Clemson. Okay, in the case of UCF it was just because of Blake Bortles (running back Storm Johnson, at pick 222, was the only other Knight drafted) and for Buffalo it was Khalil Mack and done. But still, neither program had ever had a player drafted in the top ten before, so a top-five pick is a pretty remarkable accomplishment.

References

References
1 as Bill Barnwell points out, Jeffcoat’s tumble provided a good counter to those arguing that Michael Sam was going to go undrafted despite being the SEC co-Defensive Player of the Year solely because he was openly gay.  As it turns out, being co-DPOY isn’t worth as much as you might think.  Jeffcoat landed with the Seahawks, though, so he and Sam will both get a chance to prove their mettle in the NFL’s toughest division.
{ 3 comments }

The NFL Draft and the Wisdom of Crowds

[Chase note: Take a look at the name at the top of this post. Our good friend Andrew continues to desire to post here, and we thank him for that.]

Not the focus of Galton's experiment.

Not the focus of Galton's experiment.

In 1906, Sir Francis Galton probably wasn’t thinking about the NFL draft when he asked almost 800 fair goers to guess the weight of an ox. No one person accurately guessed its weight, and the guesses were all over the map, but the mean of all the guesses (1197 lbs) was within one pound of the actual weight of the ox. As I looked through endless mock drafts leading up to last Thursday night, I wondered if there was anything to be gained by looking at the wisdom of the crowds. Could we do a better job of predicting the NFL draft if we took all the knowledge and tried to put it together?

And the answer appears to be yes… to an extent. The NFL draft is not exactly a place where we’d expect the wisdom of crowds to be particularly strong. The power of the wisdom of crowds comes from lots of people bringing their own independent information to the table. For example, prediction markets appear to do a great job of predicting events like a president’s chances of being reelected. Sports prediction markets (a.k.a sportsbooks) similarly succeed in predicting game outcomes. And the stock market often reveals companies’ true values. In each case, every individual transaction represents a piece of information which gets reflected in the price.

Of course, the crowd is not always so wise. Stock markets can go haywire. Betting lines can be affected by people’s biases. The wisdom of crowds can break down when groupthink occurs and people stop having independent opinions. The NFL draft certainly looks like such a case. All the mock drafts are out there and the experts have the implicit pressure to not be too different. [1]In some cases, there may be incentives to stand out from the crowd with an original prediction, too. Overall, there are incentives that can make predictions depend on those made by others. In those circumstances, we could lose in a haze of groupthink much of the original information that people have. [continue reading…]

References

References
1 In some cases, there may be incentives to stand out from the crowd with an original prediction, too. Overall, there are incentives that can make predictions depend on those made by others.
{ 9 comments }

Analyzing Position Values In the 2014 Drafts

The 2014 NFL Draft is in the books. The three-day event gives us a unique peek behind the NFL curtain; teams can and do say all sorts of ridiculous things, but the way the draft unfolds is the ultimate in what economists refer to as a revealed preference. For example, NFL decision makers might say that running and stopping the run is the key to winning football games (particularly likely if those decision makers reside in Indianapolis), but the NFL draft revealed that no team preferred to spend a top-50 pick on a running back. Only one pure inside linebacker was drafted in the first two rounds (Alabama’s C.J. Mosley), and only two more (Louisville’s Preston Brown and Wisconsin’s Chris Borland) were selected with picks in the top 125.

As regular readers know, I’ve created a draft value chart based on the expected marginal Approximate Value produced by each draftee in his first five seasons to the team that drafted him. By assigning each draft pick a number of expected points, we can then calculate how much draft capital was spent on each position. I went through the 2014 draft (using the position designations from Pro-Football-Reference) and calculated how much value was used on each position; the results are displayed in the table below. [1]I’m excluding fullbacks and specialists from this definition. For purposes of this study, the three fullbacks drafted, Auburn’s Jay Prosch (HOU), Oklahoma’s Trey Millard (SF), and … Continue reading

[visualizer id=”19720″] [continue reading…]

References

References
1 I’m excluding fullbacks and specialists from this definition. For purposes of this study, the three fullbacks drafted, Auburn’s Jay Prosch (HOU), Oklahoma’s Trey Millard (SF), and Arkansas’ Kiero Small (SEA), were included as running backs. For those curious two kickers — Arkansas’ Zach Hocker (WAS) and Boston College’s Nate Freese (DET) — and one punter (Miami(FL)’s Pat O’Donnell (CHI) were also drafted.
{ 10 comments }

In the first round of the 2014 draft, five cornerbacks were selected:

  • the Browns traded up from 9 to 8 to ensure that Oklahoma State’s Justin Gilbert would be coming to Cleveland;
  • at 14, the Bears drafted Virginia Tech corner Kyle Fuller;
  • at 24 and 25, the Bengals and Chargers took Darqueze Dennard (Michigan State) and Jason Verrett (TCU), respectively;
  • the Broncos, perhaps still reeling from the Legion of Boom’s Super Bowl performance, took Ohio State cornerback Bradley Roby with the 31st pick

In addition, four safeties were drafted in round 1:

That’s nine defensive backs in the first round.  At one point, we saw a string of 7 defensive backs taken in 14 picks at the back end of the round. This was the first time in NFL draft history that nine defensive backs went in the first 32 picks. So this is the new normal and the NFL is now a crazy passing league, right? [continue reading…]

{ 1 comment }

The action got started on day two even before the round began. Buffalo, after giving up next year’s first and fourth round picks to move up to acquire Sammy Watkins, responded by trading Steve Johnson to the 49ers on Friday afternoon.  Buffalo was able to at least get back a 2015 4th round pick from the 49ers, which could become a 3rd rounder depending on Johnson’s performance this season.  This gives Colin Kaepernick another weapon in a contract year, and it provides some short-term insurance (if Father Time outraces Anquan Boldin) and long-term insurance (Michael Crabtree is a free agent after the season) at the position.

The trades in rounds 2 and 3 weren’t very exciting, and they followed a very predictable formula: the team trading down won according to my draft value chart. The fact that my metrics said every team overpaid when trading up does not mean my metrics are wrong; my grades, in addition to being objective, are designed to be aspirational, not predictive.  These ratings tell us the actual value provided by players based on historical results. In reality, teams fall in love with a player — and are overconfident in their abilities to scout — and as a result, are willing to lose value when trading up.

My chart recognizes that the right to choose between a mid-2nd and a mid-3rd round pick is not that significant; to a decision maker who believes his scouting skills descended from the heavens, that right to choose is really, really important. Of course, the data suggests otherwise. That said, let’s take a look at what happened on Friday night using my chart and the JJ Trade Value Chart.

1) Washington trades the 34th pick to Dallas for the 47th and 78th picks

According to my chart, this was an amazing trade for Washington, who received 140 cents on the dollar.  Even the JJ chart thinks Washington picked up 112.5 cents on the dollar. Picking up an extra 3rd round pick to move down 13 spots was a very nice haul.

The Cowboys traded up for Boise State defensive end Demarcus Lawrence. Dallas was worried the Falcons would take him and apparently viewed him as the clear best RDE available. That’s fine, but the Cowboys gave up two important picks to secure his rights.

2) Seattle trades the 40th and 146th pick to Detroit for the 45th (2nd), 111 (4th), and 227th (7th).

My chart liked the the Seahawks side of the deal, as Seattle picked up a 107.5 cents on the dollar.  The JJ chart, on the other hand, thinks Detroit got the slightly better deal , giving up 524 points of value for 533 points.

The Lions traded up for BYU outside linebacker Kyle Van Noy. This is the rare trade up I’ll approve, because well, I watched the 2012 Poinsettia Bowl.

In all, Van Noy made 7.5 disruptive plays in the box score: 3.5 tackles for loss (1.5 sacks), a forced fumble (which he recovered for a touchdown), an interception he returned for a touchdown and a blocked punt.

Van Noy single-handedly scored more points than the BYU offense and accounted for two of BYU’s five takeaways.

Van Noy may not be a great NFL player, but he was an excellent college player and a fun one to watch. Rumor has it the Lions wanted Anthony Barr in the first round, but pairing Eric Ebron with Van Noy might wind up working out even better.

3) The Bills traded the 41st pick to St. Louis for the 44th and 153rd picks

As you might suspect, my chart thought this was a very smooth move for Buffalo, trading 11 points for 13 and receiving 118 cents on the dollar.  The JJ chart thought this trade was exactly even, trading 490 points for 490 points.

We know that Jeff Fisher loves his cornerbacks, and the Rams traded up for Florida State’s Lamarcus Joyner.  I’m not a slave to my own chart — I recognize that giving up a 5th round pick to ensure that you get your player can be worth it. But my chart recognizes that 5th round picks still have value, and there’s not much difference between the 41st and 44th picks. The Rams probably had a 1st round grade on Joyner and were willing to sacrifice the pick to get him, but the million dollar question is always why didn’t enough other teams have a first round grade on him?

4) Three picks in a row, three trades.  Tennessee sent the 42nd pick to Philadelphia for the 54th and 122nd selections.

My chart says the Titans got a nice deal, picking up 122 cents on the dollar.  Meanwhile, the JJ chart says the Eagles killed it on this trade, and Tennessee only picked up 85 cents on the dollar.   In retrospect, the Seahawks may have won their deal with Detroit, but they almost certainly could have done better than they did in their deal with the Lions. Seattle clearly got the worst deal of the three teams that traded down in the 40 to 42 range.

Philadelphia moved up for Vanderbilt wide receiver Jordan Matthews and paid the price. Matthews may not have made it to 54, so it’s easy to understand why the Eagles made the move. This trade was interesting because of the wildly disparate values on the two charts, but the 122nd pick is not a throwaway. Of course, the Eagles tend to manage the draft very well, so giving up the pick here is not so disheartening: Philadelphia got an extra pick in the Johnny Manziel trade, and didn’t even give up their own pick in the Darren Sproles trade (the Eagles used the pick they got from New England for Isaac Sopoaga).

5) Miami sends the 50th pick to San Diego for the 57th and 125th selections

The Chargers tossed a 4th round pick in to move up 7 spots.  That might sound okay, but Miami picked up 132 cents on the dollar in this deal. On the other hand, teams like San Diego are probably using the JJ chart, which says San Diego won this trade (Miami received 94 cents).

San Diego moved up for outside linebacker Jeremiah Attaochu. Presumably the Georgia Tech player was the last pass rusher in the Chargers’ top tier, but a 4th round pick is not pocket change. Like most 3-4 teams, the Chargers really want to add edge rushers. What separates San Diego from the rest is the amount of capital they keep throwing at the position with little results: Jarret Johnson, Dwight Freeney, Larry English, Melvin Ingram are all still on the roster.

6)

7)

The next two trades are best analyzed together.  San Francisco owned the 56th pick and sent it to Denver; moments later, the 49ers traded for Miami’s 57th pick.

Combined, San Francisco moved down from 56 to 57 and lost their 242nd pick; in return, the 49ers picked up Denver’s 2015 4th round pick. That’s just beautiful.

This year, Denver picks at 131 in the 4th round.  If we say the Broncos will be around there next year, and then apply a 20-spot discount for the time value of draft picks, that would put this at equal to the 151st pick this year.  That’s some fuzzy math, of course, but….

If we do that, San Francisco gave up 56 and 242 for 63, 171, and something equivalent to the 151st pick.  That means the 49ers robbed the Broncos, getting 143 cents on the dollar.  Unfortunately, some of that was then given up when San Francisco sent 63 and 171 for number 57.  In that deal, Miami received 113 cents on the dollar according to my chart.

Denver traded up for Indiana wide receiver Cody Latimer; San Francisco traded for Ohio State running back Carlos Hyde. Both players could turn into starts, and in general, I’m less disturbed by a trade up for skill position players. Then again, the Broncos have Demaryius Thomas, Wes Welker, Julius Thomas, and Emmanuel Sanders (not to mention Andre Caldwell and Jordan Norwood), while the 49ers have Frank Gore, Kendall Hunter, Marcus Lattimore. That doesn’t even include LaMichael James, who is probably going to be traded soon.

8) San Francisco gets back into the trading business, sending the 61st pick to Jacksonville for the 70th and 150th selections.

Trading down would seem to make more sense for say, Jacksonville than San Francisco, but what do I know.  As you’d expect, the 49ers won the deal, picking up 121 cents on the dollar.

The Jaguars traded up for Penn State wide receiver Allen Robinson.  If nothing else, I admire Jacksonville’s dedication to improve the passing game, using the team’s first three picks on Blake Bortles, Marqise Lee, and Robinson. The most important thing, of course, is hitting on the picks, but those players — combined with Cecil Shorts, Ace Sanders, Denard Robinson, and Toby Gerhart — could be part of a fun Jaguars offense in 2015 and 2016. Unfortunately, 2014 probably will look a lot like 2013 still.

9) Oakland sends the 67th pick to Miami for the 81st and 116th picks.

The Dolphins did a nice job adding value with a pair of trade downs earlier, but go the wrong way here.  The Raiders pick up 140 cents on the dollar.

The Dolphins traded up for Billy Turner, who is an offensive linemen from North Dakota State. That’s the extent of my scouting report.

If you’re a Miami fan and dismayed that your team traded up (and paid a pretty price to do so) for an FCS offensive linemen, well, over the three trades, I have Miami up 106 cents on the dollar (in total, the Dolphins sent 50/81/116 for 63/67/125/171).

10) Philadelphia trades the 83rd pick to Houston for the 101st and 141st picks

As you’ve come to see, the trading down teams tend to get the (much) better end of the bargain.  Here, the Eagles picked up 128 cents on the dollar. On the other hand, the Texans move up for Louis Nix III.  This move is okay by me: Nix was a first round pick on some boards, and is a monster nose tackle. Teams can probably neutralize him by double-teaming him, and double-teaming Jadeveon Clowney, and triple-teaming J.J. Watt and yeah I’m okay with what Houston did here.

11) New England trades the 93rd pick to Jacksonville for the 105th and 179th picks

The Patriots receive 116 cents on the dollar here. But again, shouldn’t New England be the team trading up and Jacksonville the one trading down?

12) In what was essentially a mirror of the last deal, San Francisco sent the 94th pick to Cleveland for the 106th and 180th picks.  Here, the 49ers received 112 cents on the dollar.

Jacksonville traded up for Miami (FL) guard Brandon Linder.  Cleveland traded for Towson running back Terrance West.

{ 9 comments }

Round 1 2014 NFL Draft Recap

Let’s get started! As always, I’ll be using my Draft Pick Value Calculator and the JJ Trade Value Calculator to analyze all trades (well, all trades except for one).

1. Houston Texans – Jadeveon Clowney, DE, South Carolina

Little drama at the top. Clowney’s been expected to be the first overall pick in the 2014 draft for about three years.  He’ll be joining J.J. Watt to create a scary front seven in Houston. The Texans need to do something to counter the Colts landing Andrew Luck, and this isn’t too bad of a plan.

2. St. Louis Rams – Greg Robinson, OT, Auburn

Not much of a surprise here, either, at least according to most mocks. Robinson is an incredible athlete and a dominant run blocker. The early word, though, is that he’ll play left guard right away, as Jake Long remains on the left side (Robinson could play the right side, but the Rams may be happy with Joe Barksdale).

3. Jacksonville Jaguars – Blake Bortles, QB, UCF

Surprise! I had the Jaguars taking a quarterback, but Bortles was the first real shock of the draft. That’s a risky move by the Jaguars: Bortles seems to have pretty high bust potential and this pick means the clock is now beginning to tick on the rebuilding project. [continue reading…]

{ 1 comment }

Colleges with the Best Drafts In Each Year

Half of the top four picks in the 2010 draft.

Half of the top four picks in the 2010 draft.

Thanks to the Football Perspective Draft Value Chart, we know the value of each pick in the draft. If we assign the draft value associated with each pick to the college of that player, then we can determine which school produced the most draft value in any given year.  For example, this year, Texas A&M could have three players selected in the top ten: Johnny Manziel, Jake Matthews, and Mike Evans.  In fact, I have the trio all going in the top 8 in my mock draft.

Only three times in the last 25 years has a school had three of its players go in the top ten. Four years ago, Oklahoma had three players go in the top four, with Sam Bradford, Gerald McCoy, and Trent Williams only interrupted by the Lions selection of Ndamukong Suh.  Nine years ago, Auburn running backs Ronnie Brown and Cadillac Williams went in the top five and cornerback Carlos Rogers was selected ninth overall. And in 1995, Penn State sent Ki-Jana Carter, Kerry Collins, and Kyle Brady to the NFL, although the Nittany Lions didn’t even have the best draft of any school that year.

But no school dominated a single draft quite like Notre Dame back in 1946. The Fighting Irish had three of the first five picks (including Jason’s boy, Johnny Lujack and Hall of Famer George Connor), and the 10th and 16th overall selections. And then seven more in the top 135! In more modern times, the Hurricanes’ 2004 class takes the cake.  That year, Miami had six of the top 21 picks (Sean Taylor (5), Kellen Winslow Jr. (6), Jonathan Vilma (12), D.J. Williams (17), Vernon Carey (19) and Vince Wilfork (21))! [continue reading…]

{ 1 comment }

Drafting Diamonds in the Rough

Guest blogger Andrew Healy, an economics professor at Loyola Marymount University, is back and the author of today’s post. As a reminder, there a tag at the site where you can find all of his great work.


Small school defender takes down big school quarterback

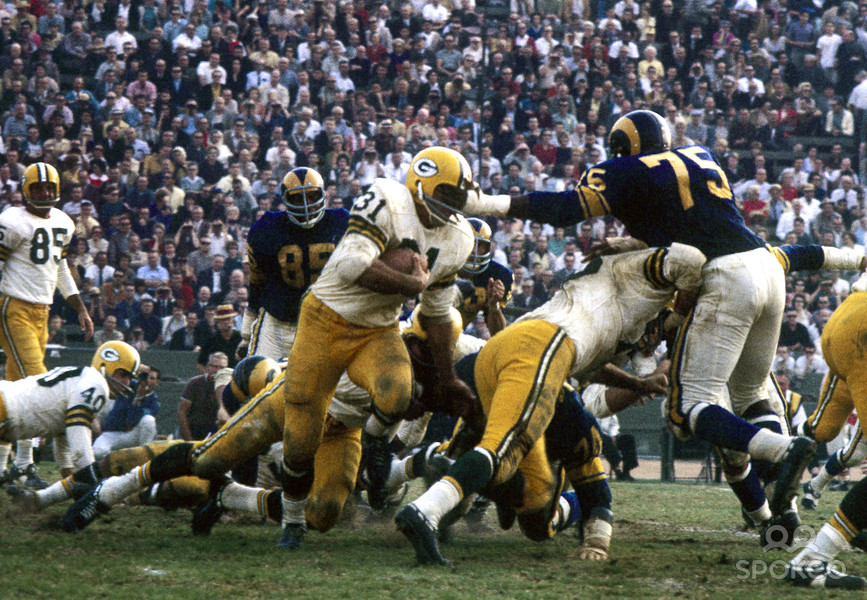
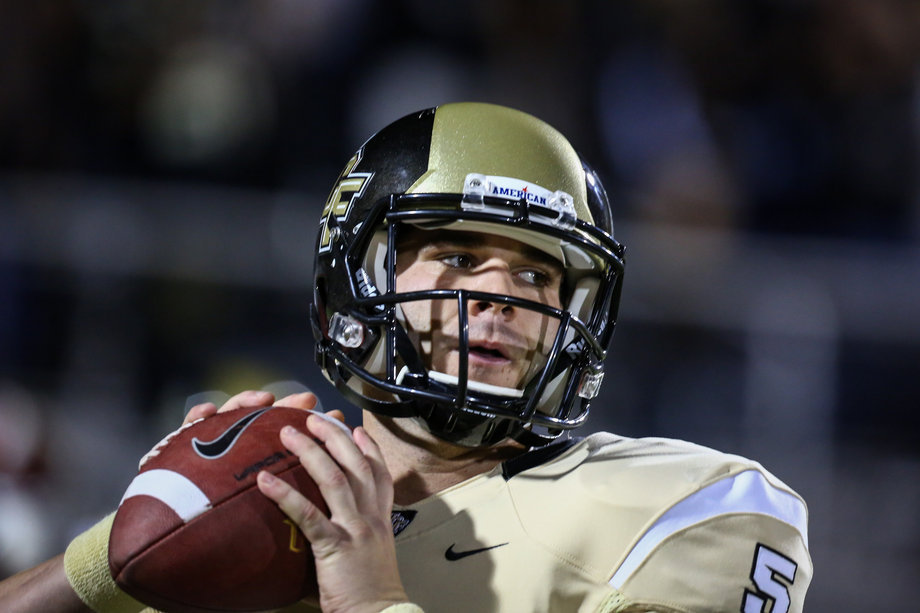
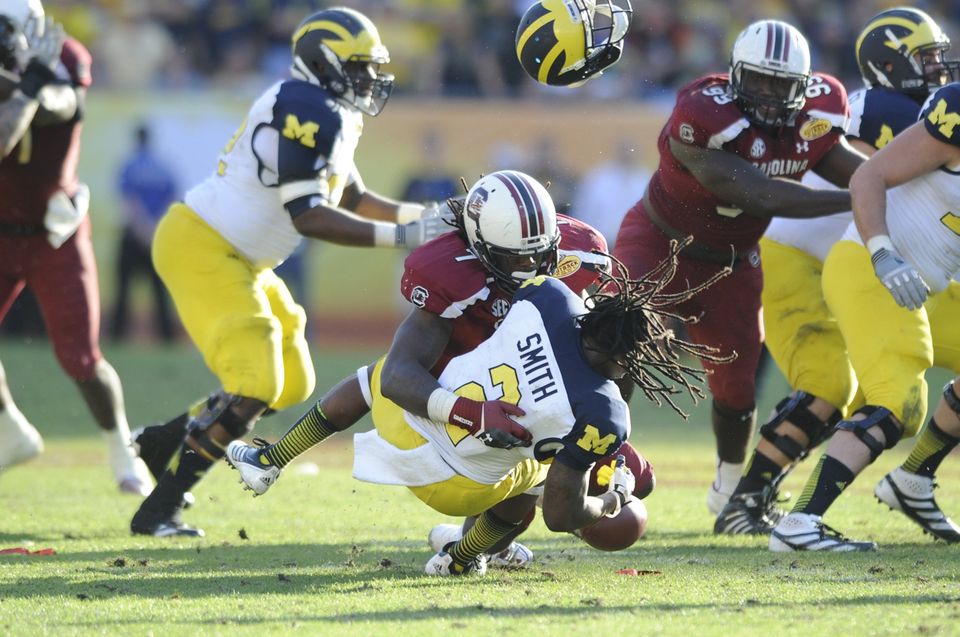
Small school defender takes down big school quarterback.

Asante Samuel. Jahri Evans. 
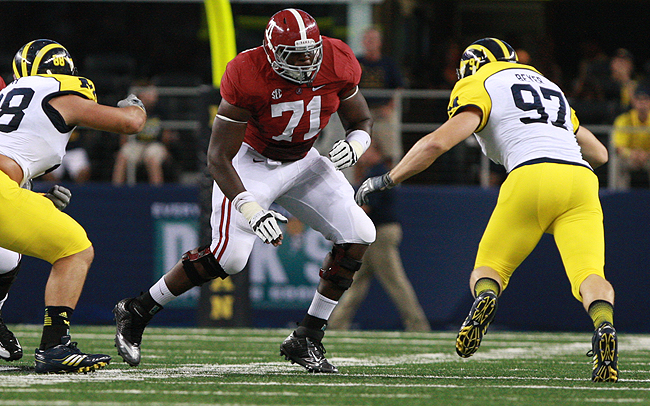
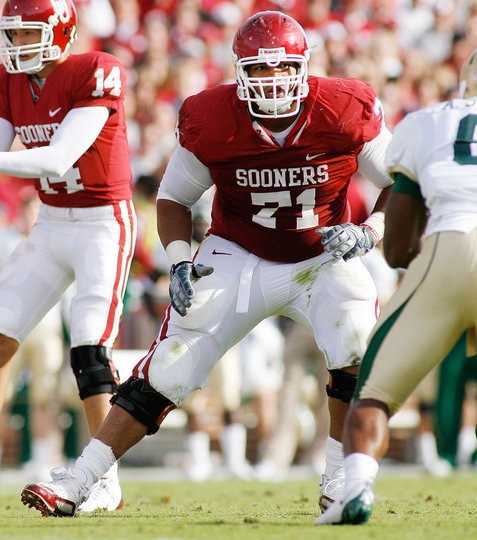
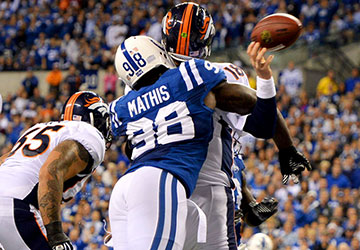
Robert Mathis. These three players share something in common that offers a hint to finding steals in the middle rounds of the draft. All three eventually made Pro Bowls. Each was drafted in Round 4 or later. And each played for a notable football powerhouse in college: Central Florida [1]In 2003, Central Florida went 3-9 in the MAC. While the Blake Bortles Knights may not be a football powerhouse, either, the 2013 UCF team that went 12-1 in the American Conference bears little … Continue reading, Bloomsburg, Alabama A&M.

The success of these smaller college players relative to their marquee school competitors turns out to be a much more general phenomenon. In the middle rounds of the NFL draft, players from outside the traditional power conferences have been more than twice as likely to eventually make the Pro Bowl as players from the most famous programs. On defense, small school players have been even more likely to make the Pro Bowl than their major school counterparts.

Let’s use the 2003 draft as an example. Only 5% (6 out of 116) of the major college players selected in round 4 or later eventually made it to a Pro Bowl. At the same time, 12% (6 out of 50) of small college players would eventually be selected for Hawaii. At the very least, if you were watching the draft and wanting to know what the chances are that your team drafted a future star, those chances increased in the middle of the draft when your team picked a player from a school like Bloomsburg than when it picked another player from the SEC.

In fact, it’s hard to think of anything else that can match the impact of simply picking small-school players as a way to find stars in the middle rounds. The data suggest that this logic has even applied at the top of the draft for comparisons such as those between Buffalo’s Khalil Mack and South Carolina’s Jadeveon Clowney. But the big gains from focusing on smaller football schools have come from finding the gems that the draft buzz mostly bypasses. Consistently, general managers have wasted picks on players from major conferences, missing chances to find difference-makers―particularly on defense―from schools such as Northern Colorado and Idaho State. [2]Bonus points for getting those players. Aaron Smith was a 4th round pick out of Northern Colorado in 1999 and Jared Allen was a 4th round pick out of Idaho State in 2004.

The Data

I look at all players drafted from 1998-2007, stopping at the later year to give players time to make a Pro Bowl. The measure of excellence is making a Pro Bowl, but I’ll also look at All-Pro selections. I ignore players listed at special teams positions (P, K, and KR), although it’s possible you could make a Pro Bowl as a special teamer after being drafted at an offensive or defensive position. I also did not include fullbacks because it became so easy to make the Pro Bowl at that spot.

Major conferences are defined according to the traditional BCS definitions: Big East/American, Big 10, Big 12, Pac 10, SEC, and ACC. Notre Dame is also included with these bigger (in terms of football) schools. A school such as Wake Forest gets defined as a big football school by this measure and it probably shouldn’t be, but adjustments from this definition would be judgment calls and so this simple rule seems best.

Note that almost none of the middle-round small-school Pro Bowlers during this time period come from schools such as Boise State that were big football schools at the time. The two possible exceptions are Brett Keisel of BYU (drafted in 2002) and Paul Soliai of Utah, who was drafted in 2007 before Utah joined the Pac-12.

Comparing Average Success Across Schools

Small school players get drafted later than big school players, so we need to control for draft position to get a fair comparison between them. Later, I’ll use regression to do that. Here, I’m just going to break down results according to ranges of draft position. The chance of making the Pro Bowl is much higher in the early parts of the draft, so I’ll break things down there according to selection number rather than just the round.

The table below looks at the first three rounds of the draft. Overall, the chances of drafting a Pro Bowler tend to be higher for small school players in the first three rounds. The small school samples are limited in the first round, but the share of small school players who make a Pro Bowl is higher throughout than for big schools. Out of all the rounds, the 2nd round is the only one where we see a small trend the other way.

Small schoolsBig schools
Round# of selections% Pro Bowlers# of selections% Pro Bowlers
1 (Pick 1-10)771.4%9355.9%
1 (Pick 11-20)850.0%9141.8%
1 (Pick 21-32)1145.5%9929.3%
2 (Pick 33-48)2623.1%13124.4%
2 (Pick 49-64)3511.4%11215.2%
38310.8%2449.0%

The largest differences, and the clearest benefit from drafting players from smaller schools, come in the middle rounds. The table below shows the differences in rounds 4-7. In round 4 over the ten-year period, teams have been about three times more likely to draft a Pro Bowler when picking from a small school rather than a big one. 12.9% of small school draftees in Round 4 have made the Pro Bowl, compared to just 4.1% of big school players.

Small schoolsBig schools
Round# of selections% Pro Bowlers# of selections% Pro Bowlers
49312.9%2474.1%
51088.3%2283.5%
61353.7%2203.6%
71572.6%2941.7%

In round 5, we see a similarly large difference. Round 5 players from small schools have been more than twice as likely as big school players to make a Pro Bowl. Altogether, across rounds 4 and 5, despite 475 non-special teams players being drafted from big schools, just 18 (3.8%) have made a Pro Bowl. On the other hand, out of just 201 players drafted in those rounds from small schools, 21 (10.5%) made a Pro Bowl. If you wanted to find a future star in rounds 4 or 5, you would have increased your chances by more than double by looking at the Northern Colorados and Alabama A&Ms of college football rather than the USCs and Alabamas.

[Chase note: It is at this point that I decided I needed to stop reading the article.  I trust Andrew, but found his claims too remarkable to just blindly accept. So I decided to open up my database to confirm. I removed punters and kickers but kept everyone else in the database.  To my amazement, the numbers not only seem legit, but perhaps even under-reported.  The average player selected from the 4th or 5th round from a Big School made 0.06 Pro Bowls, compared to 0.22 Pro Bowls for players from non-major schools!]

Regression Results: Controlling for Draft Position in a Flexible Way

To figure out the average bonus small school players offer compared to large school players, we can use linear regression to control for draft position. In the regressions, I predict whether a player became a Pro Bowler with a cubic polynomial in draft position and whether the player went to a major school. The regression results indicate that, looking across rounds and controlling for draft position, players from small schools are about 3 percentage points more likely to become Pro Bowlers. [3]We get almost the same result if we include higher powers of the pick number. We also get similar results if we use a logit instead of a linear regression. The standard error for the estimate is in … Continue reading

All rounds ( N = 2427 (0.014)):

[math]Pro Bowl = f(Pick, Pick^2, Pick^3) + 0.030 *Small School [/math]

The three percentage point bump for small school players is a substantial boost. Across all rounds of the draft, about 11.8% of the main position players made a Pro Bowl. Compared to this baseline, teams increase their chances of drafting a Pro Bowler by about 20% by drafting a small school player.

We can see more of this pattern by breaking things down according to the early and later rounds. If we look at rounds 1-3, nothing statistically significant emerges. The point estimate follows the overall pattern, but the result is not clear, in part due to the relatively small number of small school players drafted in the first three rounds.

Rounds 1-3 (N = 947 (0.034)):

[math]Pro Bowl = f(Pick, Pick^2, Pick^3) + 0.021 *Small School [/math]

On the other hand, in rounds 4-7, we get a very clear impact of picking small school players, an effect that is even more striking given the much smaller share of players who make the Pro Bowl in those rounds compared to earlier ones.

Round 4-7 (N = 1480 (0.011)):

[math]Pro Bowl = f(Pick, Pick^2, Pick^3) + 0.033 *Small School [/math]

We see that, controlling for the selection, small school players are 3.3 percentage points more likely to make the Pro Bowl. [4]The t-statistic is 3.04 and the p-value is .002. This represents about a doubling of the chance that a major school player makes the Pro Bowl. Just 3.1% of major school players drafted in Rounds 4-7 at the main positions made the Pro Bowl. The model predicts that around 6.4% of small school players drafted in those same positions would have made the Pro Bowl.

All-Pro Appearances

So focusing on small school players offers a much better way to draft a future star according to Pro Bowl appearances. And it doesn’t look like this is just about Pro Bowls. Instead, it’s pretty clear that small school players perform better more generally than major school players, once we control for draft position, with these differences primarily driven by the middle rounds, particularly 4 and 5.

Small school players drafted in rounds 4-7 are also about twice as likely to appear on an All-Pro team as their major school counterparts. Controlling for draft position, small school players are about 1.3 percentage points more likely to make an All-Pro team, relative to a baseline where 1.5% of major school players made an All-Pro team.

All-Pro (N = 1480 (0.008)):

[math]All-Pro= f(Pick, Pick^2, Pick^3) + 0.013 *Small School [/math]

Particularly given the relatively small number of players who made an All-Pro team, we can look at this another way by considering the number of appearances a player made on an All-Pro team. Controlling for draft position, players drafted in the middle rounds from small schools have an average of .036 more All-Pro selections than major school players. The mean number of All-Pro selections for major school players is .022, so small school players are predicted to have more than twice the number of All-Pro selections as their major school counterparts. [5]The small school players drafted in rounds 4-7 who made an All-Pro team are (with the number of appearances in parentheses): Adalius Thomas (2), Asante Samuel (3), Brandon Marshall (1), Cortland … Continue reading

Number of All-Pro Appearances (N = 1480 (0.015)):

[math]All-Pro Appearances = f(Pick, Pick^2, Pick^3) + 0.036 *Small School [/math]


The Best Defense Comes from Small Schools

One other interesting pattern in the data is the offense/defense breakdown. All of the above effects are driven by the defense. If we look just at offense, there’s basically no difference between big and small schools, which mimics what Chase found using a different methodology last year.  However, there are large gaps for defensive players.

Take the regression from before for rounds 4-7. Now let’s break it down separately for offense and defense:

Round 4-7, Offense only (N = 749 (0.016)):

[math]Pro Bowl = f(Pick, Pick^2, Pick^3) + 0.003 *Small School [/math]

Round 4-7, Defense only (N = 731 (0.015))::

[math]Pro Bowl = f(Pick, Pick^2, Pick^3) + 0.060 *Small School [/math]

The last gap is pretty enormous. Even if we don’t control for the spot the player is selected―which works against small school players since they get drafted later―we see the huge differences between small and large school defensive players. Out of 499 defensive players drafted in rounds 4-7 from major conference schools between 1998 and 2007, 10 (2.0%) made the Pro Bowl. On the other hand, out of 231 small school players drafted in those same rounds, 18 (7.8%) made the Pro Bowl. The gap for all-pro appearances is similarly large. There were a total of 10 all-pro appearances for the 499 large-school defensive players (.020 per player) and 17 all-pro appearances for the 232 small-school players (.073 per player) drafted in rounds 4-7 during this period.

Even though we have fewer than half as many draftees to pick from compared to major school players, look at the starting 11 we can field from small school players mostly picked in round 4 or later, with two round 3 draftees to fill in a couple of holes:

DE      Robert Mathis
DT      Paul Soliai
DT      Aaron Smith
DE       Jared Allen
OLB    Joey Porter (3)
MLB   Jeremiah Trotter (3)
OLB   Adalius Thomas
CB      Asante Samuel
CB      Cortland Finnegan
FS       Kerry Rhodes [6] Rhodes has actually never made a Pro Bowl, but he was second-team All-Pro in 2006. He did not count in the players from small schools who have made a Pro Bowl.
SS       Antoine Bethea

Note that if you go back a few more years, you can substitute La’Roi Glover (5th round, 1996, San Diego St.) for Soliai and Rodney Harrison (5th round, 1994, Western Illinois) in at SS, sliding Bethea in for Rhodes at FS. That is a pretty sweet defense, all built on middle-to-late round picks from small schools.

Conclusion

The data show that picks in the middle rounds of the draft have been substantially more productive when spent on players from smaller schools. Despite picking major-school players more than twice as frequently, teams have found as many stars from the smaller schools. On defense, they have actually found substantially more stars from schools such as New Hampshire than ones such as LSU. A defensive player taken in round 4 or later has been almost four times more likely to eventually make a Pro Bowl when that player comes from a school outside the traditional power conferences. Stars such as Jared Allen, Asante Samuel, and Robert Mathis are part of a larger pattern. Teams have found those essential mid-round steals by drafting players from smaller schools.

Why has there been this opportunity to do better by picking small school players? One possibility is that there was less information out there about those players, a gap that would have been decreasing as film and televised college games have become ubiquitous. That explanation makes some sense since the benefit to smaller school players emerges in the middle rounds, long after the Brian Urlachers (New Mexico) and Joe Greenes (North Texas) who were impossible to miss had been selected. However, with the sample going from 1998-2007, this explanation seems unsatisfying since teams have had relatively easy access to information about any college player.

The explanation that I think could make more sense is some kind of risk aversion, kind of like the bias that leads to punts on fourth down. Maybe teams in the middle rounds, not seeing clear standouts, felt that it’s safer to pick the player from Alabama instead of the one from Idaho State. Even though it’s anything but safer, general managers can say to themselves that they’re getting a player who’s a known quantity due to the college program he comes from. Picking the major school player might even be the kind of move that’s harder to criticize, putting the general manager in a similar position to the coach facing 4th and 3 at midfield, where the best choice for the team may not be optimal for the decision maker. Whatever the reason, the bias towards major school players in the middle rounds has left available potential stars to the teams that have chosen players from overlooked schools.

However, this potential opportunity may already be gone. Since 2008, six defensive players have made Pro Bowls and were drafted after round three. All six were actually from major schools: Kam Chancellor (Virginia Tech) and Richard Sherman (Stanford) in Seattle, Geno Atkins (Georgia), Henry Melton (Texas), Alterraun Verner (UCLA), and Greg Hardy (Mississippi). Across offense and defense, it’s eight Pro Bowlers for large schools (adding Carl Nicks and Jordan Cameron) versus four for small schools (Alfred Morris, True Receiving Yards champ Antonio Brown, Josh Sitton, and Julius Thomas, and not counting Jerome Felton, who plays FB), about the same ratio as players drafted altogether. Still, the biggest stars here are clearly the big school players.

Even though we need more years of data on all the players in these drafts, it is possible that the previous trend has shifted. Assuming that’s right, why might that have happened? One possibility is that ever more schools are getting national media attention, meaning that small schools aren’t so small anymore. [7]Another possibility is that NFL teams have changed their behavior. There has been almost no change over time, though, in the share of small school defensive players selected at certain points in the … Continue reading    Another possibility that seems even more plausible to me is that the increasing information on high school players means that great players are now less likely to be at small schools in the first place. Even though there will always be some great players who end up at small schools (see Watt, J.J.), maybe Jared Allen would have been recruited more heavily if he played now. There may now be fewer diamonds in the rough than there used to be. That idea suggests there might have been even more diamonds in the rough if we look at earlier years. And that looks like it might be exactly the case. Just looking at rounds 4 and later in some of these earlier drafts is kind of incredible. In 1989, there were five (non-kicker) Pro Bowlers from small schools and only one from a large school. In 1990, there were nine small school Pro Bowlers (including HOFer Shannon Sharpe) compared to just four from major schools. In 1991, it was eight small school Pro Bowlers compared to just two major school players. [8]Some of the late round diamonds in the rough may have become undrafted free agents in later years. For example, James Harrison (Kent State) and London Fletcher (John Carroll) are two small school … Continue reading All of this appears even though substantially more large school players are drafted in rounds 4-8. While the chance to find a small school steal was just on defense from 1998-2007, it seems like the opportunities may have been all over the field in earlier years.

References

References
1 In 2003, Central Florida went 3-9 in the MAC. While the Blake Bortles Knights may not be a football powerhouse, either, the 2013 UCF team that went 12-1 in the American Conference bears little resemblance to where the program was a decade ago.
2 Bonus points for getting those players. Aaron Smith was a 4th round pick out of Northern Colorado in 1999 and Jared Allen was a 4th round pick out of Idaho State in 2004.
3 We get almost the same result if we include higher powers of the pick number. We also get similar results if we use a logit instead of a linear regression. The standard error for the estimate is in parentheses.
4 The t-statistic is 3.04 and the p-value is .002.
5 The small school players drafted in rounds 4-7 who made an All-Pro team are (with the number of appearances in parentheses): Adalius Thomas (2), Asante Samuel (3), Brandon Marshall (1), Cortland Finnegan (1), Jahri Evans (5), Jared Allen (4), Jerry Azumah (1), Lance Schulters (1), Matt Birk (2), Michael Turner (2), Robert Mathis (1), Terrence McGee (2), and Trent Cole (1). Of these, McGee made it as a special teams player. Amongst major college players drafted in rounds 4-7, Dante Hall and Leon Washington made All-Pro teams as special teamers during this time.
6 Rhodes has actually never made a Pro Bowl, but he was second-team All-Pro in 2006. He did not count in the players from small schools who have made a Pro Bowl.
7 Another possibility is that NFL teams have changed their behavior. There has been almost no change over time, though, in the share of small school defensive players selected at certain points in the draft.
8 Some of the late round diamonds in the rough may have become undrafted free agents in later years. For example, James Harrison (Kent State) and London Fletcher (John Carroll) are two small school UDFAs who made Pro Bowls.
{ 13 comments }

The NFL Draft is this week, which means we have something resembling real football to talk about. But how much impact will the players who hear their names called during the 2014 Draft have on the 2014 season? Here’s the short answer: as a group, they will make up about 10% of games played by all players and 8% of all starts.

What do I mean by that? Each year, every team’s players start 352 games, which is the product of 16 (games) and 22 (starters). Players selected during the 2013 Draft started 27 games per team last year, which is in line with the recent average of eight percent. I also looked at the number of games played by all drafted rookies, and divided that by the number of games played by all players on that team. Take a look: the blue line represents games played by drafted rookies and the red line represents games started; both numbers on shown on a percentage basis for the league as a whole. [continue reading…]

{ 9 comments }
Clowney's potential is too tantalizing for Atlanta to ignore

Clowney's potential is too tantalizing for Atlanta to ignore.

1. ***Trade*** Atlanta: Jadeveon Clowney, DE, South Carolina

The Falcons are desperate for a pass rusher and Thomas Dimitroff doesn’t anticipate being this close to landing a top-flight talent like Clowney ever again. After successfully trading up for Julio Jones in 2011, Dimitroff rolls the dice again, sending the 6th pick in the draft along with number 68 (Atlanta’s 3rd rounder), and the team’s 2015 first round and third round picks to Houston.

It’s a heavy price to pay, but the best way for the Falcons to cure their pass-rushing woes.  On the first day of free agency, Atlanta signed three run-stuffing, interior defensive linemen; with Clowney, the Falcons now have a legitimate pass rusher to help them close out games against Drew Brees and Cam Newton. Atlanta is switching to a 3-4/hybrid defense this year, but that won’t deter Dimitroff from making this move.  The Texans like but don’t love Clowney, and just hours before the draft, finally get the ransom they’re demanding.

2. St. Louis (from Washington as part of Robert Griffin III trade): Khalil Mack, OLB, Buffalo

Jeff Fisher was the Titans coach for 16 drafts and has been with the Rams for two more.  In that time, he’s never spent a first round pick on an offensive lineman, and has only twice used a top-80 pick on the position (Michael Roos in 2005 and Jason Layman in 1996). St. Louis really wants to trade down here, but simply can’t find a partner.

Instead, Fisher harkens back to his days with the Bears, and decides one can never have enough pass rushers. Having Robert Quinn, Chris Long, and Michael Brockers is nice, but having them and Mack is even nicer. The Rams drafted Alec Ogletree last year, which leaves Jo-Lonn Dunbar as the odd man out at right outside linebacker. It also means Mack will get to line up behind Quinn, a terrifying prospect for every team that plays the Rams.

[continue reading…]

{ 13 comments }

The Evolution of Quarterbacks

Get your roll on 'Pepp

Get your roll on 'Pepp.

With the NFL draft approaching, you’ll hear a lot of statements about how the quarterback position is changing. Mobile quarterbacks are now “in”, which is a good thing for Johnny Manziel. A 6’4 frame is no longer required, which is a good thing for… well, Manziel, and negates some of the value of a player like Blake Bortles or Tom Savage. And, heck, do you even need to get a quarterback in the first round? If Teddy Bridgewater falls to the second round, how much of an outlier does that make him? What about say, Aaron Murray, who is both short and expected to be a late round pick?

I can’t tell you how any of the prospects in this year’s draft will turn out, but I can walk you through how the quarterback position has changed over the course of NFL history.

Methodology

For all three variables, I will be using the same methodology to measure “league average” in each season.  Each player in each year gets credit for his percentage of league-wide pass attempts in the season multiplied by his value in each variable.  For example, when calculating the 2013 league average, Peyton Manning’s [rushing numbers, height, draft position] was worth 3.6% of the league average, while in 1958, Johnny Unitas’s [rushing, height, draft position] was worth 6.7% of the league average. This gives us a weighted average for each variable, weighted by the number of pass attempts by that quarterback. [continue reading…]

{ 5 comments }

Compensatory Draft Picks From 2003 to 2013

Here’s a good story from Jenny Vrentas about compensatory draft picks in the NFL. The NFL provides extra picks to teams who lose more unrestricted free agents than they sign, and no team has manipulated the system quite like the Ravens.

The NFL’s formula for doling out these compensatory picks is a secret, but in general, the best players and the players signed to the biggest deals yield the best draft picks the following year, although compensatory picks are limited to rounds three through seven. Last year, Baltimore lost Dannell Ellerbe, Paul Kruger, Ed Reed, and Cary Williams to other teams; as a result, the Ravens now have an extra pick at the end of the third round, two at the end of the fourth, and another at the end of the fifth. The maximum number of compensatory picks a team can receive in a year is four, so Baltimore and Ozzie Newsome fared about as well as possible under the system.

The Jets are the only other team that will receive four compensatory picks in the 2014 Draft. New York lost Dustin Keller, Matt Slauson, Yeremiah Bell, Mike DeVito, Shonn Greene and LaRon Landry. Teams get credit for their net free agents lost: with a max of four picks, the Jets could go out and sign two UFAs from other teams in 2013, and that’s exactly what John Idzik did by signing Mike Goodson and Antwan Barnes. As a result, the Jets will get a 4th and three 6th rounders.

Since the actual NFL formula is a secret (and may be tweaked from year to year), nobody knows exactly how the picks will be awarded in any season (Philly.com has a very good article about the process).  One thing to keep in mind is that not all free agent signings will hurt a team in the compensatory picks game.  As Vrentas notes about the Ravens decisions during free agency:

They added receiver Steve Smith and tight end Owen Daniels, but since both players had been cut by their previous teams, they don’t count in the league’s compensatory picks formula. Nor do players signed after June 1, which helped the Ravens last year, when they filled a void at inside linebacker by signing Daryl Smith on June 5.

I did my best to compile all compensatory picks from 2003 to 2013. [1]Why 2003? The compensatory pick scheme began in 1994.  That year, the Eagles received a pick at the end of the first round for losing Reggie White.  The 2002 draft was a bit funky because the … Continue reading Then, I assigned the appropriate AV draft value to each slot to see which teams have fared the best over that time frame when it comes to receiving free picks.

This analysis ignores 2014, but the Ravens easily lead the pack in both picks awarded and draft value awarded.  Take a look:
[continue reading…]

References

References
1 Why 2003? The compensatory pick scheme began in 1994.  That year, the Eagles received a pick at the end of the first round for losing Reggie White.  The 2002 draft was a bit funky because the Texans received several supplemental picks in the middle of rounds, so the 2003 cutoff was a result of me being lazy.  By limiting the sample from ’03 to ’13, I was able to label all picks after 32 in each round as compensatory picks — which works, in theory.  Of course, you then need to include compensatory picks that are earlier than 32 in a round because a team used a supplemental draft pick in the prior year.  I’ve done that, but it’s a bit tricky, and there’s a non-zero chance I’ve erred.  That’s why I’ve presented the full list in this post.
{ 1 comment }

As part of the new collective bargaining agreement, most rookies sign four-year contracts. But as further evidence of the owners’ success during negotiations in connection with the 2011 lockout, teams were granted a club option for a fifth year for all players selected in the first round. The option is only guaranteed for injury, however, so a team can exercise the option for 2011 first round picks and still release the player after the 2014 season.

For players in the top ten, that fifth year salary is equal to an average of the top ten highest-paid players at their position from the prior year. For players selected with picks 11 through 32 — and boy, that number 11 pick never looked as valuable as it did in 2011 — the fifth-year deal is worth an average of the salaries of the players with the 3rd through 25th highest salaries at their position.

The deadline for exercising the fifth-year option on 2011 first rounders is tomorrow, May 3rd.  As a reminder, here is a review of the first round of the 2011 Draft: [continue reading…]

{ 7 comments }
Belichick has an eye on the point spread.

Belichick has an eye on the point spread.

Last week at Five Thirty Eight, Nate Silver noted that San Antonio Spurs head coach Gregg Popovich has produced an excellent record against the spread. He also checked in football’s version of Pop, Bill Belichick, and came to the same conclusion: Belichick hasn’t just been great, but he’s been great against the spread, too.

My database on point spreads goes back to 1978, so I went ahead and calculated the Against-The-Spread record of each head coach over the last 36 seasons. According to my numbers, Belichick has “covered” or won 40 more games against the spread than he’s lost, the most over this period. [1]My numbers differ slightly from Silver’s, although that’s not surprising. There is always some variation in point spread data, which is, of course, not official.  The table below shows the 122 men who  have coached at least 50 games or who were active in 2013.

Here’s how to read Belichick’s line: He has been coaching since 1991 (coaches who began before 1978 are included, but only their post-1977 seasons are counted (and only if they coached 50+ games since 1978)) and was last coaching in 2013. Over that time, he has coached in 332 games, including the post-season. His record against the spread is 182-142-8, which gives him a 0.562 winning percentage (ignoring ties). [2]When calculating regular winning percentage, we treat ties as half-wins and half-losses.  In his article, Silver excluded ties from calculating ATS winning percentages. I don’t know … Continue reading His real record is 218-114-0, which gives him a 0.657 winning percentage (again, including the playoffs). The table is sorted by the last category, which represents the difference beteween his number of wins against the spread and his number of losses against the spread. [continue reading…]

References

References
1 My numbers differ slightly from Silver’s, although that’s not surprising. There is always some variation in point spread data, which is, of course, not official.
2 When calculating regular winning percentage, we treat ties as half-wins and half-losses.  In his article, Silver excluded ties from calculating ATS winning percentages. I don’t know what’s customary, but Silver’s method makes sense: in the event of a “push” all money is simply returns.
{ 14 comments }

Remembering Earl Morrall

Morrall in Super Bowl V

Morrall in Super Bowl V.

Five days ago, Earl Morrall passed away at the age of 79. His story is well-known to many, but it’s one worth recounting for the uninitiated.

Born in Muskegon, Michigan, Morrall was a star quarterback and baseball player at Michigan State.  He made it to the College World Series in 1954 as an infielder, and a year later he guided the Spartans to a 9-1 record as a senior and a victory over UCLA in the Rose Bowl. Morrall was selected by San Francisco with the 2nd overall pick in the 1956 draft, where he sat behind Y.A. Tittle for a year.

In that draft, Pittsburgh used the first overall pick on safety/kicker Gary Glick, who had been a jack of all trades in college, but the team quickly had buyer’s remorse. After the 49ers selected John Brodie with the third pick in the 1957 draft, the Steelers saw an opportunity to acquire Morrall, and did so by sending two future first round picks (and linebacker Marv Matuszak) to the 49ers for Morrall. [1]The trade occurred in September 1957, so the two first round picks were Pittsburgh’s 1958 and 1959 selections. Neither panned out for San Francisco — the players selected were Jim Pace … Continue reading

Why was Pittsburgh so desperate to trade for him? Because Pittsburgh really needed a passer: the only other quarterbacks on the roster at the time were a pair of 22-year-olds named Len Dawson (yes that Len Dawson), whom the Steelers selected with the 5th pick in the ’57 draft, and Jack Kemp (yes that Jack Kemp). The Steelers knew you couldn’t count on young quarterbacks — the team released a 22-year-old Johnny Unitas two years earlier — which explains the trade with the 49ers.  As a reminder, just about everything Pittsburgh did before 1970 was a disaster.

Morrall produced solid numbers as the Steelers starter in ’57, but threw seven interceptions in his first two starts with the Steelers in 1958. Pittsburgh’s head coach at the time was Buddy Parker, who had coached the Lions from 1951 to 1956.  Parker was not content to turn the job over to Dawson, so he traded Morrall and a pair of picks [2]One of whom likely turned into the great Roger Brown to Detroit for his old quarterback, Bobby Layne. [continue reading…]

References

References
1 The trade occurred in September 1957, so the two first round picks were Pittsburgh’s 1958 and 1959 selections. Neither panned out for San Francisco — the players selected were Jim Pace and Dan James.
2 One of whom likely turned into the great Roger Brown
{ 22 comments }

Why Aren’t Teams Better At Drafting Now?

The NFL Draft has emerged from an afterthought to the center of the sports world every April spring. A cottage industry of draftniks has emerged. Teams spend more time, money, and other resources on scouting than ever before. Scouting departments have grown exponentially in both size and sophistication. The Draft used to be much less important, as evidenced by the way teams happily traded away future first round picks like they were fringe benefits. Over the last 45 years, teams should have become a lot better at drafting. But have they?

Measuring how well teams draft in the aggregate is not easy.  But suppose teams were perfect at drafting. In that case, the first pick would always turn out to be better than the second pick, the second pick would always turn out to be better than the third pick, and so on.  Right?

Well, maybe not. Nobody quite knows the ratio, but player development is a crucial part of the drafting process. Prospects do not come to the NFL as finished products, and it’s up to the team (and the player) to turn that college athlete into an NFL player. Making a selection on draft day is just step one, not the final step. When a player busts, is it the fault or the person in charge of the draft or the person in charge of the development?  When a player booms, is it because of the GM or the coach? I don’t know.  You don’t know. Nobody knows.

But we do know that player development is an important variable, so even in a perfect drafting world, we probably wouldn’t expect each player to turn out to have a better career than the player drafted after him. But comparing draft status to player production seems like the most basic and obvious way to measure draft efficiency. Frankly, I don’t know even how else one would measure draft efficiency than by comparing draft slot to player production.  I’m open to other ideas in the comments, but here’s what I did. [continue reading…]

{ 16 comments }

Last Wednesday, I looked at every time a team traded away a future first round draft pick in the last ten years. Today, the reverse: the times a team traded for a future first round pick.  I’ll again be focusing on the general manager or other person responsible for making the trade: that’s because future first round picks are generally discounted, and I’m curious to see how often patience is rewarded.  As we’ll see in our first example, hurting the team in the short term — even if the move looks brilliant in retrospect and is a win in the long term — does not necessarily mean much for the man making the deal.

1) Cleveland trades Trent Richardson to the Colts for a 2014 first round pick (Sept. 2013)

As a reminder, it was Tom Heckert who drafted Richardson with the third overall pick, so Lombardi doesn’t deserve any blame for the poor decision there.  In theory, Lombardi should have been rewarded for managing to still get a first round pick for Richardson, but instead, he just stacked the 2014 draft for Farmer.  For the franchise, it’s hard to view this trade as a great deal, because it’s connected to Richardson the draft pick (the Browns turned the 3rd pick in 2012 into the 26th pick in 2014). But as an isolated move, this one looks pretty strong for Cleveland and definitely for Lombardi, especially after how poorly Richardson performed in Indianapolis in 2013.

2) St. Louis trades 2012 first round pick (#2; Robert Griffin III) to Washington for 2012 first round pick (#6; Morris Claiborne), 2012 second round pick (#39; Janoris Jenkins), and 2013 first round pick (#22; Desmond Trufant) and 2014 first round pick (#2 overall) (March 2012)

A year ago, this trade arguably would define the Snead/Fisher era — in a bad way. Now, the Rams have managed to use one very valuable asset to restock the roster. Along with other trades, St. Louis wound up with four top 50 picks in 2012, two first round picks in 2013, and two more this year, including the second overall selection.  That hasn’t translated into much success on the field yet for Snead and Fisher, but it’s important to remember how bare the cupboard was when the duo arrived in 2012. Right now, this trade looks like a lopsided deal, but if RG3 can replicated his rookie season in 2014 — and Sam Bradford had another mediocre year — and the pendulum could swing again.

It’s worth noting that few decision makers would have been tempted to pull off this move. Fisher came to St. Louis in 2012 and was handed significant control.  That’s vital when a major part of the compensation involved a two year wait; that wasn’t a concern for Fisher, but I suspect it would be for most.

3) Cincinnati trades Carson Palmer to Oakland for 2012 first round pick (#17; Dre Kirkpatrick), 2013 second round pick (#37; Giovani Bernard) (October 2011)

Bernard and Kirkpatrick both look to be long-term starters in Cincinnati, while Palmer may have retired if the Bengals hadn’t traded him. This was an all-time great trade for Cincinnati and Lewis. The cherry on top is that Hue Jackson, who orchestrated the trade for Oakland, was Bernard’s position coach last year and will be the Bengals offensive coordinator in 2014. While the compensation wasn’t quite as generous, that’s as if Mike Lynn, the Vikings old general manager, moved on to the Dallas front office after the Herschel Walker trade.

[continue reading…]

{ 7 comments }

Turnover Among Targets, Part II

Yesterday, I looked at team turnover in the passing game for every team in 2013. You can review the pretty complicated [1]While I admit to it being complicated, I think the added value in accuracy is worth the added layer of complexity; frankly, I can’t think of a simple way to calculate turnover that really … Continue reading formula in that post, but the short version is to give each player credit for the lower of two values: his percentage of team receiving yards in Year N and his percentage of team yards in Year N-1. Today, I use that same concept to analyze team passing for every year since the merger.

And the team with the greatest receiving turnover in NFL history (even including pre-1970 teams) is the 1989 Detroit Lions. Take a look at the players who caught passes for Detroit in 1988:

Receiving
No. Age Pos G GS Rec Yds Y/R TD Y/G
82 Pete Mandley 27 PR/WR 15 14 44 617 14.0 4 41.1
33 Garry James 25 RB 16 16 39 382 9.8 2 23.9
80 Carl Bland 27 wr 16 2 21 307 14.6 2 19.2
89 Jeff Chadwick 28 WR 10 8 20 304 15.2 3 30.4
83 Gary Lee 23 KR/wr 14 6 22 261 11.9 1 18.6
30 James Jones 27 FB 14 14 29 259 8.9 0 18.5
87 Pat Carter 22 TE 15 14 13 145 11.2 0 9.7
49 Tony Paige 26 rb 16 2 11 100 9.1 0 6.3
81 Stephen Starring 27 6 0 5 89 17.8 0 14.8
38 Scott Williams 26 11 0 3 46 15.3 0 4.2
81 Mark Lewis 27 te 3 3 3 32 10.7 1 10.7
41 Paco Craig 23 8 0 2 29 14.5 0 3.6
26 Carl Painter 24 12 0 1 1 1.0 0 0.1
Team Total 26.2 16 213 2572 12.1 13 160.8

[continue reading…]

References

References
1 While I admit to it being complicated, I think the added value in accuracy is worth the added layer of complexity; frankly, I can’t think of a simple way to calculate turnover that really captures what analysts value.
{ 17105 comments }

Turnover Among Targets, Part I

Cam may need to really be Superman in 2014

Cam may need to really be Superman in 2014.

The Carolina Panthers have experienced a lot of turnover this offseason. Steve Smith (Baltimore), Ted Ginn (Arizona), Domenik Hixon (Chicago), and Brandon LaFell (New England) are all gone. Those four players were the only wide receivers to catch a pass for Carolina in 2013, and they accounted for 59% of the Panthers receiving yards. last year. What does this mean for Cam Newton? Last August, a couple of star quarterbacks appeared to be going through some similarly significant turnover among their targets.

Tom Brady lost four of his top five targets from 2012 and the fifth was Rob Gronkowski; in retrospect, most people underestimated how big of an impact this would have on Brady’s numbers. Meanwhile, Ben Roethlisberger’s receivers were a big question mark entering the season, but a monster year from Antonio Brown prevented Roethlisberger’s numbers from tanking. As it turned out, Roethlisberger didn’t wind up having much turnover, but the quarterback who experienced the second-most turnover wound up winning the Comeback Player of the Year award.

For Carolina, I think some of the departures have been overblown. The defense should again be one of the best in the NFL, and it’s not as though the passing game was outstanding last year. Greg Olsen led the team in receptions, receiving yards, and receiving touchdowns last year, and he’ll be back in 2014. In addition, the Panthers averaged 7.4 yards per attempt on passes to Greg Olsen last year and 7.1 yards per attempt (the league average) on passes to all other players. Carolina signed Jerricho Cotchery, Jason Avant, Tiquan Underwood, and Joe Webb, should draft a receiver or two in May, and has a potential sleeper in Marvin McNutt. I think they’ll be just fine, mostly because that’s all the passing game was last year.

Since it’s still a bit early to figure out exactly how the Panthers passing game will look in 2014, I thought we could use some time this weekend to review some history. Which teams have experienced the most turnover among their targets? And how do we even measure such a thing? [continue reading…]

{ 2 comments }

Peyton Manning’s time in Indianapolis was peppered with record-breaking moments that have been very well-publicized. But a relatively unknown record occurred during the nascent days of the Manning Era. In 1999, Edgerrin James rushed for 1,553 yards, an impressive accomplishment in any era. But here’s what’s really crazy: Manning was second in the team in rushing yards with 73! Keith Elias was the only other running back to record a carry, and he finished with 28 yards (Marvin Harrison and Terrence Wilkins added six total rushing yards). This means James recorded 93.6% of all Indianapolis rushing yards that season, still an NFL record, and one that is in no danger of being broken in the near future.

Second on the list of “largest percentage of the rushing pie” is … Edgerrin James for the Colts the following season. In 2000, he was responsible for 91.9% of all Indianpolis rushing yards. Only three other players have ever gained 90% of all team rushing yards: Emmitt Smith, Barry Sanders, and … Travis Henry. The table below shows the top 100 seasons as far as percentage of team rushing yards: [continue reading…]

{ 16 comments }

The 2014 NFL Schedule

The color-coded NFL schedule is back!

Download the Excel file here: 2014-NFL-SCHEDULE

That Excel file contains full page and wallet-sized copies of the schedule, in both color and black and white. On the wallet-sized copies, the line between weeks 8 and 9 has been enlarged — that is where you want to fold the paper in half to put in your wallet.

iPhone page: http://www.footballperspective.com/wp-content/uploads/2014/04/2014-iphone-schedule.png

Go to that page on your phone, then hit your power and home button at the same time to take a photo (or hit the button on the middle of the Safari browser and click ‘save image.’) The schedule has been formatted to fit an iPhone screen, so you can always carry the schedule with you.

Of course, you don’t need an iPhone or Excel to view the NFL schedule: [continue reading…]

{ 14 comments }

When a general manager trades away a future first round pick, it’s worth wondering if the transaction was the effect of the principal-agent problem. A general manager is supposed to act in the best interest of the franchise, but he may instead choose to act in his own self-interest. If he’s on the hot seat, trading a future first round pick for something right now may be a pretty attractive option, as he may not be around when the bill comes due.

Does that happen in practice? The most obvious example I can think of involved the Raiders in 2011.  On October 8th, Al Davis passed away. Eight days later, starting quarterback Jason Campbell went down for the season with a collarbone injury. With the owner and general manager positions unsettled, head coach Hue Jackson became the de facto head of football operations. And he traded first and second round picks to Cincinnati for Carson Palmer. Had the move worked out and the 4-2 Raiders gone on to make the playoffs, Jackson would have been very happy. When the move failed, the Raiders missed the playoffs and Jackson was fired. As a result, it was Reggie McKenzie sitting at the table when the bill arrived.

[continue reading…]

{ 21 comments }

By now, you know about guest blogger Andrew Healy, an economics professor at Loyola Marymount University and author of today’s post. There’s now a tag at the site where you can find all of his great work. He’s back with a cap to his excellent series about playoff performance, and today’s post will not disappoint:


The Purple People Eaters never won a Super Bowl

The Purple People Eaters never won a Super Bowl.

We know the teams that have experienced consistent heartbreak at the altar. But is it the Vikings, Eagles, or Bills that are the most unlikely to have never won a Super Bowl? On the flip side, we know the teams that stacked championships on top of championships. But is it the Packers, Steelers, or 49ers that have made the most of their chances?

For the latter question, it turns out that it’s option D, none of the above.  One mystery team has won four championships despite having had a pretty decent chance of never winning a single Lombardi.  The most unlikely team never to win a Super Bowl turns out to be a team that lost “only” two Super Bowls, but that has led the NFL in DVOA four times since 1979.

To figure this stuff out, I’ve utilized DVOA ratings and estimated DVOA ratings to rerun the NFL playoffs. In the simulations, the slate is wiped clean, which means there’s no reason The Fumble or The Helmet Catch or The Immaculate Reception have to happen this time around.

In last week’s post, I went decade by decade to look at the best teams, and also those that most let opportunity slip through their fingers. Today, I bring it all together. I compare what might have been with what actually was for the NFL from 1950 to 2013. I’ll also hand out awards for the teams that were the most unlikely winners and the most unlikely losers of all time. [continue reading…]

{ 9 comments }