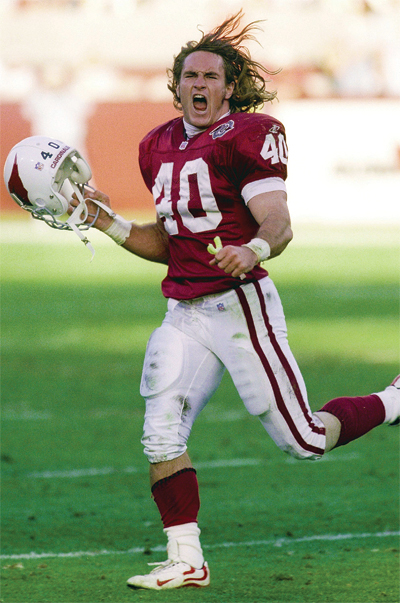
≡ Menu

Brodie (left) and Tittle (right) on the 49ers. Photo by Associated Press/1960 Photo: 1960, Associated Press.

Entire books have been written about the West Coast Offense. Friend of the program Chris Brown has an excellent primer on some of the principles of the system. Due to time constraints, this post is not going to dissect a voluminous playbook, translate Spider 3 Y Banana into English, or discuss the role of motions or shifts in the offense. This post will not help you find the winning edge.

I thought it would be interesting to see if certain statistics could help identify teams that ran a West Coast Offense. My initial thought was that an effective West Coast Offense would manifest itself in three key statistics:

  • Completion percentage. The WCO is built around short passes that work as a substitute for running plays. These long handoffs lead to high completion percentages for the quarterback.
  • Yards per completion. Short passes imply lower yards per completion. Ideally, we’d analyze yards per completion after removing yards after the catch, but that’s not something the NFL kept records of historically. Still, I think a low yards per completion average can be a good indicator that a team ran a West Coast Offense.
  • Passing first downs. In a West Coast Offense, teams are moving the chains through the air. With fewer long gains and a pass-first mentality, one would expect a lot of passing first downs.

Background

If you’re a historian, you can skip this section. The classic story told about the birth of the West Coast Offense takes us back to before the AFL-NFL merger. In 1969, the Bengals had Paul Brown as head coach and Bill Walsh as the assistant coach/offensive coordinator. That year, quarterback Greg Cook had one of the great rookie seasons in history, but injuries to his rotator cuff and biceps ruined his career. The team turned to backup Virgil Carter, a very smart and accurate passer but who was destined to be a backup because of his size and weak arm. Those factors led Walsh and Brown to implement an offense that catered to Carter’s strengths and hid his weaknesses.

Carter wasn’t just smart for football. In 1970, he published a seminal paper that was the precursor to the Expected Points models we see today; in ’71, Carter led the NFL in completion percentage, but ranked third to last among the 21 qualifying quarterbacks in yards per completion. The Bengals ranked 9th in passing first downs, and those statistics seem to jive with the picture we all have in our heads of a West Coast Offense.
[continue reading…]

{ 9 comments }

Vegas likes Alabama a lot more than it likes LSU

Vegas likes Alabama a lot more than it likes LSU.

The Simple Rating System is a set of computer rankings focused on only two variables: strength of schedule and margin of victory. I published weekly college football SRS ratings each week last season, and you can read more about the SRS there. Last month, Jason Lisk of the Big Lead took the Las Vegas point spread for each NFL game to come up with a set of power rankings; I stole Lisk’s idea and used the same point spreads to create implied SRS ratings for every NFL team. The idea is that if the 49ers are a 10.5-point neutral site favorite over the Jaguars, that’s one data point that implies that Las Vegas views San Francisco as 10.5 points better than Jacksonville. By taking every data point, and using Excel to iterate the ratings hundreds of times, you can create a set of implied team ratings.

Last week, the Golden Nugget released the point spreads for 248 college football games. By using the same process, those point spreads can help us determine the implied ratings that Las Vegas has assigned to each team.

We don’t have a full slate of games, but we do have at least 1 game for 83 different teams. Theoretically, this is different than using actual game results: one game can be enough to come up with Vegas’ implied rating for the team. That’s because once we’re confident in Oklahoma’s rating, Tulsa being 18-point underdogs in Norman gives us a good estimate for how Vegas views Tulsa. I assigned 3 points to the road team in each game in coming up with the implied SRS ratings. For example, Arizona is an 11-point favorite on the road against California. So for that game, we assume Vegas believes the Wildcats are 14 points better than the Golden Bears; if we do this for each of the other 247 games, and then iterate the results hundreds of times, we can come up with a set of power ratings.

Unsurprisingly, Alabama comes out as the highest-rated team. The Crimson Tide are being rated as 19.6 points better than “average,” although average isn’t really a concept with much meaning here. The SRS rating has little meaning in the abstract, but is useful to get a sense of the Crimson Tide’s rating relative to the rest of the teams. If Alabama is 10 points better in the SRS than a team, that means Alabama would be projected as a 10-point favorite on a neutral site. In the table below, I’ve included the number of games for which we have point spreads for each team on the far left. The “MOV” column shows the home field-adjusted average point spread for that team, the “SOS” column shows the average rating of each team’s opponent (for only the number of games for which we have lines), and the “SRS” column shows the school’s SRS rating.
[continue reading…]

{ 3 comments }

What can we learn from Game Scripts splits?

Christian Ponder actually played better in the worst Vikings games last year

Christian Ponder actually played better in the worst Vikings games last year.

When I ask a question in the title of a post, I usually have an answer. But not this time. From 2000 to 2012, 163 different quarterbacks started 16 games. I thought it might be interesting to check out their splits based on the Game Script of each game. I grouped each quarterback’s statistics in their team’s 8 highest Game Scripts and 8 worst Game Scripts in the table below. The statistics in blue are from the 8 best games, while the numbers in red are for the 8 worst games (as measured by average points margin in each game).

I don’t know if individual splits will tell us much, but Rex Grossman had the largest split. In 2006, the year the Bears went to the Super Bowl, he averaged 8.54 AY/A in Chicago’s best 8 games but just 3.24 AY/A in their worst games. Splicing out cause and effect is tricky: in games where a quarterback has lots of interceptions, his team is probably going to be losing and will have a negative game script for that game. In Chicago’s 8 best games that year (according to Game Scripts), Grossman threw 16 TDs and 4 INTs; in their 8 worst, he threw 7 TDs and 16 INTs.

Maybe there’s nothing to make of this. But it’s Sunday, so I’ll present the day and open the question to the crowd. What can we make of Game Scripts splits? Check out the table below.
[continue reading…]

{ 5 comments }

NFL Average Plays per Team Since 1950

In light of the Patriots nearly breaking the NFL record for plays, and the promise of up-tempo offenses in Philadelphia (under Chip Kelly) and Denver (Adam Gase), it’s easy to think that the number of plays run per team is about to reach historic levels. But that seems really unlikely.

The graph below shows the number of plays run per team game for each season since 1950. The total number of plays run is in blue for the NFL; I also added the same data for the AFL in red. As you can see, the number of plays per team game has been relatively steady over the last 64 years, but the high-water marks were the early ’50s and most of the 1980s.

In addition to plays run, the graph also shows:

  • The number of rushing plays per team game in green, a number that’s obviously on the decline.
  • The number of completions per team game in black, which has risen as the number of runs has declined.
  • The number of incomplete passes per team game in orange. Incomplete passes stop the clock, so I thought we might see something interesting there. How’s this for trivia: there were 13.5 incomplete passes per team game in 2012, the same number that existed in 1948! While 1948 is off the graph, you can see that the number of incomplete passes per game has been remarkably consistent throughout NFL history. In fact, the average from 1950 to 2012 is 13.5 incompletions per game, and the league average was 13.5 +/- one incompletion in over 80% of the seasons since 1950.
  • The number of sacks per team game is in purple, a number that has also stayed very consistent over time. Only three times since 1950 has the league average been less than two sacks per game or more than three sacks per game.
playslgavg1950
{ 5 comments }

Records of Great Coaches Against Great Coaches

ESPN is counting down its top 20 coaches in NFL history. So far, we have:

Old school Parcells/Belichick

Can you believe the Jets hired Pete Carroll? I would never go there.

No. 20: Tony Dungy
No. 19: Mike Shanahan
No. 18: Sid Gillman
No. 17: Marv Levy
No. 16: Hank Stram
No. 15: Bud Grant
No. 14: Tom Coughlin
No. 13: Jimmy Johnson
No. 12: John Madden
No. 11: Bill Parcells
No. 10: Curly Lambeau
No. 9: Joe Gibbs
No. 8: Tom Landry
No. 7: Bill Belichick
No. 6: Paul Brown

No doubt, the final five coaches are Don Shula, Chuck Noll, George Halas, Vince Lombardi; and Bill Walsh. But this post isn’t me complaining about those rankings or coming up with my own system.

Grading coaches across eras is even more difficult than it is with players. How do you compare Lambeau, who coached for 33 years and won 6 NFL championships, to Belichick? Lombardi became a head coach in ’59, Shula in ’63. But how do you vault when over the other when Lombardi died in 1970 while Shula was still coaching in 1995? John Madden has the best winning percentage among coaches with at least 100 games, but he took over a team that went 25-3 in the two years before he arrived. What’s the appropriate way to compare him to Walsh or Johnson?

Instead of trying to answer the difficult questions, I’ll answer something I’m very well-equipped to handle. I’ve seen people cite the records of certain coaches against each other as evidence for or against a particular coach. That’s an obviously flawed way to break a divide, but hey, it’s Friday in the offseason, so let’s look at head-to-head coaching records.
[continue reading…]

{ 8 comments }

Eleven Years And Counting

Outstanding. Now the real question? Want to be a Footballguy?

That was the e-mail I received from David Dodds on June 6, 2002. The co-owner of Footballguys.com then and now, Dodds was replying to a freelance article I submitted to his site. Two days later, my article was posted, and I had become a paid writer.

Eleven years ago, there was no twitter, blogging wasn’t mainstream, and fantasy football was probably less cool and definitely less popular than Dungeons and Dragons. I hated writing: growing up, I was always a “math person.” I thought of writing proficiency as a soft skill, itself a euphemism for a useless skill, and had no desire to spend a moment of my time writing. My brother was and is a sports anchor/reporter, and he was the writer in the family.

I began playing fantasy sports in the late ’90s, which was a year-round hobby as fantasy basketball and fantasy football rose in popularity (I started off with fantasy baseball). I was quickly hooked on fantasy football, but it took a couple of years before Footballguys came across my radar. The articles were terrific and opened my eyes to the intricacies and strategies of the game. But the real treasure was the site’s message board. I could post on the board and minutes later someone would reply. That was my first introduction to the value of reader feedback. I didn’t think of “posting” on the message board as writing, but it was there that I learned the appropriate ways to craft an argument. The board also helped me develop a pretty thick skin for internet criticism, the sort of armor every blogger needs.
[continue reading…]

{ 37 comments }

After hearing that the other Steve Smith was retiring, Kyle on twitter asked me where Smith’s 2009 season ranked in the pantheon of anomalous wide receiver seasons. In case you forgot, take a look at Smith’s yearly production:

Year Age Tm G GS Rec Yds Y/R TD
2007 22 NYG 5 0 8 63 7.9 0
2008 23 NYG 16 4 57 574 10.1 1
2009* 24 NYG 16 15 107 1220 11.4 7
2010 25 NYG 9 7 48 529 11.0 3
2011* 26 PHI 9 1 11 124 11.3 1
2012 27 STL 9 0 14 131 9.4 0
Career 64 27 245 2641 10.8 12
4 yrs NYG 46 26 220 2386 10.8 11
1 yr PHI 9 1 11 124 11.3 1
1 yr STL 9 0 14 131 9.4 0

Smith had what looked like a breakout season in 2009, catching 107 passes for 1,220 yards and seven touchdowns. As it turned out, those numbers represent 44% of his career receptions, 46% of his career receiving yards, and 58% of his career touchdowns.

So how do we measure the biggest outlier seasons of all time? One way would be to compare each receiver’s best season to his second best season and see the difference. I used Adjusted Catch Yards — calculated as Receiving Yards plus five yards for every Reception and twenty yards for every Receiving Touchdown — to do that for every retired receiver and tight end in NFL history. The table below shows all receivers who gained at least 800 more Adjusted Catch Yards in their best season than in their second best season. For example, here’s how to read the Germane Crowell line. Crowell’s best season came with Detroit in 1999, when he caught 81 passes for 1,338 yards and 7 touchdowns. That’s equal to 1,883 Adjusted Catch Yards. In his second best year, he caught only 34 passes for 430 yards and three touchdowns, giving him only 660 ACY. That’s 1,223 Adjusted Catch Yards fewer than in his best season. Using this method, Steve Smith comes in with the sixth most anomalous season in NFL history.
[continue reading…]

{ 3 comments }

Which NFL teams draft from which colleges? Part II

You can see why the Bengals like the Bulldogs.

You can see why the Bengals like the Bulldogs.

Last week, I posted this article analyzing NFL team/college pairings in the NFL Draft. In that study, I included every draft pick since 1936, as the goal was to get a flavor of NFL history. However, I thought it would be fun to do the same thing but to look at more recent time periods. Today’s post will be mostly tables, so hopefully you guys can add the analysis. Let’s start by looking at all (but only) the drafts in the post-merger period in NFL history.

NFL Drafts from 1970 to 2013

Top Five Schools for each Team

The Rams/UCLA connection is still at the top of the list, but the Pittsburgh/Pittsburgh combination falls off. In fact, the Chiefs and 49ers have drafted as many Panthers since the merger (10) as the Steelers. The table below shows the top five schools for each team: [continue reading…]

{ 2 comments }

Throwing deep against Charles Tillman can be hazardous to your passer rating

Throwing deep against Charles Tillman can be hazardous to your passer rating.

Last off-season, I produced an exhaustive analysis of fumble recovery rates. With 13 years of play-by-play data at my disposal, I thought it would be worthwhile to take a closer look at interceptions. You can skip to the results section if you like, but let me start with a few disclaimers.

Interceptions are tricky to analyze. Interception rates are very inconsistent from year to year, so much so that completion percentage alone may be a better predictor of future interception rate than actual interception rate. But putting aside randomness, there are two other big factors that determine interception rates: the score in the game and the length of the throw.

Just about every quarterback will throw more interceptions when his team is trailing in the fourth quarter. Situation plays a huge role in football, and that’s true when it comes to interception rates, too. Similarly, quarterbacks are much more likely to be intercepted on deep passes than short ones. One thing I wanted to look at was how much league-wide interception rates varied over a wide range of circumstances.

Unfortunately, there still is a bit of bias in the data. The best quarterbacks are most likely to be winning and the worst quarterbacks are most likely to be losing. That means to the extent that trailing teams throw more interceptions than leading teams, the results are probably slightly overstated. Still, I think getting a sense of the league baseline over hundreds of thousands of throw — even if not evenly distributed — can be a useful exercise.

The Results

From 2000 to 2012, there were 6,689 interceptions thrown. Here’s the breakdown with respect to the points differential (i.e., points scored minus points allowed) for the offensive team immediately before the interception. For example, teams trailing by more than four touchdowns have thrown 110 interceptions over the last 13 regular seasons. That accounts for 1.6% of all interceptions thrown over that time period:
[continue reading…]

{ 15 comments }

Over at Footballguys.com, I explain my method of how to value a player that we know is going to a certain number of games. You can’t simply use the player’s projected number of fantasy points because that will underrate him. But if you go by his projected points per game average, he’ll be overrated. Using Rob Gronkowski as an example, I explained my method:

First, you need to determine the fantasy value of a perfectly healthy Gronkowski.  Prior to today’s news, David Dodds had projected Gronkowski to record 70 catches for 938 yards and 9 touchdowns… but in only 14 games.  This means Dodds had projected the Patriots star to average 10.6 FP/G in standard leagues, 15.6 FP/G in leagues that award one point per reception, and 18.1 FP/G in leagues like the FFPC that give tight ends 1.5 points per reception.

But those numbers aren’t useful in a vacuum: the proper way to value a player isn’t to look at the number of fantasy points he scores.  Instead, the concept of VBD tells us that a player’s fantasy value is a function of how many fantasy points he scores relative to the other players at his position.  I like to use a VBD baseline equal to that of a replacement player at the position, and “average backup” is a good proxy for that.  In a 12-team league that starts one tight end with no flex option, that would be TE18.  In standard leagues, TE18 on a points per game basis is Brandon Myers, the ex-Raiders tight end now with the Giants.  Footballguys projects Myers to average 5.4 FP/G in standard leagues and and 8.9 FP/G in PPR leagues.  In 1.5 PPR leagues, Martellus Bennett comes in at TE18 in our projections, with an average of 10.6 FP/G.

You can read the full article, which includes a neat table, here.

{ 4 comments }

At Footballguys.com, I explain why fantasy football owners need to understand the concept of regression to the mean. Readers of this blog probably don’t need the long background, but you might enjoy some of the graphs at the end. For example, this is the distribution of yards per carry in Year N and yards per carry in Year N+1:

regression ypc

You can read the full article here.

{ 4 comments }

Longest Streaks without a 1,000-yard receiver

The last Jaguar to record 1,000 receiving yards in a season.

The last Jaguar to record 1,000 receiving yards in a season.

A couple of weeks ago, I looked at the longest team streaks without a 1,000-yard rusher. Today’s post examines the teams that went the longest stretch without boasting a 1,000-yard receiver. I’m only going to look at things starting in 1978 (with one caveat), however, as 1,000-yard seasons were much rarer before then. The Redskins and Cardinals didn’t even have a 1,000-yard receiver until 1962, when Bobby Mitchell and Sonny Randle hit those marks for Washington and St. Louis, respectively.

The Jaguars and Raiders have each gone seven straight seasons without a 1,000-yard receiver. Jimmy Smith, one of the most underrated receivers in NFL history, was the last Jacksonville player to gain 1,000 receiving yards in a season. Fortunately for Jaguars fans, there’s a good chance the streak ends in 2013. Cecil Shorts missed two full games due to injury and finished with 979 receiving yards during his breakout season last year, and should be even better this year. He also could benefit from Justin Blackmon being out for the first four games of this season. As for Oakland, the last receiver … well, see if you can remember who was the last Raider with 1,000 receiving yards in a season. Answer is at the end of this post.

The table below shows all teams since 1978 to go at least seven straight years without a 1,000-yard receiver. The one caveat from above? I’ll include pre-1978 seasons for any team that also failed to produce a 1,000-yard receiver from ’78 to ’84, too.
[continue reading…]

{ 3 comments }

Turner describing a route. I think.

Turner describing a route. I think.

With Norv Turner, you know what you’re going to get. Turner was fired in San Diego after the Chargers failed to make the playoffs in each of the last three years, but as usual, Turner was able to find a nice landing spot. He’ll be the Browns offensive coordinator in 2013, which will mark his 29th straight year in the NFL. Turner started as a receivers coach with the Rams in 1985 and hasn’t been out of work for very long ever since.

And while he has a reputation for having great running games, he also has habit of sending his receivers down the field. That’s no accident. Ernie Zampese, a longtime assistant under Don Coryell, became the Rams offensive coordinator in 1987, and Turner’s teams have been running a variation of the vertical Coryell/Zampese system ever since.

I ranked all players (minimum 500 receiving yards) in yards per reception in each year since Turner was united with Zampese in ’87. In six of those seasons, one of five different Turner receivers led the NFL in yards per reception. In addition, Turner’s top receiver (in terms of YPR) finished in the top five in that metric thirteen more times. The table below shows the rank of the highest-ranked receiver (in terms of YPR) in Turner’s offense in each of the last 26 years.
[continue reading…]

{ 2 comments }
If I throw a spiral, I pledge to use one challenge in the first quarter

If I throw a spiral, I pledge to use one challenge in the first quarter.

Marvin Lewis has coached the Bengals for ten seasons. To his credit, Lewis has helped resurrect the worst franchise of the 1990s; on the other hand, Lewis has not won a playoff game in ten years with the Bengals. That’s unheard of in this era where coaches are expected to win and win big right away. No other active coach has gone even five straight seasons with his current franchise without a playoff victory. At the end of the 2012 year, four coaches — Andy Reid in Philadelphia, Jim Schwartz in Detroit, and Norv Turner in San Diego — had gone four straight years, and Reid and Turner were both fired after the season. Schwartz was given a longer leash after he inherited an 0-16 team, but he is now on the hot seat. Only three others coaching at the end of 2012 had gone even three straight years for the same team without a playoff win — Buffalo’s Chan Gailey, Mike Shanahan in Washington, and Ken Whisenhunt in Arizona. Shanahan made the playoffs last year but lost, while Gailey and Whisenhunt were both replaced. [1]Jason Garrett and Leslie Frazier technically meet the requirement, too, but they only coached for the second half of the season in 2010.

Prior to the Super Bowl era, there was only one playoff game a year (other than playoff games to break ties). Since 1966, Lewis is one of just two coaches to coach one team for a decade and fail to win a playoff game. [2]If you want to look before the Super Bowl era, there were two longer streaks. Steve Owen was the Giants head coach from 1931 to 1953. He compiled a 151-100-17 record and won two championships with … Continue reading The 11th, the elder Jim Mora, was fired by the New Orleans Saints in his 11th year after a 2-6 start. The table below shows each coach since 1966 who was the head coach for the same team for five straight years and failed to win a playoff game during that stretch. The “First Yr” and “Last Yr” columns show the first and last years of the streaks, not of the coach’s tenure. Coaches who were fired in the middle of their last season are marked by an asterisk, while coaches whose reign started in mid-season (but who are treated as if they coached the entire season) are marked with a “+” sign.
[continue reading…]

References

References
1 Jason Garrett and Leslie Frazier technically meet the requirement, too, but they only coached for the second half of the season in 2010.
2 If you want to look before the Super Bowl era, there were two longer streaks. Steve Owen was the Giants head coach from 1931 to 1953. He compiled a 151-100-17 record and won two championships with New York, but those were the only two seasons he won a playoff game. The last fifteen years of his coaching career he did not win a playoff game. Bears owner/coach George Halas did not win a playoff game from 1947 to 1962. That was a stretch of fourteen seasons (he did not coach in ’56 or ’57), and it only included one playoff loss.
{ 5 comments }

Great Linebackers Playing Together II

One of the many great pairs of Bears linebackers

One of the many great pairs of Bears linebackers.

Four years ago, I wrote version 1 of this article. With Brian Urlacher and Ray Lewis retiring, I thought it would be fun to revisit the topic.

This post is NOT a look at the greatest linebacker groups ever. Instead, this post seeks to identify teams that had a bunch of great linebackers playing together while those players were in their primes.

The first thing we need to do is rate the linebackers. I used PFR’s Approximate Value system, which assigns a value to measure the approximate contribution of each player in each season since 1950. I then analyzed each player’s single-season AV score to come up with a base rating for each linebacker. [1]One other note: I applied an AFL qualifier for players in the earlier days of the AFL. It’s always difficult figuring out how to grade a player’s career, as you need to balance career length with peak production. I decided to average the best five years (they need not be consecutive) for every linebacker since 1950 to come up with a “peak AV rating” for each linebacker. Then I adjusted each linebacker’s peak AV rating for each season of his career depending solely on his age. That age adjusted score is the rating I’m giving each linebacker for each season of play, not his actual AV grade. [2]If you used the actual AV score, you would essentially be compiling a list of the best defenses of all time and little more.
[continue reading…]

References

References
1 One other note: I applied an AFL qualifier for players in the earlier days of the AFL.
2 If you used the actual AV score, you would essentially be compiling a list of the best defenses of all time and little more.
{ 16 comments }

Which NFL teams draft from which colleges?

[Click here for Part II, which focuses on more recent drafts.]

The Steelers found lots of players from Pittsburgh, but not this one.

The Steelers found lots of players from Pittsburgh, but not this one.

Gregg Rosenthal on NFL.com noted that both the Patriots and Buccaneers have eight former Rutgers players on each of their rosters. With former Rutgers head coach Greg Schiano coaching in Tampa Bay, seeing Scarlet Knights pop up in Florida isn’t too surprising. With Belichick, you can trace the Piscataway-Foxboro connection to the fact that Belichick has long been an admirer of Schiano’s program and that his son was a member of the Rutgers football team.

In the 2013 draft, Belichick selected three players from Rutgers — cornerback Logan Ryan, safety Duron Harmon, and linebacker Steve Beauharnais. The Patriots were one of two teams to draft three players from one college. Down in Miami, the Dolphins selected three Florida Gators, linebacker Jelani Jenkins, running back Mike Gillislee, and kicker Caleb Sturgis.

It’s not unusual for teams to get smitten with the Gators program. In the last 25 years, only once has a team selected four players from the same college. That happened in 2003, when Chicago drafted the following players from Gainesville: quarterback Rex Grossman, defensive back Todd Johnson, and defensive tackles Ian Scott and Tron LaFavor.

Which team has selected the most players from one school? As it turns out, there’s a two-way tie. 2013 will mark the 77th season for the Rams, who spent their first nine years in Cleveland and their last eighteen in St. Louis. But the middle fifty years were spent in Los Angeles (or Anaheim), and the franchise has drafted 45 players from UCLA. The other team to draft 45 players from one school also had a local connection. The Steelers used to go to the Pittsburgh well repeatedly, although they have selected only Panther in the last 20 drafts. You can view the 90 Rams/Bruins and Steelers/Rams draftees here.
[continue reading…]

{ 15 comments }

Memorial Day

Pat  Tillman

Pat Tillman.

It is the soldier, not the reporter, who has given us freedom of the press. It is the soldier, not the poet, who has given us freedom of speech. It is the soldier, not the campus organizer, who has given us the freedom to demonstrate. It is the soldier, who salutes the flag, who serves beneath the flag, and whose coffin is draped by the flag, who allows the protester to burn the flag.
Father Dennis Edward O’Brien, USMC

Today is a day that we as Americans honor and remember those who lost their lives protecting our country. As my friend Joe Bryant says, it’s easy for the true meaning of this day to get lost in the excitement of summer and barbecues and picnics. But that quote helps me remember that the things I enjoy today are only possible because those before me made incredibly selfless sacrifices. And since this is a football blog, I thought I’d take the time to remember the many football players who have lost their lives defending our country.

The most famous, of course, is Pat Tillman, the former Arizona Cardinals safety who chose to quit football to enlist in the United States army. On April 22, nine years ago, Tillman died in Afghanistan. In Vietnam, we lost both Bob Kalsu and Don Steinbrunner. You can read their stories here. Hall of Famers Roger Staubach, Ray Nitschke, and Charlie Joiner were three of the 28 NFL men to serve in the military during that war.

An incredible 226 men with NFL ties served in the Korean War, including men like Night Train Lane and Don Shula. But it was World War II that claimed the lives of 21 former NFL players.

I first encountered the list below from Sean Lahman, identifying those 21 players.

Jack Chevigny, former coach of the Cardinals, and John O’Keefe, an executive with the Eagles, were also World War II casualties. The Pro Football Hall of Fame has chronicled the stories of these men, too. Lummus received the Medal of Honor for his bravery at Iwo Jima, and you can read more about his sacrifice here.

Let me close with some more words from Father Dennis Edward O’Brien.

What is a Veteran?

Some veterans bear visible signs of their service: a missing limb, a jagged scar, a certain look in the eye.

Others may carry the evidence inside them: a pin holding a bone together, a piece of shrapnel in the leg – or perhaps another sort of inner steel: the soul’s ally forged in the refinery of adversity.

Except in parades, however, the men and women who have kept America safe wear no badge or emblem.

You can’t tell a vet just by looking.

He is the cop on the beat who spent six months in Saudi Arabia sweating two gallons a day making sure the armored personnel carriers didn’t run out of fuel.

He is the barroom loudmouth, dumber than five wooden planks, whose overgrown frat-boy behavior is outweighed a hundred times in the cosmic scales by four hours of exquisite bravery near the 38th parallel.

She – or he – is the nurse who fought against futility and went to sleep sobbing every night for two solid years in Da Nang.

He is the POW who went away one person and came back another – or didn’t come back AT ALL.

He is the Quantico drill instructor who has never seen combat – but has saved countless lives by turning slouchy, no-account rednecks and gang members into Marines, and teaching them to watch each other’s backs.

He is the parade – riding Legionnaire who pins on his ribbons and medals with a prosthetic hand.

He is the career quartermaster who watches the ribbons and medals pass him by.

He is the three anonymous heroes in The Tomb Of The Unknowns, whose presence at the Arlington National Cemetery must forever preserve the memory of all the anonymous heroes whose valor dies unrecognized with them on the battlefield or in the ocean’s sunless deep.

He is the old guy bagging groceries at the supermarket – palsied now and aggravatingly slow – who helped liberate a Nazi death camp and who wishes all day long that his wife were still alive to hold him when the nightmares come.

He is an ordinary and yet an extraordinary human being – a person who offered some of his life’s most vital years in the service of his country, and who sacrificed his ambitions so others would not have to sacrifice theirs.

He is a soldier and a savior and a sword against the darkness, and he is nothing more than the finest, greatest testimony on behalf of the finest, greatest nation ever known.

So remember, each time you see someone who has served our country, just lean over and say Thank You. That’s all most people need, and in most cases it will mean more than any medals they could have been awarded or were awarded.

Two little words that mean a lot, “THANK YOU”.

{ 1 comment }

Over at Footballguys.com, I identified which quarterback statistics are repeatable and which ones are most likely to regress to the mean. I also ran a regression using touchdown length as my input and future touchdowns as my output.

From 1990 to 2011, 188 different quarterbacks started at least 14 games and thrown 300+ passes in one year, and then attempted at least 300 passes for the same team the next season. After analyzing the lengths of each touchdown pass for those quarterbacks, I discovered the following:

  • For every one-yard touchdown pass in Year N, expect 0.70 touchdowns in Year N+1
  • For every two-to-five-yard touchdown pass in Year N, expect 0.56 touchdowns in Year N+2
  • For every six-to-ten-yard touchdown pass in Year N, expect 0.77 touchdowns in Year N+2
  • For every 11-to-20-yard touchdown pass in Year N, expect 0.70 touchdowns in Year N+2
  • For every 21-to-30-yard touchdown pass in Year N, expect 0.22 touchdowns in Year N+2
  • For every 31-to-50-yard touchdown pass in Year N, expect 0.33 touchdowns in Year N+2
  • For every 50+ yard touchdown pass in Year N, expect 0.33 touchdowns in Year N+2

If a team throws touchdowns from inside the red zone, that reveals an offensive philosophy that is good for your fantasy quarterback. On the other hand, 21+ yard touchdowns might make the highlight feels, but are very unpredictable from year to year. What does that mean for 2013?

You can view the full article here.

{ 6 comments }

Bambi shouldered much of the Chargers passing offense.

Bambi shouldered much of the Chargers passing offense.

Seven years ago, Doug wrote this post analyzing wide receivers by team receiving yards. That post was overdue for an update for three reasons: (1) it was written seven years ago; (2) Doug only went back to 1978, while we now can go back to 1932; and (3) I think using Adjusted Catch Yards (which gives receivers 5 additional yards for every reception and 20 additional yards for every touchdown) is better than just using receiving yards.

For every year of every receiver’s career, I computed the percentage of his team’s Adjusted Catch Yards that he accounted for. I then averaged together each receiver’s 6 best six seasons according to that metric, and ignored all wide receivers who have played in fewer than six seasons. The results are listed below for the 161 receivers to hit the 25% mark, along with the six years selected for each receiver. As always, you can use the search box to find your favorite receiver, and the table is sortable, too.
[continue reading…]

{ 10 comments }

Smith throws a pass in between checking twitter.

Smith throws a pass in between refreshing Twitter.

As Jason Lisk has pointed out, quarterbacks drafted first overall tend to be much more successful than other quarterbacks, even those drafted just a few picks later. If a quarterback is an elite prospect — think John Elway or Peyton Manning or Andrew Luck (the Colts got three of those for one Jeff George) — he’ll go first overall, while lesser-skilled quarterbacks might get “overdrafted” because of the position they play. There are counter-examples, of course — think Matt Ryan and Joe Flacco in 2008 — but I agree with Jason on the general theory.

One could argue that if you group together all quarterbacks drafted in the first three rounds (after removing the top five or ten picks), you won’t find any significant relationship between draft slot and performance. That’s not where this post is going, though. Instead I’ll take a narrower view and note that Geno Smith became the 44th quarterback drafted in the second half of the first round or the first half of the second round since 1978. Those cut-offs should give us a good look at quarterbacks ignored by teams picking in the top half of the first round but quarterbacks who were otherwise good enough to be drafted relatively early. This analysis generally applies to EJ Manuel, too, although he technically misses the cut-off as the 16th pick of the first round. Once we leave out the quarterbacks drafted since 2009 — Brandon Weeden, Andy Dalton, Colin Kaepernick, Tim Tebow, Jimmy Clausen, Josh Freeman, and Pat White — we’re left with 36 quarterbacks.

The table below shows each of those quarterbacks, along with the year they were drafted, the round, the overall pick, and the team that selected them. How did they turn out? I’ve included their number of seasons starting, number of games and games started, career passing yards and passing touchdowns, and also their number of Super Bowl wins, Super Bowl appearances, and Pro Bowls. The final row shows the median for each category (and for the last three columns, the average). Obviously this will shortchange some of the active quarterbacks, but you get the general idea.
[continue reading…]

{ 2 comments }

Last night, I recorded a podcast with my fellow Footballguys staffers Sigmund Bloom and Matt Waldman. You can listen to it here.

{ 4 comments }

Woodson forces a key incompletion.

Woodson forces a key incompletion.

Charles Woodson is back in Silver and Black. Woodson was drafted by Oakland with the 4th pick in the 1998 Draft and had a very good eight-year run with the Raiders. But he saw experienced even more success with the Packers, and the two biggest highlights of his career — winning the AP Defensive Player of the Year Award in 2009 and Super Bowl XLV — came during his time in Green Bay. Woodson has had a star-studded career, beating Peyton Manning for the Heisman Trophy in 1997 and being selected to eight Pro Bowls in fifteen years in the NFL.

Now the real question? Where does Woodson rank among players who returned to their original team? I’m going to institute a five-year rule on the amount of time that must be spent away from the first franchise, which both narrows down the list and meets the spirit of the post. Otherwise we’ll have to include people like Jason Taylor was in Miami from 1997 to 2007, Washington in 2008, Miami in 2009, the Jets in 2010, and the Dolphins again in 2011. Instead, the list will be dominated by one franchise, which holds my top three spots. See if you can figure it out before you get to the bottom. And my apologies for not putting this in a slideshow.

#10: Herschel Walker, Dallas Cowboys (1986-1989; 1996-1997)

Walker is remembered for the Herschel Walker trade, which helped the Cowboys win the Super Bowl in 1992, 1993, and 1995. Walker returned in ’96, but alas, Dallas’ window had already been closed by then. It’s a shame that Walker’s production is not how his career is defined, because he was a Hall of Fame caliber back. After winning the Heisman Trophy in 1982, Walker joined the USFL and led the league with 1,812 rushing yards in 1983. Two years later, Walker had an even more dominant season for the New Jersey Generals: he rushed for 2,411 yards and 21 touchdowns and caught 37 passes for 467 yards. Walker then joined the Cowboys and gained 5,199 yards from scrimmage in his first three years, the second highest total in the league over that span behind Eric Dickerson. That prompted the Herschel Walker trade to the Vikings, where Walker did not prove to be the player to put the Vikings over the top in the NFC. Walker spent time with the Eagles and Giants before a 34-year-old Walker joined the Cowboys for two throwaway seasons.

#9: Earnest Byner, Cleveland Browns (1984-1988; 1994-1995)
[continue reading…]

{ 11 comments }

Wherefore Art Thou Fullback?

No average fullback.

No average fullback.

When you think of the fullback in today’s game, you probably think of a player like Vonta Leach, widely regarded as the best blocking back in the NFL. There are also the H-Back/receiving fullback types, like Marcel Reece or James Casey, and the rushing fullbacks like Le’Ron McClain, Jacob Hester, and Mike Tolbert. And it’s the fullbacks who double as goal line threats like John Kuhn and Jed Collins who get the most attention from fantasy players. But the fullback position was not always so specialized.

In fact, fullback used to be the glamor spot in the backfield, and that’s the position played by Marion Motley, Dan Towler, Tank Younger, Joe Perry, Alan Ameche, John Henry Johnson, Rick Casares, and the great Jim Brown. Jim Taylor and Paul Hornung both played fullback in Green Bay, while Keith Lincoln and Cookie Gilchrist were great fullbacks in the AFL. In 1966, Minnesota fullback Bill Brown led the NFL in carries. That wasn’t unusual, as fullbacks were key parts of rushing attacks in that decade: the four leading rushers of the ’60s — Jim Brown, Jim Taylor, Don Perkins, and Dick Bass — were all fullbacks. In 1965, fullback Tom Nowatzke went 4th overall in the AFL Draft while Ken Willard (a future four-time Pro Bowler) went second overall in the NFL Draft… just ahead of Dick Butkus and Gale Sayers.

The ’70s were dominated by great fullbacks, as future Super Bowl MVPs Larry Csonka, John Riggins, and Franco Harris were among the game’s best players. And while lacking in star power, Sam Cunningham, Mark van Eeghen, and Pete Johnson were all Pro Bowl-caliber players and key parts of their team’s offenses, too. As the passing game opened up after 1978, the role of the fullback changed. William Andrews was the throwback, but Roger Craig and James Wilder entered the league as fullbacks at a time when the position was evolving into a more specialized role, and had their best seasons after switching to halfback. In Wilder’s case, Tampa Bay switched to a two-tight end offense to get Jerry Bell and Jimmie Giles on the field (and removing running back Mel Carver from the field was an added bonus). For Craig, he played fullback when he was joined in the backfield with Wendell Tyler and Joe Cribbs and halfback when Tom Rathman replaced them.

[continue reading…]

{ 9 comments }

The Most Pass-Happy Coaches in NFL History

Belichick checks to see where he is on the list.

Belichick checks to see where he is on the list.

Yesterday, I looked at the most pass-happy active head coaches and offensive coordinators in the NFL. If you’ve been a loyal reader of my previous posts on Game Scripts, you understand the methodology I’ve used today to grade each coaches. The quick summary is I’ve come up with the term “Game Scripts” to determine the average points margin over each of the 3600 seconds in each game; from there, I also came up with Game Scripts scores for each season.  If you then take each coach’s pass/run ratio, adjust for the league average pass/run ratio, and then adjust for Game Scripts, then you can determine each coach’s passing identity.  I’ve done this for every season since 1940.

The table below lists the 252 coaches I have in my database who have been either a head coach or an offensive coordinator for at least four seasons. I suggest using the search box to find your favorite coaches, but as always, all columns are sortable, too. In the table below, the number of HC/OC seasons includes all seasons, but the games, wins, losses, ties, winning percentage, and wins over .500 columns all include only the coach’s records as a head coach. The Game Script column shows each coach’s average Game Scripts average over each season, while the “P/R” column does the same for pass/run ratio.  The next three columns are all indexes centered around 100. The “SCRIPT” column is the Game Scripts rating, the “PASS” column is the Pass/Run Ratio rating, and the Pass Identity column is a combination of the two columns. (You can read some of the other Game Scripts articles for more explanation).  Based on his time in Green Bay with Aaron Rodgers, Joe Philbin comes in as the most pass-happy coach, but that number seems likely to decline the longer he coaches. George Seifert built his reputation as the defensive coordinator for the 49ers, but having Joe Montana, Steve Young, and Jerry Rice turned him into a pass-friendly coach. As for the next two men on the list, modern NFL fans need no further explanation.
[continue reading…]

{ 5 comments }

Which coaches are the most pass happy?

Mike  Smith checks the score, calls for a pass.

Mike Smith checks the score, calls for a pass.

One reason I came up with the concept of Game Scripts was to identify the most pass-happy coaches. Remember, a team’s Game Script score is simply their average scoring differential over each second of every game. Last year, the Falcons were the most pass-happy team in the NFL after adjusting for Game Scripts; Atlanta had the 5th highest Game Script (average lead of 3.6 points) and the 7th highest Pass/Run Ratio (63.0%). To put that in perspective, none of the other top 16 teams in Game Scripts had a Pass/Run Ratio of even sixty percent. The Falcons used to be run-heavy, of course, but as Michael Turner aged while Matt Ryan, Julio Jones, and Roddy White matured, they’ve become a passing team.

There will be 64 head coaches and offensive coordinators in 2013; I went back and looked at every season those coaches were either head coaches or offensive coordinators in the NFL. [1]At least, according to my database. I won’t have missed any head coaching years, but it’s possible I’ve missed some seasons where a coach was also an offensive coordinator. Two head coaches — Gus Bradley in Jacksonville and Chip Kelly in Philadelphia — have never been a head coach or offensive coordinator at the NFL level. In addition, the following seven offensive coordinators will be entering those roles for the first time, too: Harold Goodwin (Arizona), Nathaniel Hackett (Buffalo), Adam Gase (Denver), Pep Hamilton (Indianapolis), Jedd Fisch (Jacksonville), Doug Pederson (Kansas City), and Dowell Loggains (Tennessee). The table below shows the career Game Scripts averages, Pass/Run Ratios, and Pass Identities for the other 55 head coaches/offensive coordinators entering 2013.

[continue reading…]

References

References
1 At least, according to my database. I won’t have missed any head coaching years, but it’s possible I’ve missed some seasons where a coach was also an offensive coordinator.
{ 2 comments }

Over at Footballguys.com, I analyzed how the fantasy value of quarterbacks, running backs, wide receivers, and tight ends have changed since 1990. The NFL is a very different beast than it was 23 years ago, but you might be surprised to see what that means for fantasy football. To measure value, I examined the VBD curves for each of the four major positions in fantasy football.

For those unfamiliar with VBD, you can read Joe Bryant’s landmark article here. The guiding principle is that the value of a player is determined not by the number of points he scores but by how much he outscores his peers at his particular position. This means that in a league that starts 12 quarterbacks, each quarterback’s VBD score is the difference between his fantasy points and the fantasy points scored by the 12th best quarterback. The cut-offs at the other positions are 12, 24, and 36, for tight ends, running backs, and wide receivers, respectively.

The NFL in 2013 won’t closely resemble how the league looked in 1990, but what does that mean for fantasy football? To determine that, we need to see if VBD has evolved with the rest of the football statistics. Let’s start with a graph displaying number of fantasy points scored by the last starter at each position since 1990. As you can see, quarterback scoring has risen significantly over the last two decades, and the production of the 12th tight end has nearly doubled over that time period.

Worst Starter Since 1990

You can see the full article here.

{ 4 comments }

Longest Streaks without a 1,000-yard rusher

Two weeks ago, I looked at the longest streaks where a team failed to have a player rush for 100 yards. Richie asked me if I could run the numbers on the longest streaks without a 1,000-yard rusher. The longest active streak in the NFL belongs to the Detroit Lions, who have not boasted a 1,000-yard rusher since Kevin Jones rushed for 1,133 yards as a rookie in 2004. Will Reggie Bush or Mikel Leshoure end that streak in 2013? Probably not.

It’s hard to look at these streaks across NFL history. For example, New York entered the NFL in 1925 and no Giant rushed for 1,000 yards until Ron A. Johnson in 1970. The Lions didn’t have a 1,000-yard rushing in their first 41 years, either. But we can look at the longest streaks that starter after the AFL-NFL merger. The modern Lions are the 12th team to go eight straight years without a 1,000 yard rusher over the last 43 years. As the longest streak? Well now we know why Miami drafted three running backs in consecutive rounds in 1996.

TeamFirst YrLast YrYrsStreak Breaker
MIA1979199517Karim Abdul-Jabbar
CLE1986200416Reuben Droughns
GNB1979199416Edgar Bennett
NYG1973198412Joe Morris
MIN1982199110Terry Allen
NOR1990199910Ricky Williams
NYJ1986199510Adrian Murrell
KAN199220009Priest Holmes
RAI198619949Harvey Williams
DET200520128--
DET197219798Billy Sims
NYJ197619838Freeman McNeil
PIT198419918Barry Foster

Insert obligatory Dan Marino comment here.

{ 2 comments }

Green Bay didn’t use a first round pick on a running back, but the Packers did spend a second round pick on Alabama’s Eddie Lacy and a fourth round pick on UCLA’s Johnathan Franklin.  How much weight should we put on draft status when one team drafts two running backs just a couple of rounds apart?  One school of thought is that the Packers liked both players and are maximizing their odds of finding a star; another is that Green Bay prefers Lacy and wants him to win the job, since he was their first choice.  Here’s another thing to consider, courtesy of my good buddy Sigmund Bloom: the Packers traded down to grab Lacy and traded up to draft Franklin, indicating that perhaps the Packers were higher on Franklin than you might think.

How rare is it for teams to double dip at the running back position like this? That depends on how you want to categorize what the Packers did. I think a reasonable comparison would be to look at all teams that:

  • Did not draft a running back in the first round but drafted one in the second or third rounds (this excludes combinations like Stepfan Taylor and Andre Ellington); and
  • Then drafted a different running back within the next two rounds

Since 1970, only 34 teams have met those criteria, meaning this is a strategy employed roughly three times every four years. In three instances, a team drafted three running backs that met those two criteria, and we’ll deal with them at the end of this post. I’m going to exclude three teams that drafted fullbacks after selecting halfbacks, as the 2008 Lions (drafted Jerome Felton after Kevin Smith), 2003 Ravens (Ovie Mughelli after Musa Smith), and 1999 Dolphins (Rob Konrad after J.J. Johnson) don’t really fit the intent of the post. That leaves us with 28 pairs of running backs. The table below lists each pair. On the left, you will see the first running back drafted, his round and overall pick, his rookie rushing yards, his rookie fantasy points total (using 0.5 points per reception), and his career rushing yards; on the right, the same information is presented for the second running back drafted. The far right column shows the difference between the two players in terms of fantasy points during their rookie year. For example, Stevan Ridley scored 41 more points than Shane Vereen in 2011, even though the Patriots drafted Vereen first.
[continue reading…]

{ 4 comments }

How bad were the Chiefs last year?

  • Kansas City went 2-14, tied for the worst record in the league with Jacksonville. Since the Chiefs faced an easier schedule, they received the first pick.
  • With an Simple Rating System score of -14.0, Kansas City had the worst SRS rating in the league. They ranked 32nd in points scored and 25th in points allowed, leaving them 32nd in points differential. With a slightly easier than average schedule, that left them 32nd in the SRS, too.
  • The Chiefs ranked in the bottom three in both NY/A and NY/A allowed.
  • With a -24 turnover differential, K.C. tied several other teams, including the 2012 Eagles, for the third worst turnover differential since 1978.
  • Brian Burke ranked the Chiefs 31st overall, 31st on offense, and 31st on defense, just edging out the Jaguars (who ranked 32nd on offense and 30th on defense).
  • Kansas City finished 32nd in Aaron Schatz’s efficiency rankings, as Football Outsiders ranked them 31st on offense, 30th on defense, and 22nd on special teams.

[continue reading…]

{ 9 comments }

Twenty quarterbacks started all sixteen games last season:

Mark Sanchez started 15 games for the Jets, but was benched for the week 16 game against the Chargers.  Carson Palmer (ribs/chest) and Brandon Weeden (shoulder) were each injured in week 16, causing them to sit out week 17 (although Weeden probably could have played if the game meant anything.) In addition, Jay Cutler (concussion) and Robert Griffin III (knee) each missed one — but only one — game due to injury. [1]Griffin was on the injury report twice for head injuries but did not miss a start due to concussions.  As for the other seven teams:
[continue reading…]

References

References
1 Griffin was on the injury report twice for head injuries but did not miss a start due to concussions.
{ 2 comments }