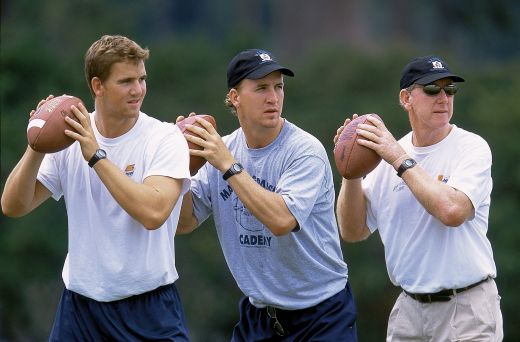
Can you spot the GOAT?
Super Bowl XLVIII was the nightmarish end to the dream season had by Peyton Manning and the Broncos. After the greatest scoring season in NFL history, Denver’s high-powered offense was held to just 8 meaningless points against one of the greatest defenses in NFL history. Great players have been having bad games on the biggest stages since the beginning of sports. But the NFL world has a unique reaction when that player is Manning; for him, every loss is yet another building block on his Narrative(TM).
When Tom Brady leads the greatest scoring offense in NFL history to 14 points against a defense that allowed 22 points per game during the regular season, it does not become part of his narrative. When Joe Montana leads the 49ers to just three points in back-to-back playoff losses to the Giants, those games are pushed to the footnotes section of his biography. When the favored Colts were shut out by the Browns in the 1964 NFL title game, that goose egg did not become indelibly intertwined with the legacy of Johnny Unitas. Our memory of Otto Graham‘s 1953 season is that it was one of the greatest quarterback seasons in football history, even if he went 2/15 for 20 yards with no touchdowns and two interceptions in a losing effort in the NFL title game. We remember Sammy Baugh as one of the greatest players ever, forgetting that he was the face of an embarrassing 73-0 loss to the Bears in the 1940 championship game. For most quarterbacks, ugly playoff performances are quirks of history; for Manning, they become bullet points in a character assassination.
Mike Tanier already discussed the silliness that surrounds Manning’s career. Detractors have played “move the goal posts” for nearly two decades with Manning, beginning with his high-profile losses in college. Even after Manning seemingly silenced the last anti-Manning argument, his detractors just invented a new game.
He led his team to a Super Bowl victory. He began to reliably beat Brady’s Patriots. Instead of installing Manning’s legacy behind shatterproof glass, we just juggled harder. One Super Bowl victory, plus another loss, simply isn’t enough for this particular player! The bar for true greatness is multiple Super Bowl victories, an easy standard to set if you are a Patriots fan or a television analyst who shared a locker room with Troy Aikman! It’s a wonder we did not go back and retroactively demand an Orange Bowl or two.
Today’s post is not written to make you feel bad for Peyton Manning. You should not. But the question that has been repeatedly asked over the last three weeks – What is Peyton Manning’s legacy? – is one that is easy to answer. His legacy is that he’s the greatest quarterback ever. That’s not a very exciting answer in the world of #HOTTAKES, but it’s the truth.
We’re past the point of debating how valuable Manning has been in the regular season. Two years ago, I concluded that Manning was the greatest statistical quarterback in NFL history, and that’s before he even donned a Broncos uniform. That analysis didn’t consider how the Colts fell from Super Bowl contender to worst team in the league in the span of one Manning injury. That analysis didn’t consider that in his first year with the Broncos, Denver set the record for the largest year-to-year increase in completions, because that result was preordained. That analysis isn’t based on the MVPs, the All-Pros, the Pro Bowls, or anything but the numbers. I’ll re-run the study this summer, but the only question is how much farther ahead of the competition Manning’s increased his lead.
Attacking Manning’s numbers is a fool’s errand. As a result, as Manning’s regular season production has taken on mythic proportions, the anti-Manning crowd has begun to use that success as a sword. He’s the best regular season quarterback of all time, they will say, emphasizing those two words as if they were agents of disease.
Manning’s teams have struggled in the playoffs. Manning has struggled some, too, although not nearly as much as some believe. Is it surprising that Manning has an 11-12 career playoff record? I suppose so, because we’re at the point that literally every single time Manning loses a game we are surprised. Over the last nine seasons, there have been just seven games where Manning’s team lost as an underdog. A Manning loss is an event, a mystery to be solved, a bat signal for the Manning truthers to emerge.
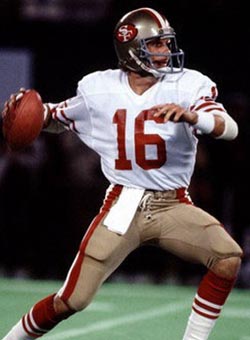
Some — perhaps many — will argue that Manning is not the greatest quarterback ever. Instead of Manning, that title should be reserved for Montana, or Brady, or Unitas. With Montana, the argument always goes back to the #4RINGZ (although you rarely hear about Bart Starr and his #5RINGZ). As a football historian, I find it disheartening that Montana is mostly remembered as a four-time champion, because he was one of the greatest regular season quarterbacks ever. You never hear Montana referred to as one of the greatest statistical quarterbacks or one of the greatest regular season passers, because those are Naughty Words. But Montana was. And he should be lauded for that.

One of the greatest regular season quarterbacks ever.
The Montana over Manning argument is simple: Montana is better because he went 4-0 in Super Bowls, while Manning is 1-2. Such hard-hitting analysis ignores the fact that in each of the four seasons Montana won the Super Bowl, the 49ers defense ranked in the top three in either yards allowed, points allowed, or both. For Manning, “only one Super Bowl” is a scarlet letter. The common argument goes, “How could the greatest quarterback ever only win one Super Bowl?” That’s a fair question to ask, but we know the answer: the playoffs are a single elimination tournament where random events happen. Montana threw three interceptions and lost a fumble in the 1981 NFC Championship Game, but the 49ers still won. In Super Bowl XXII, Montana nearly lost the game with a pass that hit
Lewis Billups in the hands, but the defensive back couldn’t catch the ball. Montana was a better quarterback in the playoffs than Manning, but he also lost twice as 8+ point favorites. In one of those games, he was benched. Montana may be the second greatest quarterback of all time, but his resume is not beyond reproach.
“How could the greatest quarterback of all time win just one championship?” is Manning’s burden to bear, but it’s not hard to frame anti-Montana questions, either. After all, why did he only win two MVP trophies? That question is no more — and no less — fair than the Manning one. How great could Montana have really been if he did not win a single MVP trophy in his first ten seasons? After finally winning the award in back-to-back seasons, his replacement won the same award twice in the next five years? Shouldn’t we expect the greatest quarterback ever to be the best player in his league more than twice? Let Montana win three more MVP awards, and then we can talk about him being better than Manning.
The MVP question isn’t the only one out there. If Montana was so great, how come the Associated Press only named him a first-team All-Pro three times in his career? Shouldn’t the greatest player at his position in NFL history be recognized as the best player at his position more than three times in his career? Manning’s done it seven times! Be named the best player at your position four more times, then talk.
Those who believe Montana or Brady are better than Manning will not be convinced otherwise. I have no interest in yet another Brady/Manning debate. I would not deem it a coincidence that Montana and Brady were coached by Bill Walsh and Bill Belichick, the two best coaches of the last 30 years. I would not be so quick to blame Manning for losing in the Super Bowl, instead of praising him for taking teams coached by Jim Caldwell and John Fox to the big game. Brady, like Montana, has won just two MVPs. He was only a first-team All-Pro selection twice in his career, although he has a good excuse: he was competing with Manning nearly every year.

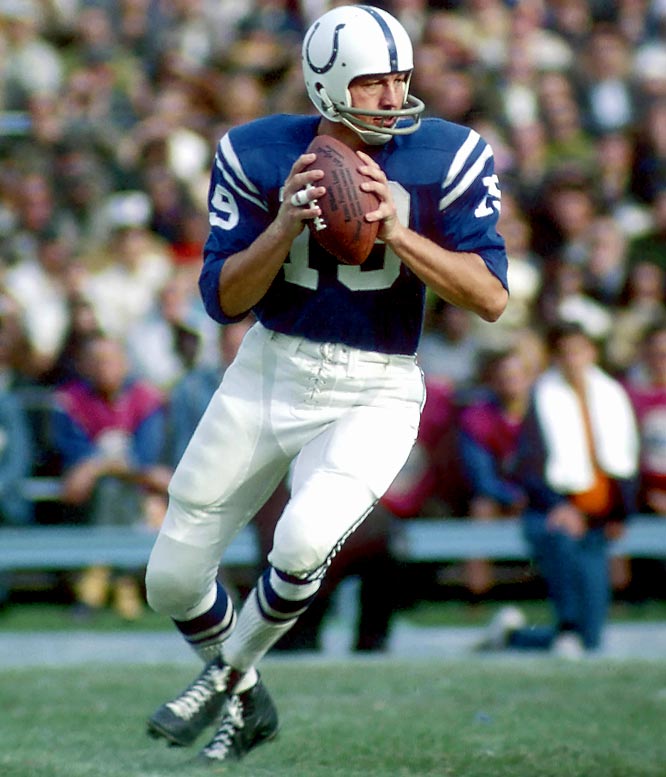
The best quarterback of his era not to win a title in the '60s.
Unitas, as great as he was, doesn’t compare favorably to Manning, because
nobody compares favorably to Manning. Technically, Unitas won three titles, but he left Super Bowl V with an injury while the Colts were trailing, and
Earl Morrall was the quarterback who led Baltimore’s come-from-behind victory. If that ever happened to Manning, there would be riots in the streets before Manning was credited with that win.
As good as Unitas was, nearly every factor points in Manning’s favor. We already know that Manning’s numbers — after adjusting for era — dwarf those of every other quarterback. But other factors tell a similar story. Unitas was a 10-time Pro Bowler and 5-time Associated Press 1st-team All-Pro; those are great accomplishments, but most of those accolades came when the NFL had between ten and sixteen teams, and several franchises employed a quarterback-by-committee approach during that era. Standing out as an elite quarterback was easier back then, but no matter: Manning still has Unitas beat, with 13 Pro Bowls and seven AP first-team All-Pros.
Unitas did not have the sustained success of Manning (he had a pair of down seasons in the middle of his career) nor did his career reach the highest peaks that Manning did in ’04 or ’13. Unitas did not win a single championship in the sixties, and in that era, he was the Manning to Starr’s Brady. Unitas won two titles early and then suffered a long postseason drought. Unitas was a three-time MVP, but that still puts him behind Manning.
Quarterback debates can be silly. We don’t wonder why Barry Sanders never won a Super Bowl. The legacy of Jim Brown wasn’t tarnished even though he didn’t win a playoff game until his second-to-last season. Manning is the greatest quarterback in NFL history. That’s his legacy. He’s earned that label after reaching unparalleled levels of success, by producing at a level well above average, game after game, month after month, season after season. It’s a bit odd that Manning’s teams haven’t had more success in the playoffs, but that’s all it is. Ted Williams never won a World Series, but it doesn’t make him any less of a ballplayer. Even Boston fans can agree with that.
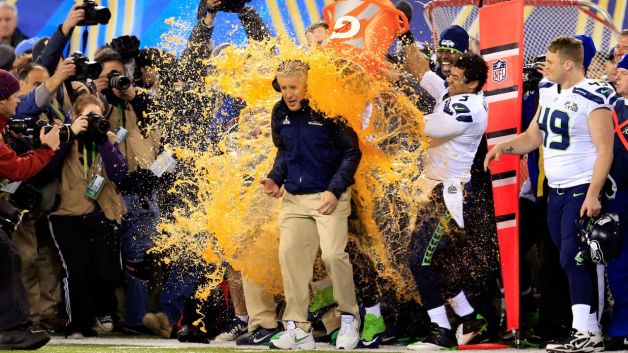
We are told that quarterbacks are different, and that a quarterback is responsible for his team’s success. But constant repetition does not make it so. We’re smart enough to know this; I know we are. We don’t think Russell Wilson is a better quarterback than Manning just because the Seahawks beat the Broncos. But Super Bowl XLVIII just showed that a great team can beat a great quarterback. A great effort by an in all three phases of the game is usually what it takes to beat Manning. Perhaps that is his true legacy, as no quarterback has ever been tougher to beat.