by Chase Stuart
on January 23, 2014

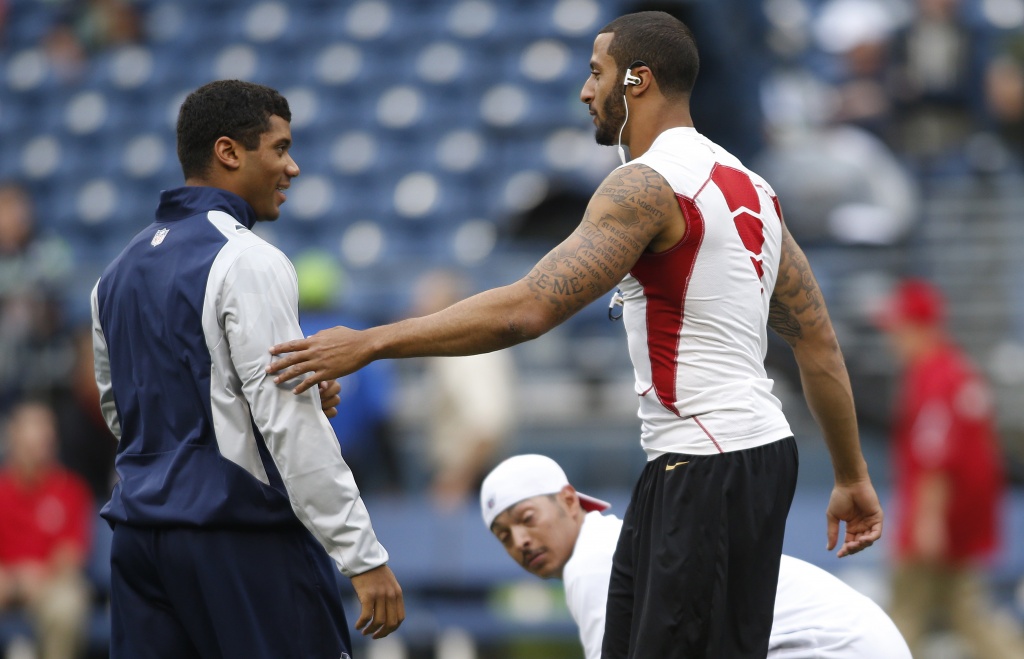
Kaep before he could afford Beats by Dre.
It was a very good year for the NFC West. Seattle is heading to Super Bowl XLVIII, as king of the best division in football. To get to MetLife Stadium, the Seahawks had to defeat the 49ers in the NFC Championship Game, which is only fitting after the scorched-earth run by the division during the regular season. Seattle went 9-1 outside of the division in 2013, losing only in Indianapolis (and 10-1 including the playoffs). The Arizona Cardinals went 8-2 when not facing NFC West opponents, with the only losses coming in Philadelphia and New Orleans. The 49ers went 7-3 (8-3 including playoffs), losing in New Orleans and at home to Carolina and Indianapolis. That means the top 3 teams in the NFC West went 24-6 outside of the division in the regular season, with all losses coming to 10+ win playoff teams.
Unlike the rest of the division, the Rams actually beat both New Orleans and Indianapolis. But St. Louis lost to Dallas, Carolina, Tennessee and Atlanta (in week 2), giving the Rams a 6-4 record outside the NFC West. All told, the division finished a remarkable 30-10 in non-division games this year. That’s tied for the 2nd best mark since 1970, and tied for the best performance since realignment in 2002. Wait until Richard Sherman hears this news.
[continue reading…]
Tagged as:
NFC West
{ }
by Chase Stuart
on January 22, 2014
In September 2012, Neil wrote that the NFL playoffs had become more random. And that was three months before Joe Flacco turned into Joe Montana. This year, however, feels like one of the least random playoffs in recent memory. And there’s a good reason for that: it is.
If you know the points spread for a game, you can derive the team’s probability of winning in Excel by using the following formula and typing the spread (with a negative number for the favorite) in cell C2:
=(1-NORMDIST(0.5,-(C2),13.86,TRUE)) + 0.5*(NORMDIST(0.5,-(C2),13.86,TRUE)-NORMDIST(-0.5,-(C2),13.86,TRUE))
Using that formula, the table below shows the winner of each game in the 2013 postseason, sorted in order of ascending pregame win probability. There was only one big upset this year, the Chargers victory in Cincinnati. Conversely, the least surprising outcome was San Diego’s loss in Denver the following week. [continue reading…]
{ }
by Chase Stuart
on January 21, 2014

Who treats the preseason like BS? BS!
On August 17th, Denver traveled to Seattle for each team’s second game of the preseason. Some people think the preseason is meaningless, but I thought it would be worthwhile to rewatch the first half of that game. If you’re interested, there were a pair of good recaps written in August from Field Gulls, the Seattle SB Nation site, and Its All Over, Fat Man!, a Broncos site and friend of the program.
[continue reading…]
Tagged as:
Film Room,
Super Bowl XLVIII
{ }
by Chase Stuart
on January 20, 2014

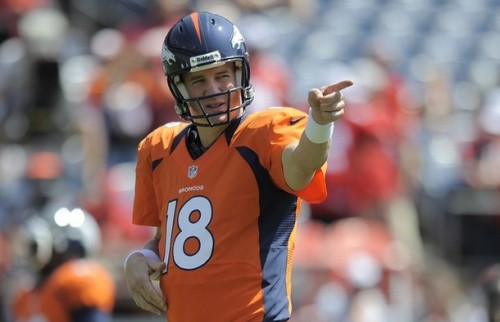
No, Peyton, you're the man.
In 1984,
Dan Marino set an NFL record with 48 touchdown passes, but his Dolphins lost in the Super Bowl. Twenty years later,
Peyton Manning broke Marino’s record, but he lost to the eventual Super Bowl champion Patriots in the playoffs. In 2007,
Tom Brady broke Manning’s touchdowns record, but
he lost in the Super Bowl, too.
When the greatest quarterback seasons of all time are discussed, these three years dominate the discussion. And with good reason. But if you include the playoffs — and frankly, there’s no reason not to include the playoffs — which quarterback produced the greatest season of all time? I’m going to stipulate that the greatest quarterback season ever has to end in a Lombardi Trophy, because otherwise, I think we’ll end up back in the world of Marino ’84/Brady ’07/Manning ’04. Of course, now another Manning season has entered the mix: and with a Super Bowl win, Manning’s 2013 should and would be remembered as the greatest quarterback season of all time.
So, the question becomes, which season would he knock off the top rung? I think there are six seasons that stand out from the rest, based on regular and postseason performance.
Honorable Mention [continue reading…]
Tagged as:
Dan Marino,
Joe Montana,
Kurt Warner,
Peyton Manning,
RANY/A,
Steve Young,
Tom Brady
{ }
by Chase Stuart
on January 19, 2014
The table below shows each Super Bowl champion since 1970 and its rank in various categories. At the top, I’ve included an average of the ranks of the teams over the last 10 years and since 1970, and each team is hyperlinked to its Pro-Football-Reference team page. The categories in this first table are record, points for, points allowed, Pythagenpat record, offensive yards, defensive yards, yards differential, offensive pass yards, offensive rushing yards, defensive passing yards (i.e., passing yards allowed), and defensive rushing yards. [continue reading…]
Tagged as:
Super Bowl
{ }
by Chase Stuart
on January 18, 2014

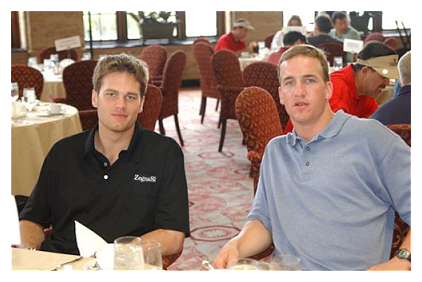
These two men look important.
Someone needs to say it. I know, I know, it’s
Manning/Brady XV. But someone needs to remind people that
Peyton Manning threw 30 more touchdown passes than
Tom Brady in 2013. He threw for over 1,000 more yards. He threw one less interception. He was sacked 22 fewer times. And did I mention that he threw 30 more touchdowns? If you’re not into stats,
Brian Burke has Manning providing 5.83 extra wins this year, compared to 3.82 for Brady. At some point, the analysis should move beyond “a game between two of the greatest quarterbacks ever” and recognize these things, right?
Let’s cut off the Patriots fans before they can begin typing in Boston accents: the fact that Manning’s 2013 numbers dwarf Brady’s 2013 numbers does not mean Manning’s career >>> Brady’s career. And it doesn’t even mean (although it strongly implies) that Manning was a better quarterback in 2013 than Brady was. There’s no doubt that Denver’s supporting cast, at least on offense, is much better than New England’s. Manning has Brady’s favorite target from last year, Wes Welker, along with Demaryius Thomas, Eric Decker, and Julius Thomas. Brady has dealt with a very inexperienced set of receivers following massive turnover. The Patriots have had to replace Welker, Rob Gronkowski, Aaron Hernandez, and Danny Woodhead with Julian Edelman, 12 games worth of Danny Amendola, 8 games of Shane Vereen (although he’ll be around on Sunday), 7 games of Gronkowski (he won’t be around on Sunday), and Aaron Dobson and Kenbrell Thompkins. Each quarterback is down a star tackle (Ryan Clady, Sebastian Vollmer) but has an All-Pro caliber guard (Louis Vasquez, Logan Mankins).
But whatever the reason for the discrepancy, one conclusion is inescapable: this is not a meeting of equal passing attacks. On one hand, you have one of the greatest passing offenses ever. On the other, you have an above-average passing offense. And that’s the real story. The Broncos averaged 10 more points per game than New England, while Manning (as representative of the Denver passing attack) averaged 2.75 more adjusted net yards per attempt than Brady (as representative of the Patriots passing attack). [continue reading…]
Tagged as:
Broncos,
Patriots,
Peyton Manning,
Tom Brady
{ }
by Chase Stuart
on January 17, 2014
It’s Carroll-Harbaugh X! Okay, the Whats Your Deal Bowl may not have quite the hype of Brady/Manning XV, but don’t tell that to folks on the West Coast. Pete Carroll and Jim Harbaugh are longtime rivals who have managed to alienate 31 other fanbases in the NFL. For the record, Harbaugh holds a 6-3 record over Carroll, including a 4-2 mark in the NFL. Of course, Carroll’s Seahawks won the last two games at CenturyLink Field, the site of the NFC Championship Game.
Let’s begin our preview by analyzing each team’s passing offense:
Sadly, this post is not sponsored by beats by Dre.
Picking between Colin Kaepernick and Russell Wilson feels like an exercise in hair-splitting. Over the last two seasons, these two have nearly identical passing numbers, ranking 4th and 5th in ANY/A. Kaepernick was slightly better last year, Wilson slightly better this year, and then Kaepernick has been better in the playoffs. By ANY/A standards, this is a complete wash.
What about the weapons? That’s one area where it at least appears like the 49ers have the edge. Michael Crabtree, Anquan Boldin, and Vernon Davis are legitimate stars who combine to give Kaepernick three versatile weapons on every play. A healthy Percy Harvin changes things for Seattle, but with Harvin declared out for the game, Golden Tate, Doug Baldwin, and Zach Miller represent a clear downgrade from the 49ers bunch.
But remember, when we look at the passing statistics of Kaepernick and Wilson, those numbers already incorporate the quality of each quarterback’s targets. After all, a quarterback’s ANY/A or NY/A averages are not mere reflections of the passer, but of the passing offense as a whole. On the other hand, Kaepernick hasn’t had those three players together for most of his career. In fact, the trio has only been available in 7 of Kaepernick’s 28 career starts. In 10 starts, only Crabtree and Davis were on the team, and in another 10, Kaepernick had just Boldin and Davis. The table below shows Kaepernick’s numbers as a starter depending on the availability of his three weapons: [continue reading…]
Tagged as:
49ers,
Colin Kaepernick,
Jim Harbaugh,
Pete Carroll,
Russell Wilson,
Seahawks
{ }
by Chase Stuart
on January 16, 2014
It’s not much of a stretch to say that the Patriots, Broncos, 49ers, and Seahawks, and are four of the best organizations in the NFL. Over the last two years, these four teams are the only to win 23 games in the regular season or 26 games if you include the playoffs. In the salary cap era, being an excellent team means managing the salary cap well. And, broadly speaking, managing the cap well means finding good values for cheap and making sure the players you spend a premium on deliver commensurate production.
So is that true for New England, Denver, San Francisco, and Seattle? The invaluable Jason Fitzgerald of Over the Cap has salary cap data for each team in the league, which can answer half the problem. But how do we measure production? I decided to use the ratings from Pro Football Focus, since the website provides a rating of every player on every team (although I excluded special teamers from my analysis today).
One note about PFF data, which comes from Nathan Jahnke, a writer at the website. As he explained to me, PFF’s ratings are not necessarily designed for comparisons across positions. For each position, zero is average, but the magnitude a player’s rating can get to is somewhat dependent on the position they play. For example, PFF has never had a safety over a grade of +30, while five 3-4 DEs hit that mark in 2013. For my purposes today, this is not a big concern — it just means view the graphs with an understand that these are not designed to be the perfect way to compare a player. But in general, I think they work well. (And, of course, don’t think that just because Brandon Mebane has a higher rating than Russell Wilson that it means PFF thinks Mebane is a more valuable player.)
To avoid people using my graphs to scrub data and steal the hard work put in by by Over The Cap and Pro Football Focus in assembling the salary cap data and player grades , I have decided not to label either axis with salary information or player ratings. Just know that the X-axis (that’s the horizontal one) is for salary, and players on the left are cheap and players on the right are expensive. The vertical or Y-axis shows the PFF grades from worst (on the bottom) to best on top). Note: to compare across teams, I have used the exact same dimensions for both axes across all four graphs. [continue reading…]
Tagged as:
49ers,
Broncos,
Patriots,
Salary Cap,
Seahawks
{ }
by Chase Stuart
on January 15, 2014
The Super Bowl is still 18 days away, but that doesn’t mean it’s too early to write a preview of The Big Game. In fact, only suckers wait until the conclusion of the conference championship games to write their preview article. So prepare yourself for your first Super Bowl XLVIII Preview:
Super Bowl XLVIII Promises To Be A Classic
The NFL was at its best on championship Sunday, providing us with a delicious appetizer in preparation of Super Bowl XLVIII. In the early game, Tom Brady and Peyton Manning staged yet another all-time classic, and then Russell Wilson and Colin Kaepernick gave us a glimpse of the next great quarterback rivalry in the late game. One thing’s for sure: after two great battles following yet another remarkable season, the two best teams in the league will be meeting this year at MetLife Stadium.
After winning games in Denver and Seattle to get here, I don’t think either team is going to be afraid of the elements in two weeks. You will hear many doomsday predictions for the weather in this game, but truth be told, neither team is at a disadvantage in the first cold-weather Super Bowl. Many narratives will be written about this year’s game, so let me be the first to remind you that this game features [a matchup of two former Jets head coaches in the stadium where the Jets play their home games/rematch of Super Bowl XXIV/Brady against the team he grew up loving/the teams from the only two states in the country to legalize recreational marijuana/]!
One topic of discussion you’ll certainly hear this week: if victorious, many would conclude that OLDQB is the greatest quarterback in NFL history. With multiple MVP awards and multiple Super Bowl rings on top of some pretty incredible statistical accomplishments, it would be hard to argue otherwise. And consider: [Manning would become the first quarterback to win Super Bowls with two different teams and the first quarterback to win the Super Bowl and lead the league in passing yards in the same season./Brady, who win or lose will to become the first quarterback to ever start in six Super Bowls, surpassing John Elway, would join Joe Montana and Terry Bradshaw in the four ring club with a win. Brady would also become the only quarterback to ever win Super Bowls more than a decade apart, an incredible accomplishment.] And while the stakes may not quite be the same for YOUNGQB, a Super Bowl victory would perhaps be the foundation of a Hall of Fame career.
[continue reading…]
{ }
by Chase Stuart
on January 14, 2014

Harrison actually caught this pass.
In a couple of weeks, the newest class of the Pro Football Hall of Fame will be announced. Only
five modern-era wide receivers have been selected enshrinement on their first ballot:
Jerry Rice,
Paul Warfield,
Steve Largent,
Raymond Berry, and
Lance Alworth. This year, in his first year of eligibility,
Marvin Harrison is one of 15 finalists for the Pro Football Hall of Fame. I suspect the majority will view Harrison as a first-ballot Hall of Famer, but there are a few minority voices who disagree.
As best as I can surmise, there are three primary reasons why Harrison shouldn’t be selected in 2014. Two of those reasons can be addressed rather easily, but let’s start with the more complicated issue to analyze.
Harrison’s numbers are inflated because of Peyton Manning
Jerry Rice is the greatest wide receiver of all time. Rice was probably better at his position than any football player has ever been at theirs. Rice might be the most dominant sportsman of his generation. Rice probably isn’t in the discussion of greatest athletes in the history of mankind, which is about the only negative thing I’m willing to say about him. All of that is important background to say, being worse than Jerry Rice is not a negative, but just a fact of life as a wide receiver.
[continue reading…]
Tagged as:
Colts,
Marvin Harrison
{ }
by Chase Stuart
on January 13, 2014
By all accounts, this was an underwhelming quartet of games played on The Best Weekend in Football. Last year, the division round gave us an incredible Russell Wilson comeback where the Seahawks scored three fourth quarter touchdowns before falling short against the Falcons and the Peyton Manning–Joe Flacco–Rahim Moore classic. Seattle won this year but in boring fashion, and Broncos fans undoubtedly prefer this year’s rendition of Neutral-Zone-Infraction to last year’s heartbreak. In 2011, the 9-7 Giants pulled off the rarest of upsets: outclassing the 15-1 Packers and winning a game as huge underdogs while managing to look like the better team in the process. The day before, Alex Smith lead the 49ers in a home upset over the Saints in one of the more exciting playoff games of our generation. In 2009 and 2010, the brash Jets won road games as heavy underdogs in convincing fashion against the Chargers and Patriots. This was the halcyon era of the Mark Sanchez–Rex Ryan Jets, also known as years 3 and 2 Before The Buttfumble. In 2008, the Ravens (over the Titans), Eagles (Giants), and Cardinals (Panthers) all won as road underdogs. The year before, the Giants shocked the Cowboys before that was our Tony Romo-adjusted expectation, and the Chargers won as 11-point underdogs in Indianapolis preventing a Tom Brady–Peyton Manning upset (no such road bump this year).
In some ways, the results this weekend were a good thing. Perhaps we will remember this as the year the division round of the playoffs felt like eating a salad – a bit unsatisfying at the time, but better for us in the long term. No one would complain about seeing more Andrew Luck — actually, maybe some of us would — but getting an AFC Championship Game of Manning and Brady just feels right. We have become so accustomed to seeing fluky teams like the Chargers make runs that we’ve forgotten that it can be very good when the results match our intuition. Back in April I said that the Patriots and Broncos were on a collision course for the AFC Championship Game, although my reasoning wasn’t exactly spot on (“the key to their success is keeping Rob Gronkowski, Aaron Hernandez, and Danny Amendola healthy, although the Patriots will be fine as long as two of them are on the field.”)
But it’s not as if I had some special insight: as noted by Will Brinson, the 49ers, Seahawks, Patriots, and Broncos were the four teams with the best preseason odds. No one would complain about seeing more from the Saints and Panthers, but I don’t think many would argue with the idea that the 49ers and Seahawks are the two most talented teams in the league. A few years from now, there won’t be much we remember from the division round. But I have a feeling it set up two conference championship games that will be very memorable. [continue reading…]
Tagged as:
49ers,
Broncos,
Chargers,
Chuck Pagano,
Colts,
Panthers,
Patriots,
Ron Rivera,
Saints,
Seahawks
{ }
by Chase Stuart
on January 12, 2014
I’m not going to do it again. This time last year, I thought I wrote a very good preview of the Denver/Baltimore game. I looked at both teams, decided that Denver was much, much better, and ended with this:
I think it’s best not to over think this one.
Prediction: Denver 31, Baltimore 13
A year later, and we’re in the same boat. The Broncos just had another marvelous run, again capturing the #1 seed in the AFC on the back of a spectacular season by Peyton Manning. The opponent looks overmatched, at least on paper: the 2012 Ravens had an Simple Rating System score of +2.9, while the 2013 Chargers are at +2.7. The 2012 Broncos had an SRS grade of +10.1, a number that has risen to +11.4 this year. About the only good thing we could say about the 2012 Ravens (relative to Denver) was that they were getting healthier. About the only good thing we can say about the 2013 (relative to Denver) is that they’re getting hotter. And, I suppose, they’re healthier, too, at least compared to a Broncos team that is missing Von Miller, Ryan Clady, Rahim Moore, and Dan Koppen. So no, I’m not just going to assume Denver will win and move on.
I suppose some of you out there are thinking, “Hey, wait a minute. The Chargers beat the Broncos in Denver in the regular season. Doesn’t that mean something?” Well, tell that to the 1934 Bears, who went 13-0 and beat the Giants in the Polo Grounds in the regular season only to lose 30-13 at that same spot in the playoffs! Okay, presumably Denver/San Diego won’t flip on the shoe selection of the competitors, but the larger point remains: road teams that played a rematch in the playoffs against a team they beat at that same venue in the regular season are just 18-32.
Here’s how to read the table below. In 2010, the Seahawks went on the road to play the Bears after beating them in the regular season, 23-20. Seattle met in Chicago in the Division Round of the playoffs, and the Seahawks were 10-point underdogs. Seattle lost, 35-24.
[continue reading…]
Tagged as:
Broncos,
Chargers
{ }
by Chase Stuart
on January 11, 2014
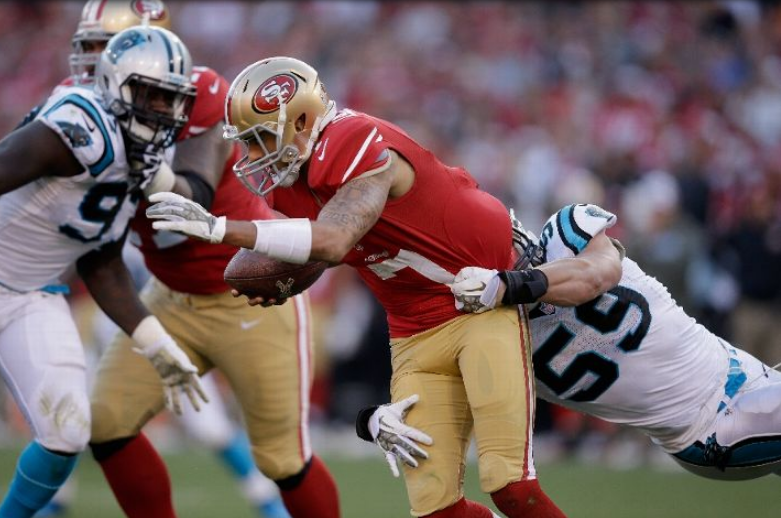
At least 400 total yards were gained in every game this season. When Nick Foles threw 7 touchdowns against the Raiders, Oakland actually out-gained Philadelphia, and the two teams combined for a season-high 1,102 yards that day. On the other end of the spectrum was San Francisco/Carolina I, when the two teams combined for just 401 yards. That first game was essentially the NFL’s version of LSU/Alabama, and I don’t think the rematch will be very different.
When these two teams take the field on Sunday, the opponent will feel familiar for a couple of reasons. One, of course, is because of the week ten match-up. But these teams are also mirror images of each other. Consider:

Kuechly and Kaepernick are just two of the many stars in this game.
Tagged as:
49ers,
Cam Newton,
Colin Kaepernick,
Panthers
{ }
by Chase Stuart
on January 10, 2014
When it comes Patriots/Colts, it’s easy to want to focus on Tom Brady vs. Andrew Luck. Or to marvel at the sheer number of star players these teams have lost in the last 12 months. If you played college in the state of Florida, you’re probably not going to be playing in this game: T.Y. Hilton is the last star standing with Vince Wilfork, Aaron Hernandez, Brandon Spikes, and Reggie Wayne gone. The Patriots also have placed Rob Gronkowski, Sebastian Vollmer, Jerod Mayo, Tommy Kelly and Adrian Wilson on injured reserve, while Devin McCourty and Alfonzo Dennard are both questionable. Also, of course, Brady is probable with a shoulder.
The Colts just put defensive starters Gregory Toler and Fili Moala on injured reserve, adding to a list that already included Wayne, Ahmad Bradshaw, Vick Ballard, Dwayne Allen, Donald Thomas, Montori Hughes, and Pat Angerer. LaRon Landry and Darrius Heyward-Bey are both questionable, and the latter’s injury caused the team to sign ex-Patriot Deion Branch.
All the injuries and changing parts make this a pretty tough game to analyze. So I’m not going to, at least not from the usual perspective. Instead, I want to take a 30,000 foot view of the game. According to Football Outsiders, the Patriots were the most consistent team in the league this season, while the Colts were the fourth least consistent team. Rivers McCown was kind enough to send me the single-game DVOA grades for both teams this season, and I’ve placed those numbers in the graph below with the Colts in light blue and the Patriots in red. The graph displays each team’s single-game DVOA score for each game this season, depicted from worst (left) to best (right). For Indianapolis, the graph spans the full chart, from the worst game (against St. Louis) to the best (against Denver). As you can see, the portion of the graph occupied by New England is much narrower, stretching from Cincinnati to Pittsburgh. [continue reading…]
Tagged as:
Andrew Luck,
Colts,
Normal Distribution,
Patriots,
Tom Brady
{ }
by Chase Stuart
on January 10, 2014

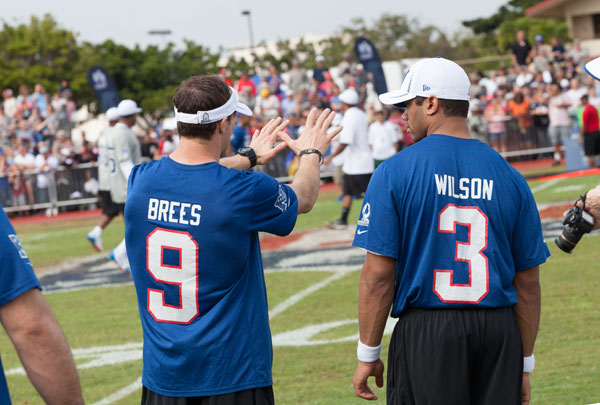
Brees and Wilson scheming to get on an amusement park ride.
On the surface, this does not appear to be a very even matchup. In home games in 2013, Seattle outscored opponents by 15.4 points per game, an average that includes the loss to Arizona. In road games during the regular season, the Saints were outscored by 4.6 points per game. Both of those averages, of course, include Seattle’s
27-point demolition of the Saints in Seattle just six weeks ago. The 20-point difference between Seattle’s average home margin and the New Orleans’ average road margin — which, for brevity’s sake, I’m going to call the “projected MOV” — is very high, even by historical standards. In fact, only 20 playoff games since 1950 featured a game with a larger projected MOV.
The table below shows the 50 playoff games with the largest projected MOV since 1950, measured from the perspective of the home team. For games since 1978, I’ve also shown the pre-game points spread. The largest projected MOV came in 1998, when the Vikings hosted the Cardinals in the playoffs. That year, Minnesota outscored teams by 23.6 points per game at home, while Arizona was outscored by 9.1 PPG on the road. Those numbers combine for a projected MOV for Minnesota of nearly 33 points! The game took place during the division round of the playoffs and the Vikings were 16.5-point favorites. You can click on the boxscore link to see the PFR boxscore for the game, which Minnesota won, 41-21.
| Year | Home | Road | Hm PD/G | Rd PD/G | Proj MOV | Rd | Spread | Boxscore | PF | PA | W/L |
| 1998 | MIN | ARI | 23.63 | -9.13 | 32.75 | D | -16.5 | Boxscore | 41 | 21 | W |
| 1991 | WAS | DET | 22.88 | -7.5 | 30.38 | C | -14 | Boxscore | 41 | 10 | W |
| 1973 | MIA | CIN | 21.86 | -6.71 | 28.57 | D | | Boxscore | 34 | 16 | W |
| 1991 | WAS | ATL | 22.88 | -4 | 26.88 | D | -11.5 | Boxscore | 24 | 7 | W |
| 1999 | STL | TAM | 24.63 | -2 | 26.63 | C | -14 | Boxscore | 11 | 6 | W |
| 1969 | MIN | CLE | 24.29 | -1.86 | 26.14 | C | | Boxscore | 27 | 7 | W |
| 1978 | DAL | ATL | 14.75 | -11.25 | 26 | D | -15 | Boxscore | 27 | 20 | W |
| 1987 | SFO | MIN | 20.29 | -4.13 | 24.41 | D | -11 | Boxscore | 24 | 36 | L |
| 1979 | PIT | HOU | 20.38 | -4 | 24.38 | C | -9.5 | Boxscore | 27 | 13 | W |
| 1950 | RAM | CHI | 23.5 | -0.17 | 23.67 | D | | Boxscore | 24 | 14 | W |
| 2008 | CAR | ARI | 15.38 | -7.88 | 23.25 | D | -10 | Boxscore | 13 | 33 | L |
| 1999 | STL | MIN | 24.63 | 1.38 | 23.25 | D | -7 | Boxscore | 49 | 37 | W |
| 1977 | RAM | MIN | 18.86 | -4 | 22.86 | D | | Boxscore | 7 | 14 | L |
| 1997 | DEN | JAX | 22 | -0.38 | 22.38 | W | -6.5 | Boxscore | 42 | 17 | W |
| 2011 | NOR | DET | 23.25 | 1 | 22.25 | W | -10.5 | Boxscore | 45 | 28 | W |
| 2007 | NWE | JAX | 21.5 | 1 | 20.5 | D | -13.5 | Boxscore | 31 | 20 | W |
| 1996 | PIT | IND | 15 | -5.38 | 20.38 | W | -8 | Boxscore | 42 | 14 | W |
| 1996 | CAR | DAL | 16.5 | -3.75 | 20.25 | D | 3.5 | Boxscore | 26 | 17 | W |
| 1996 | DEN | JAX | 14.38 | -5.88 | 20.25 | D | -12.5 | Boxscore | 27 | 30 | L |
| 1979 | PIT | MIA | 20.38 | 0.25 | 20.13 | D | -9.5 | Boxscore | 34 | 14 | W |
| 2004 | ATL | STL | 6.88 | -12.88 | 19.75 | D | -6.5 | Boxscore | 47 | 17 | W |
| 2011 | GNB | NYG | 18.75 | -0.88 | 19.63 | D | -8 | Boxscore | 20 | 37 | L |
| 2007 | NWE | SDG | 21.5 | 1.88 | 19.63 | C | -14 | Boxscore | 21 | 12 | W |
| 1989 | SFO | MIN | 14.88 | -4.38 | 19.25 | D | -7.5 | Boxscore | 41 | 13 | W |
| 1985 | CHI | RAM | 19.5 | 0.25 | 19.25 | C | -10.5 | Boxscore | 24 | 0 | W |
| 1969 | MIN | RAM | 24.29 | 5.14 | 19.14 | D | | Boxscore | 23 | 20 | W |
| 1969 | DAL | CLE | 17.29 | -1.86 | 19.14 | D | | Boxscore | 14 | 38 | L |
| 2009 | NWE | BAL | 18.38 | -0.63 | 19 | W | -4 | Boxscore | 14 | 33 | L |
| 1973 | MIA | OAK | 21.86 | 2.86 | 19 | C | | Boxscore | 27 | 10 | W |
| 1998 | NYJ | JAX | 16.38 | -2.5 | 18.88 | D | -9 | Boxscore | 34 | 24 | W |
| 2012 | DEN | BAL | 16.13 | -2.63 | 18.75 | D | -9 | Boxscore | 35 | 38 | L |
| 2005 | SEA | WAS | 16.75 | -1.88 | 18.63 | D | -8.5 | Boxscore | 20 | 10 | W |
| 1985 | MIA | CLE | 13 | -5.63 | 18.63 | D | -10.5 | Boxscore | 24 | 21 | W |
| 1979 | SDG | HOU | 14.63 | -4 | 18.63 | D | -8 | Boxscore | 14 | 17 | L |
| 1977 | DAL | MIN | 14.57 | -4 | 18.57 | C | | Boxscore | 23 | 6 | W |
| 1998 | MIN | ATL | 23.63 | 5.25 | 18.38 | C | -11 | Boxscore | 27 | 30 | L |
| 1998 | DEN | MIA | 14.63 | -3.25 | 17.88 | D | -13.5 | Boxscore | 38 | 3 | W |
| 2011 | SFO | NYG | 16.75 | -0.88 | 17.63 | C | -2 | Boxscore | 17 | 20 | L |
| 1999 | JAX | MIA | 13.63 | -3.88 | 17.5 | D | -8 | Boxscore | 62 | 7 | W |
| 1954 | CLE | DET | 21.67 | 4.17 | 17.5 | C | | Boxscore | 56 | 10 | W |
| 1991 | HOU | NYJ | 15.63 | -1.75 | 17.38 | W | -9 | Boxscore | 17 | 10 | W |
| 2001 | PIT | BAL | 14.5 | -2.75 | 17.25 | D | -5.5 | Boxscore | 27 | 10 | W |
| 1963 | SDG | BOS | 12.86 | -4.29 | 17.14 | C | | Boxscore | 51 | 10 | W |
| 2012 | BAL | IND | 9.38 | -7.63 | 17 | W | -7 | Boxscore | 24 | 9 | W |
| 1997 | SFO | MIN | 15.38 | -1.63 | 17 | D | -11.5 | Boxscore | 38 | 22 | W |
| 1998 | DAL | ARI | 7.75 | -9.13 | 16.88 | W | -7 | Boxscore | 7 | 20 | L |
| 1969 | OAK | HOU | 13.71 | -3.14 | 16.86 | D | | Boxscore | 56 | 7 | W |
| 1967 | OAK | HOU | 21.71 | 4.86 | 16.86 | C | | Boxscore | 40 | 7 | W |
| 1996 | GNB | CAR | 18.88 | 2.13 | 16.75 | C | -12 | Boxscore | 30 | 13 | W |
| 1988 | CIN | SEA | 15.38 | -1.38 | 16.75 | D | -6.5 | Boxscore | 21 | 13 | W |
[continue reading…]
Tagged as:
Drew Brees,
Russell Wilson,
Saints,
Seahawks
{ }
by Chase Stuart
on January 9, 2014
Steve Buzzard has agreed to write another guest post for us. And I think it’s a very good one. Steve is a lifelong Colts fan and long time fantasy football aficionado. He spends most of his free time applying advanced statistical techniques to football to better understand the game he loves and improve his prediction models.
Last month, I wrote about how to project pass/run ratios using offensive Pass Identities and the point spread. However, this methodology only considers one side of the ball. Can we actually improve our projections model using both offensive and defensive Pass Identities? As it turns out the answer is yes.
First, I started off by creating defensive Pass Identities using the same methodology found here. The first thing I noticed was the standard deviation of pass ratios for defenses was only 3.0% compared to 5.1% for offenses. This led me to believe that offenses control how much passing goes on in a game more than defenses. I was glad to see this as it confirmed most of my previous research as well. Given this, it wasn’t appropriate to use a standard deviation of 3.0% for defenses in my projection while using a standard deviation of 5.1% for offenses. Instead, I used the combined standard deviation of all 64 offensive and defensive pass ratios, which turned out to be 4.17%. This doesn’t change the order of passer identities much but obviously does increase the deviation from the mean for the offensive side of the ball and decrease it for the defensive side. [Chase note: Determining the best way to handle the differing spreads between offensive and defensive pass ratios is a good off-season project; in the interest of time, I advised Steve to split the difference and move ahead with the analysis.]
Now that we have a Pass Identity grades for both sides of the ball, we can add a strength of schedule adjustment, too. To make the SOS adjustment, I simply took the average of the defensive Pass Identities played by each offensive unit and the average of the offensive Pass Identities played by each defensive unit. As expected the SOS adjustments had a much larger impact on the defensive Pass Identities than the offensive Pass Identities.
[continue reading…]
Tagged as:
Game Scripts,
Guest Posts,
Pass Identity
{ }
by Chase Stuart
on January 8, 2014
Did notice the lack of yellow flags this weekend? In the first round of the 2013 playoffs, just 31 penalties were called over four games, a 7.75 per-game average. That’s the lowest per-game average from any week this season, and the 63.25 penalty yards assessed also represent the floor on a per-game basis for any week in 2013.
In 2012, Wild Card weekend was also the least penalized weekend of that season, on both a penalty and penalty yards basis. That is, until the later rounds of the playoffs. As it turns out, these examples are part of a broader trend in the NFL for over a decade.
The graph below shows the average number of penalties called per team game in both the regular season and the postseason going back to 2000. Obviously for 2013, we’re looking at just four games, but for each other postseason, I included all 11 games. [continue reading…]
Tagged as:
Penalties
{ }
by Chase Stuart
on January 7, 2014
Longtime readers know that Jason and I started together at the Pro-Football-Reference blog. Over there, Doug, Jason, and I would compete in trivia podcasts from time to time, which was as geeky as you think it is. Well, Jason and I got together last week and asked each other multiple questions in three separate categories. The way we structured the podcast, it should be easy for you to listen and play along at the same time, too. Post in the comments how you fared, or just make fun of me for not knowing anything about NFL trivia compared to Jason.
You can listen here, or via iTunes here.
Tagged as:
The Big Lead
{ }
by Chase Stuart
on January 7, 2014
Still number one.
After 15 weeks, I wrote that Seattle’s pass defense looked to be one of the most dominant since the merger. With the regular season now over, and the Seahawks getting ready for their first playoff game, I wanted to revisit this question and slightly tweak the methodology.
We begin with the base statistic to measure pass defenses, Adjusted Net Yards per Attempt. Team passing yards and team passing yards allowed, unlike individual passing yards, count sack yards lost against a team’s passing yards total. So to calculate ANY/A on the team level, we use the formula (Passing Yards + 20*TD – 45*INT) divided by (Attempts + Sacks). The Seahawks allowed just 3.19 ANY/A this year, which was 1.20 ANY/A better than any other defense this season. In fact, it was so good that it enabled Seattle to easily post the best ANY/A differential (offensive ANY/A minus defensive ANY/A) in the league, too. The Seahawks 3.19 average is the 4th best average in the least 20 years (behind only the 1996 Packers, 2002 Bucs, and 2008 Steelers). But what makes Seattle’s accomplishment more impressive is the passing environment of the NFL in 2013.
When I graded the Seahawks three weeks ago, I defined the league average ANY/A in the customary way: the ANY/A average of the passing totals of the league as a whole. This time around, I decided it would be more appropriate to (1) exclude each team’s own pass defense when calculating the league average, and (2) take an average of the other team’s ANY/A ratings, as opposed to taking an average of the totals. In 2013, the other 31 pass defenses allowed an average of 5.98 Adjusted Net Yards per Attempt. That means Seattle allowed 2.79 fewer ANY/A than the average team this year: that’s better than every defense since 1990 other than the 2002 Bucs.
Next, I calculated the Z-Score for each pass defense. The Z-Score simply tells us how many standard deviations from average a pass defense was. The standard deviation of the 32 pass defenses in 2013 was 0.95, which means the Seahawks were 2.93 standard deviations above average. That’s the 4th best of any defense since 1950.
[continue reading…]
Tagged as:
Earl Thomas,
Richard Sherman,
Seahawks
{ }
by Chase Stuart
on January 6, 2014
It’s Christmas in January. Again. Thanks to the tireless work of Mike Kania and the P-F-R staff, PFR has now generated the Approximate Values for every player in the NFL this year. For the uninitiated, you can review how AV is calculated here. And if you’re so inclined, you can thank Mike or PFR on twitter. (You can still thank Neil, although he has now officially moved on.)
Here’s a list of the top 100 players. AV is also listed for each player on each team’s roster page on PFR (for Seattle, it’s Richard Sherman). You can use the PFR player finder for all sorts of AV-related fun, too. For example, you could see the player with the most AV on your favorite team (for the Jets, it’s Muhammad Wilkerson), or by position (among wide receivers, it’s a three-way tie between Antonio Brown, Alshon Jeffery, and Demaryius Thomas), or by age (among those 35 or older, it’s Peyton Manning, or John Abraham for non-quarterbacks; Vontaze Burfict and Luke Kuechly lead the 23-and-younger crowd.)
Here’s a list of the 25 players with an AV of 15+ or greater:
Tagged as:
AV
{ }
by Neil Paine
on January 6, 2014
Love the Bowl Championship Series or (more likely) hate it, tonight marks the end of college football’s 16-year BCS experiment. Designed to bring some measure of order to the chaotic state college football had been in under the Bowl Alliance/Coalition, the BCS did streamline the process of determining a national champion — though it was obviously not without its share of controversies either.
If various opinion polls conducted over the years are any indication, the public is ready to move on from the BCS to next season’s “plus-one”-style playoff system. But before it bids farewell forever, how does the BCS grade out relative to other playoff systems in terms of selecting the best team as a champion?
Back in 2008, I concluded that it didn’t really do much worse of a job than a plus-one system would have. But that was more of an unscientific survey of the 1992-2007 seasons than a truly rigorous study. Today, I plan to take a page from Doug’s book and use the power of Monte Carlo simulation to determine which playoff system sees the true best team win the national title most often.
(Note: If you just want the results and don’t want to get bogged down in the details, feel free to skip the next section.) [continue reading…]
{ }
by Chase Stuart
on January 5, 2014
The table below shows the results of every game in the division round of the playoffs from 1990 to 2012. Each game is displayed from the perspective of the home team. For example, last year, Denver hosted Baltimore in the second round of the playoffs, and you can click on the Boxscore link to see the full boxscore at Pro-Football-Reference. Denver lost 38-35 as a 9-point favorite, and the Over/Under was 44.5. The “dnc” means that the Broncos did not cover.
Overall, home teams are 67-25 and 49-42-1 against the spread.
{ }
by Chase Stuart
on January 5, 2014
After the projections for most of the week was below-zero weather, the latest reports indicates that by kickoff, the temperature in Green Bay should be in the single digits. The temperature of a game is more open to interpretation than you think: in a lot of the games below, there are different reports depending on which source you use. That said, I’ve found six playoff games that had a temperature of zero degrees or colder:
- The Ice Bowl: The classic cold-weather game: the temperature was reportedly −15 degrees with an average wind chill around −36, although PFR has it at -2 degrees and -23, respectively. The Packers won 21-17, after Bart Starr‘s quarterback sneak for the winning score in the final seconds.
- The Freezer Bowl: In 1981, the Chargers played in Cincinnati in -9 degree weather; add in the 27 miles per hour winds, and it felt more like −37 degrees. PFR has those numbers at -6 degrees, wind 24 mph, wind chill -32. Cincinnati won 27-7, to advance to the Super Bowl.
- The 2007 NFC Championship Game: This was the Giants/Packers game where half of Coughlin’s face turned Giants red. New York won in overtime, 23-20, before upsetting the Patriots in Super Bowl XLII. The gamebook lists the temperature at -1 degrees, with a wind chill of -23. PFR has it at -7 degrees, with a brutal wind chill of -27.
- Washington at Chicago, 1987: PFR has this one at -3 degrees with a wind chill of -20. Classic Ditka weather! Here’s the video to the CBS intro with John Madden and Pat Summerall (note that the broadcast states it was 12 degrees, with a wind chill feel of -5.). Washington won, 21-17, and eventually won the Super Bowl.
- Indianapolis at Kansas City, 1995. Lin Elliott misses three field goals for the Chiefs, and the Colts win 10-7. PFR has it at 0 degrees, – 15 with wind chill.Some other playoff games come closer.
- When Los Angeles traveled to Buffalo in 1993, it was zero degrees with, according to NFL.com, a wind chill at -32! Jeff Hostetler, who never had a bad playoff game, lost his only playoff game here despite throwing for 230 yards and a touchdown (with no interceptions) on 20 passes. Jim Kelly threw a game-winning touchdown pass to Bill Brooks, and Buffalo won 29-23. PFR lists the temperature at 3 degrees with a wind chill of -14
A pair of playoff games in Lambeau Field in 1996 and Soldier Field in 1963 probably could have been sub-zero games, but noon-time starts kept the temperature on the positive side of the ledger. Ten years ago, the Titans game in New England got the Saturday Night treatment, which allowed the temperature to drop down to 4 degrees with a wind chill -14. And the Browns/Raiders game known simply as Red Right 88 was at 2 degrees with a wind chill of -20.
It looks like today’s game will join the list of freezing playoff games, but may not make the top five.
San Francisco’s Turnover Margin
I think the 49ers are the vastly superior team here, so my pregame analysis will be limited. The Packers are a very average team, and a healthy Aaron Rodgers only makes them above-average. San Francisco led the league in points differential through two quarters and through three quarters, and I can still see this team becoming the next Lombardi Packers. But here’s an interesting stat from Bill Barnwell: [continue reading…]
Tagged as:
49ers,
Packers
{ }
by Chase Stuart
on January 5, 2014
Every few years, a team like the 2013 Chargers makes the playoffs. This season, San Diego’s offense ranked 3rd in Adjusted Net Yards per Attempt, while the defense ranked 3rd to last in the same metric. And these teams, without exception, have flamed out in the playoffs. The Chargers also ranked 2nd in NY/A and 2nd to last in NY/A allowed, but I’m going to focus on ANY/A for the rest of this post.
The worst pass defense to win the Super Bowl was the 1976 Raiders. That year, Oakland’s pass defense produced the 10th worst ANY/A allowed average in the league. The only other Super Bowl champion that ranked in the bottom half of the league in ANY/A allowed was the 2011 Giants, who just barely qualify (New York ranked 17th in ANY/A allowed, or 16th from the bottom).
The table below shows each team since 1970 that ranked in the top five in ANY/A and in the bottom five in ANY/A allowed. Because of the different numbers of teams throughout the league’s history, I ranked teams from worst to best when calculating the ANY/A allowed ranks. The most recent team prior to the ’13 Chargers to make the playoffs while meeting those thresholds was the 2005 Patriots. That team, quarterbacked by Tom Brady and coached by Bill Belichick, ranked 5th in ANY/A and 4th from the bottom in ANY/A allowed. New England went 10-6 that year, and then 1-1 in the playoffs. As you can see, the postseason results for this group have been pretty uninspiring. And, as Chargers fans will notice, it includes a pair of Air Coryell teams: [continue reading…]
Tagged as:
Bengals,
Chargers
{ }
by Neil Paine
on January 4, 2014
One of my favorite sabermetric baseball articles of all time was written by Sky Andrecheck in 2010 — part as a meditation on the purpose/meaning of playoffs, and part as a solution for some of the thorny logical concerns that arise from said mediation.
The basic conundrum for Andrecheck revolved around the very existence of a postseason tournament, since — logically speaking — such a thing should really only be invoked to resolve confusion over who the best team was during the regular season. To use a baseball example, if the Yankees win 114 games and no other AL team wins more than 92, we can say with near 100% certainty that the Yankees were the AL’s best team. There were 162 games’ worth of evidence; why make them then play the Rangers and Indians on top of that in order to confirm them as the AL’s representative in the World Series?
Andrecheck’s solution to this issue was to set each team’s pre-series odds equal to the difference in implied true talent between the teams from their regular-season records. If the Yankees have, say, a 98.6% probability of being better than the Indians from their respective regular-season records, then the ALCS should be structured such that New York has a 98.6% probability of winning the series — or at least close to it (spot the Yankees a 3-0 series lead and every home game from that point onward, and they have a 98.2% probability of winning, which is close enough). [continue reading…]
{ }
by Chase Stuart
on January 4, 2014

I have to deal with Chip Kelly?
Kansas City/Indianapolis Preview
New Orleans Saints (11-5) (+2.5) at Philadelphia Eagles (10-6), Saturday 8:10 PM ET
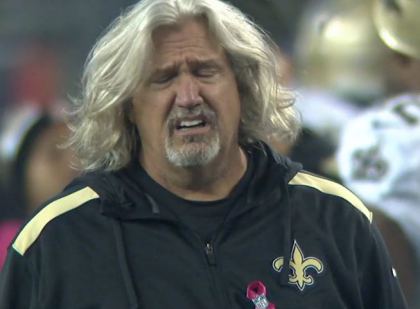
We’re fully immune to the Saints offense at this point. Drew Brees just threw for for 5,162 yards and 39 touchdowns and it didn’t even register on most radars. One reason for that: both of those numbers represent three-year lows for the Saints star. Jimmy Graham shook off early-season leg injuries to lead the league with 16 touchdowns, and rookie Kenny Stills led the NFL in yards per target. Both Pierre Thomas and Darren Sproles topped 70 receptions — two of just five running backs this year to do so — and I didn’t even know that until five seconds ago. Pinball numbers are the expectation when dealing with the Saints offense.
But the real change is on defense, as the team just finished one of the most remarkable turnarounds in NFL history. Did you know that the Saints finished fourth in points allowed this year? That’s only the fourth time New Orleans has ranked in the top five in that statistic in franchise history, with the other three occurrences all coming during the Dome Patrol era. What makes New Orleans’ success even more remarkable is that the team ranked last in points allowed in 2012. New Orleans is the first team in NFL history to jump 27 spots in the points allowed rankings. Prior to this year, the 2011 Houston Texans (4th after ranking 29th) and 1993 New York Giants (1st after ranking 26th) had been the most improved defenses with 25-slot jumps. Now the Saints probably aren’t as good as their points allowed rank would imply (Football Outsiders has them 9th, Advanced NFL Stats ranks the unit 10th), but unparalleled feats remain astounding.
The main reason for the team’s improvement is the pass defense. The Saints ranked last in Net Yards per Attempt allowed last year, but 7th this season, another remarkable jump. In fact, only 10 teams have ever made a jump of 25 spots in the NY/A allowed rankings: [continue reading…]
Tagged as:
ANY/A,
Eagles,
RANY/A,
Saints
{ }
by Chase Stuart
on January 3, 2014
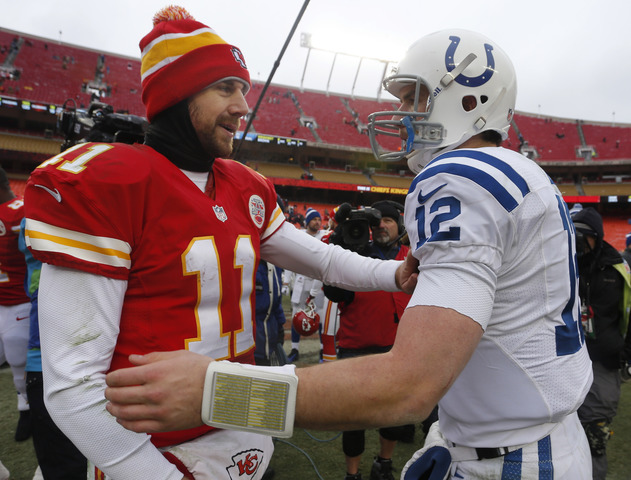
Kansas City Chiefs (11-5) (Pick’em) at Indianapolis Colts (13-3), Saturday 4:35PM ET
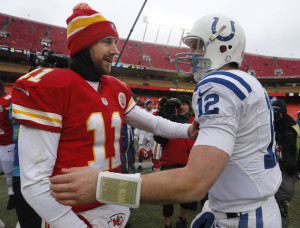
The Chiefs have the talent edge, but the Colts have one big advantage.
Among the four games this weekend, this one figures to be the most competitive: I would be surprised if this isn’t a one possession game in the fourth quarter. The Colts rank 13th in Football Outsiders DVOA, courtesy of the 13th-ranked offense, the 16th-best defense, and the 17th best special teams. Kansas City is 7th overall, thanks to a 15th-place ranking on offense, a 9th-place ranking on defense, and the top special teams in the NFL. And while the Colts beat the Chiefs two weeks ago, I don’t put much stock in that for a couple of reasons.
One, the Chiefs were missing two key players, left tackle Branden Albert and pass rusher Justin Houston. Two, I suspect that Kansas City called a very vanilla game plan in the first meeting. The Chiefs knew that Indianapolis was the likely first round opponent in the playoffs, and a win would have been meaningless for Kansas City unless Denver would lose to either Houston or Oakland. In retrospect, had the Chiefs kept their cards close to the vest (a luxury the Colts couldn’t afford), it would have been wise. [continue reading…]
Tagged as:
Chiefs,
Colts
{ }
by Chase Stuart
on January 3, 2014
Every week this season, I’ve written about the Game Scripts from the previous weekend. For new readers, the term Game Script is just shorthand for the average points differential for a team over every second of each game. You can check out the updated Game Scripts page, which shows the results of all 256 games this year. Week 17 saw some big blowouts and some tight finishes: Peyton Manning, Andrew Luck, and Drew Brees all led their teams to convincing wins against overmatched opponents, while Green Bay and Philadelphia clinched playoff berths with close wins.
Week 17 was unremarkable from a Game Scripts perspective, although I’ll note that Denver’s win over Oakland produced a Game Script of 21.6, the fifth highest average margin of the year (and the best by the Broncos this year). On the comeback side, only three teams won with negative Game Scripts, and two of those wins (Green Bay, Carolina) were back-and-forth contests. That means we should all take a moment to reflect on the resolve and grit of the San Diego Chargers, who overcame an average deficit of 4.6 points (in regulation) to force overtime and eventually defeat the Chiefs B team.
The full Game Scripts data from week 17: [continue reading…]
Tagged as:
Game Scripts,
Pass Identity
{ }
by Chase Stuart
on January 2, 2014
Before the playoffs start, I encourage everyone to post their playoff predictions in the comments. Here are mine:
Wild Card Round
Saturday, Jan. 4, 4:35 p.m.: Chiefs at Colts — Chiefs
Saturday, Jan. 4, 8:10 p.m.: Saints at Eagles — Eagles
Sunday, Jan. 5, 1:05 p.m.: Chargers at Bengals — Bengals
Sunday, Jan. 5, 4:40 p.m.: 49ers at Packers– 49ers
Divisional Round
Saturday, Jan. 11, 4:30 p.m.: 49ers/Packers/Saints at Seahawks — 49ers
Saturday, Jan. 11, 8:15 p.m.: Bengals/Colts/Chiefs at Patriots — Bengals
Sunday, Jan. 12, 1:05 p.m.: Eagles/49ers/Packers at Panthers — Panthers
Sunday, Jan. 12, 4:40 p.m.: Colts/Chiefs/Chargers at Broncos— Broncos
Conference Championship Round
Sunday, Jan. 19: 3:00 p.m.: 49ers at Panthers – 49ers
Sunday, Jan. 19: 6:30 p.m.: Bengals at Broncos – Broncos
Super Bowl
Sunday, Feb. 2, 2013 – 6:20 p.m.: Broncos vs. 49ers — Broncos
{ }
by Chase Stuart
on January 2, 2014
It stands to reason that when a team has a bottom five scoring offense, they’re going to make some changes. But today we’re going to quantify what we all know. By definition, there were 55 teams to rank in the bottom five in scoring from 2002 to 2012. What changes did those teams make?
- 29 of the teams (53%) switched head coaches, 43 switched offensive coordinators (78%), and 32 teams (58%) had a different starting quarterback in week 1 of the following season. In 19 of the 55 cases (35%), the team got rid of the whole trio.
- I don’t think it’s too surprising that the offensive coordinator is the most likely casualty. In the 12 cases where the offensive coordinator was retained, the head coach was only fired in one of those seasons. That was in Cincinnati after the 2002 season, when Bob Bratkowski was kept after Dick LeBeau was replaced by Marvin Lewis. The Bengals drafted Carson Palmer with the first overall pick a few months later, but Jon Kitna kept the quarterback job for the 2003 season.
- In only four of the other 11 cases where the offensive coordinator was fired did the team switch quarterbacks. In 2009, Steve Spagnuolo and Pat Shurmur struggled in St. Louis under Marc Bulger; the team landed the number one overall pick, drafted Sam Bradford, and played him immediately. Also that year, Eric Mangini and Brian Daboll could not get the Cleveland offense humming under Brady Quinn. The solution was to bring in Jake Delhomme in 2010. In 2008, the Bengals offense struggled when Palmer missed most of the year due to injury. Lewis and Bratkowski were retained, as Cincinnati pinned the blame on Ryan Fitzpatrick. Finally, in 2006, Tampa Bay ranked 31st in scoring despite the presence of coaching guru Jon Gruden and Bill Muir. A rookie Bruce Gradkowski (playing after Chris Simms) was replaced in 2007 with Jeff Garcia.
There were only 7 of 55 situations where a team had a bottom five offense but brought back the head coach, offensive coordinator, and quarterback. Below is the full information for the 55 teams; analysis to come after the jump. For the Year N QB, I’ve listed the quarterback with the most attempts. For the Year N+1 QB, I chose to list the quarterback that started in week one of that season. All team/player/coach cells are linked to the relevant PFR page. [continue reading…]
{ }