by Chase Stuart
on July 11, 2013
For three straight years, NFL Network has produced a list of the Top 100 Players of 20xx. Many people have criticized the results, and this summary from Bill Barnwell hits on some of the main issues. But my issue isn’t with the mistakes the players may be making in the voting booth, but the mistakes made in tabulating the votes. I want to suggest to the fine folks at NFL Network an alternative method for deriving a list of the top 100 players. This method has three big advantages over the current process:
(1) It will take players only a few minutes — or as long as they like — to participate.
(2) More players will be part of the judging, since the time commitment will be lessened.
(3) The results will be more accurate.
Instead of asking players to write down a bunch of names from memory, my suggested method would involve asking them a bunch of simple and straightforward questions. Imagine a player sitting in front of a computer screen, and asked to pick an answer to each of the following:
That’s a lot better than the current system, described below by Mike Florio of Pro Football Talk:
[continue reading…]
Tagged as:
Elo Rating,
Rating Systems
{ }
by Chase Stuart
on July 10, 2013

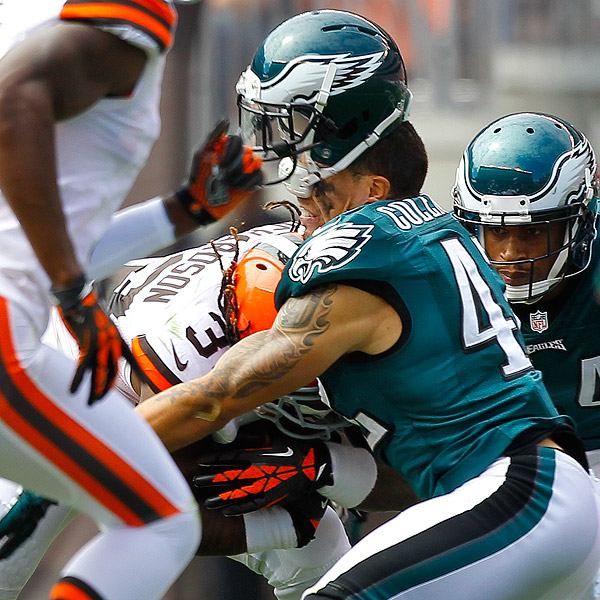
An ordinary hit.
Just about every article about
Trent Richardson references his unimpressive 3.6 yards per carry average from last season. That stat is pretty meaningless, in my opinion. I suppose if you took a random running back from NFL history, and his YPC average in one random season was 3.6, and I knew nothing else about the player, I suppose I would probably assume that the running back was not (or was not going to become) a star. But Richardson isn’t a random running back from a database, because…
- His 3.6 YPC average came on 267 carries, which represented 77% of all carries by Cleveland running backs
- He was a rookie last year
- He was a high first round pick
Since 1970, only 13 first round rookies have recorded 70% of all running back carries by their team. Two of those players were Richardson and Tampa Bay’s Doug Martin last year. Of that group, Richardson did post the lowest YPC average, but he was within 0.1 YPC of LaDainian Tomlinson. The next two lowest averages belong to Robert Edwards and Emmitt Smith; the former suffered a career-debilitating injury in a beach football game after his rookie season, while the latter ran for the most yards in NFL history.
Yeah, Richardson’s yards per carry average was well below average. But the universe of first round running backs who became workhorses right away as rookies and had a low YPC average consists of a HOF running back, a future HOF running back, and a player who suffered the flukiest of injuries. Richardson has something else in common with Emmitt Smith: after both of their rookie seasons, Norv Turner came on board as offensive coordinator.
But let’s say you don’t want to give Richardson any credit for his draft status. And you’re not in the mood to give him a pass just because he was a rookie. OK. Since 1990, 48 running backs have averaged fewer than 3.8 yards per carry while recording at least 70% of all running back carries for their team. Twenty-six of those players were at least 27 years old, and on the back half of their careers. Here are the other 22 running backs:
[continue reading…]
Tagged as:
Trent Richardson,
Yards per rush
{ }
by Chase Stuart
on July 9, 2013
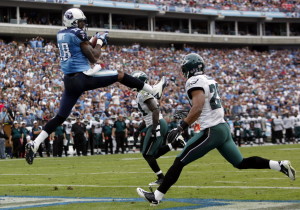
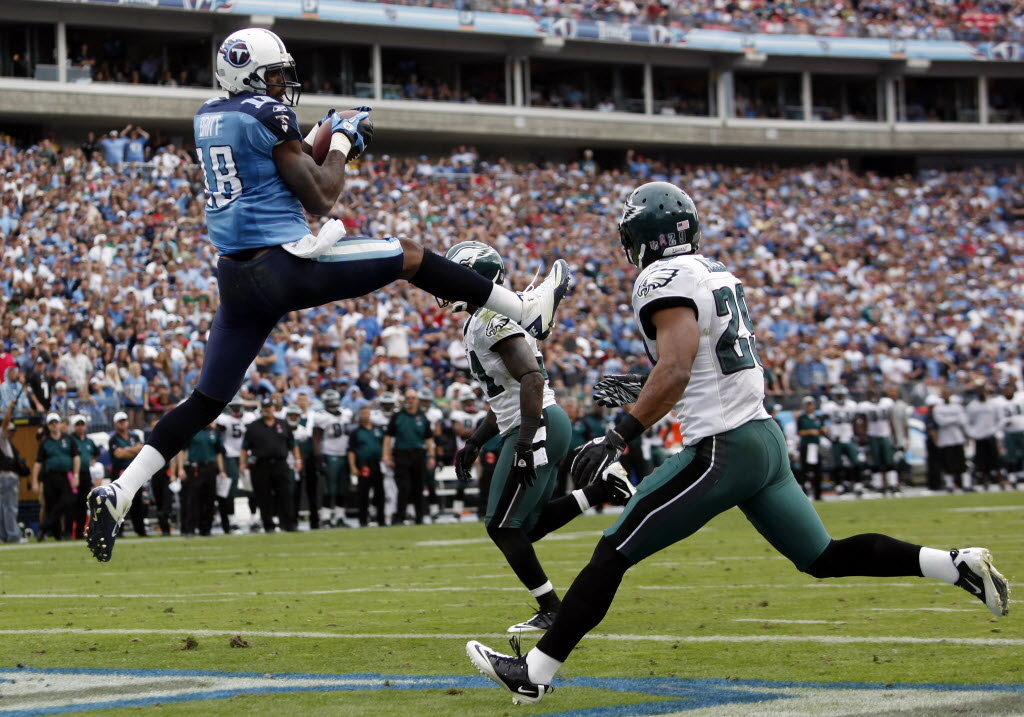
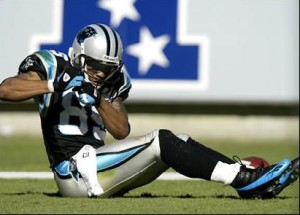
Britt smoked the Eagles secondary.
story is hardly a secret. As a freshman at Rutgers in 2006, his 64-yard catch turned the tide in the
biggest win in school history. The next year, he was part of a dynamic offense:
Ray Rice rushed for 2,012 yards,
Tiquan Underwood caught 65 passes for 1100 yards and 7 touchdowns, and Britt was the big play threat, gaining 1,232 yards and 8 touchdowns on 62 catches. In 2008, Britt caught 87 passes for 1,371 yards and 7 touchdowns. After his junior year, the dynamic college receiver made the obvious move and declared for the NFL Draft. He then watched his hometown Giants take
Hakeem Nicks one pick before the Titans made Britt the first Rutgers player ever to be selected in the first round.
Before analyzing his NFL career, I think it’s important to remember that Britt is young for his class year: he played in his first NFL game before he was old enough to legally drink. Despite the young age, Britt didn’t disappoint, producing 701 receiving yards as a rookie in ’09. He even produced a signature moment, catching the game-winning touchdown pass from Vince Young in what was one of the greatest comeback drives of all time (no, really — I swear).
Britt’s 2010 season looks like modest improvement on the surface, but his 775 yards and 9 touchdowns don’t tell the full story. According to Pro Football Focus, Britt only ran passing routes on 253 snaps that season, but averaged a whopping 3.1 yards per route run, easily the highest rate in the league. The obvious follow-up question is why didn’t he run more routes? Well, the 2010 Titans were a run-heavy team centered around Chris Johnson; Tennessee finished 30th with just 474 pass attempts. Britt also missed nearly five full games with a hamstring injury, and Tennessee tended to place Nate Washington on the field in their 1-WR sets. Those seem like reasonable explanations for overlooking why a 22-year-old would play a limited number of snaps. The impressive part is his insane production.
[continue reading…]
Tagged as:
AFC South,
Kenny Britt,
RPO 2013,
Titans
{ }
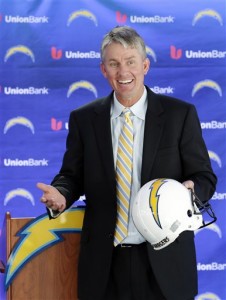
by Chase Stuart
on July 8, 2013
How did I end up with John Hadl's helmet? It's actually a funny story.
In 2011,
Mike Mularkey and
Joe Philbin were offensive coordinators for high-powered offenses. Those success seasons — on the backs of elite quarterbacks and wide receivers — were springboards for head coaching jobs in 2012. Mularkey’s work with
Matt Ryan,
Roddy White,
Julio Jones, and
Tony Gonzalez got him the top spot in Jacksonville, while Philbin (with an assist from head coach and play caller
Mike McCarthy) parlayed big numbers from
Aaron Rodgers,
Jordy Nelson,
Greg Jennings,
Jermichael Finley,
James Jones, and
Randall Cobb into the Dolphins head coaching job. Mularkey, of course, was one-and-done with the Jaguars, while Philbin had an uneven first year in Miami.
Mike McCoy’s work with Peyton Manning, Demaryius Thomas, and Eric Decker in 2012 (and Tim Tebow in 2011) helped him become the Chargers head coach in 2013. McCoy is one of three 2012 offensive coordinators who will be head coaches this season. The other two are are Bruce Arians (who goes from OC/interim HC/COTY in Indianapolis to Head Coach in Arizona) and Rob Chudzinkski (OC in Carolina, HC in Cleveland). I’m not sure if Arians really qualifies, but in any event, it’s McCoy who truly represents the “hot shot offensive coordinator –> head coaching job” rungs on the coaching ladder. His 2012 Broncos finished 2nd in points scored, 4th in yards, and 1st in both Net Yards per pass Attempt and Adjusted Net Yards per pass Attempt.
We’re working on our database of offensive coordinators, but it’s not 100% complete just yet. Let me know if I’ve missed any, but the table below represents all of the instances I’ve identified since 1990 where a team hired a new head coach who had been an offensive coordinator for a different team in the prior year. Here is how the McCoy line reads. In 2012, McCoy was the Offensive Coordinator for the Denver Broncos; after the season, he was hired to become the head coach of the Chargers. With the Broncos, his offense ranked 2nd in points, 4th in yards, and 1st in Adjusted Net Yards per Attempt.
[continue reading…]
Tagged as:
Chargers,
Mike McCoy,
RPO 2013
{ }
by Chase Stuart
on July 7, 2013
In light of Shattenjager’s great post yesterday about Marion Campbell, I thought we should do some NFL head coach trivia today centered around losing.
Let’s start with a tough one. With 165 losses, which coach has lost the most games in NFL history?
| Trivia hint 1 |
SelectShow |
He coached from 1981 to 2003.
|
| Trivia hint 2 |
SelectShow |
He appeared in four Super Bowls, losing all four.
|
| Trivia hint 3 |
SelectShow |
He coached the Broncos, Giants, and Falcons.
|
| Click 'Show' for the Answer |
SelectShow |
Dan Reeves finished his career with a 190-165-2 record, giving him three more losses than Tom Landry (250-162-6).
|
Obviously, there’s something to be said for losing a lot of games. That’s kind of like throwing the most interceptions in NFL history, a mark that Brett Favre holds. Let’s move on to a rate-based trivia question.
Which coach has the worst winning percentage in NFL history, minimum 50 games coached? It’s not Campbell or Joe Bugel, who at 30% are tied for the fourth worst record.
| Trivia hint 1 |
SelectShow |
He coached the Philadelphia Eagles.
|
| Trivia hint 2 |
SelectShow |
He compiled a 10-46-2 record from 1936-1941.
|
| Trivia hint 3 |
SelectShow |
He is more well-known for his time as former NFL commissioner.
|
| Click 'Show' for the Answer |
SelectShow |
Bert Bell won 19.0% of his games, the lowest mark in NFL history. The second-worst winning percentage belongs to famous son David Shula (26.8%), while former Cardinals coach Dave McGinnis (29.8%) is the only other coach with a winning percentage below .300 over fifty games.
|
What if we move to current coaches? Which of the 32 active head coaches has the most losses? No hints here:
[continue reading…]
Tagged as:
Weekend Trivia
{ }
by Chase Stuart
on July 6, 2013
Today you’re in for a treat, as frequent commenter Shattenjager has contributed an absolutely outstanding guest post.
Introduction: Question
Every time I have looked at Marion Campbell’s coaching career, a question has leapt to mind: How on earth did he keep getting jobs?
When Chase Stuart recently revisited Doug Drinen’s Dungy Index to measure coaches’ performances in the regular season compared to expectation, the man who appeared dead last in Wins over Expectation was former Falcons and Eagles head coach Marion Campbell, at a rather staggering -14.9. His teams essentially lost 15 more games than a linear regression based on Pythagorean winning percentage expected.
“So what?” you might think, “He was just a terrible coach.” I wouldn’t blame you for having that reaction. However, here’s what’s really fascinating about Marion Campbell: he had three separate head coaching stints.
Strictly looking at win-loss records is a poor measure of a coach, but it works well enough as a shorthand overview of Campbell’s career. He went 6-19 as the Atlanta Falcons head coach 1974-1976 after Norm Van Brocklin was fired during the 1974 season. Then, several years later, he took the head coaching job of the Philadelphia Eagles after Dick Vermeil famously stepped down due to burnout and promptly went 17-29-1 over the next three seasons before being fired again with one game remaining in the season. Just a year later, the Falcons—yes, the same Falcons who had already hired and fired Campbell as their head coach—decided that Campbell was the man to replace newly-fired Dan Henning. He rewarded them with an 11-32 run that ended with his retirement late in the 1989 season.
Again, how did he keep getting jobs? Well, it’s complicated, but I think an in-depth look at his career can explain it. [continue reading…]
Tagged as:
Guest Posts,
Marion Campbell
{ }
by Chase Stuart
on July 5, 2013
On Wednesday, I looked at the players who threw for the most yards and touchdowns against each franchise. Yesterday, I did the same with rushing statistics. Today we will close out the series with a look at the key receiving stats.
Let’s again start with some trivia.
Which player has the most career receptions against one franchise?
| Click Show for the Answer |
SelectShow |
Jerry Rice with 175 receptions in 29 career games against the Falcons.
|
What about the most receiving yards?
| Click Show for the Answer |
SelectShow |
Jerry Rice with 2,731 receiving yards in 29 career games against the Falcons.
|
And finally, any guesses as to the most receiving touchdowns?
| Click Show for the Answer |
SelectShow |
Jerry Rice with 25 receiving touchdowns in 29 career games against the Falcons.
|
Now that the most obvious trivia of the day is out of the way, let’s get to the career lists. Let’s start with the career receptions list.
[continue reading…]
Tagged as:
Jerry Rice
{ }
by Chase Stuart
on July 4, 2013
Yesterday, I looked at the players who threw for the most yards and touchdowns against each franchise. Today I will do the same but with rushing statistics.
But before going on, I’d urge you to take a few minutes and re-read this incredible document our founders signed 237 years ago. It’s great having a day off in the summer to barbecue and celebrate with family and friends, but it’s important to take a few moments and remember what this holiday really means. Like preventing this site from becoming Futbol Perspective.
Let’s again start with a bit of trivia. Do you know which player has rushed for the most yards against any one opponent?
What about the most rushing touchdowns?
| Click Show for the Answer |
SelectShow |
Emmitt Smith with 25 touchdowns in 25 games against his former team, the Arizona Cardinals.
|
Let’s take a look at the players who have rushed for the most yards against each franchise:
[continue reading…]
Tagged as:
Barry Sanders,
Emmitt Smith,
Walter Payton
{ }
by Chase Stuart
on July 3, 2013
Let’s start with a bit of trivia. Do you know which quarterback has thrown for the most passing yards against any one opponent?
What about the most passing touchdowns?
| Click Show for the Answer |
SelectShow |
Dan Marino with 72 passing touchdowns yards in 30 career games against the Jets.
|
Last year, on the Wednesday through Friday of Fourth of July, I posted a list of
franchise leaders in passing stats,
rushing stats, and
receiving stats. This year, I’ll be doing the reverse, looking at the biggest nemeses for each franchise. We’ll start with the passing stats today.
The table below shows for each NFL team the quarterback to whom they have allowed the most passing yards since 1960.
[continue reading…]
{ }
by Chase Stuart
on July 2, 2013
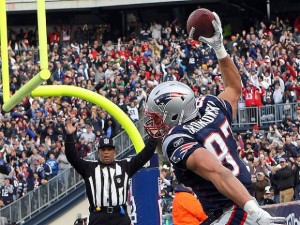
I'm gonna Gronk you out.
Three years ago, I posted a list of
Approximate Times of Knockout in the NFL: I defined the time of a knockout as how much time was remaining in every game when the winning team first scored more points than the losing team ultimately scored by the end of the game.
I want to revisit the issue but use a slightly different formula. Since we have robust play-by-play data going back to 2000, I thought we could get more precise. In this post, I am defining the time of knockout as the last time the eventual losing team had the ball within one score of the eventual winning team. This seems to fit the definition of knockout a little bit better, I think, although it’s certainly not perfect. I went through every game of the 2012 season and recorded the time of knockout for the victor in each game. If you lost a game and last had the ball trailing within one score with 5 minutes left in the 3rd quarter, that goes down as a knockout with 20 minutes remaining. For the winning team, they get +20, while the loser gets -20. If you do that for every game, you can get season ratings.
Let’s take a look at the Patriots. They went 12-4 last year, and had an average net time of knockout of 19.4 minutes. The “net” means this includes losses in there as well. In their 12 wins, the Pats had an average time of knockout of 26.3 minutes, while in their four losses, they were knocked out with just over one minute remaining, on average. The Patriots had the highest average net time of knockout, but you might be surprised to see who had the highest average time of knockout in victories:
[continue reading…]
Tagged as:
Time of Knockout
{ }
by Chase Stuart
on July 1, 2013
Peterson and Foster each finished in the top four in rushing first downs.
I’ve spent a lot of time this offseason looking at how to
grade wide receivers; today I wanted to get some initial thoughts down on paper on running backs.
I’m short on time today, which means a lot of data and not so much theory. One of the more underrated statistics to measure running backs is the number of first downs they produce. I don’t like using Yards per Carry for running backs because that metric is pretty sensitive to outliers. But by using rushing first downs, perhaps we can smooth things out.
We know that the value of a touchdown is about 20 yards, but what is the value of a rushing first down? Being short on time, I took the easy way out. Pro-Football-Reference has produced Expected Points Added for each team’s running game going back to 2000. I decided to run a regression on the team level to best predict rushing EPA based on four rushing statistics. The R^2 was 0.77, but more importantly, here was the best fit formula:
EPA = -16.6 -0.58*Rush + 0.067*Rush_Yd + 1.43*Rush_TD + 1.08*Rush_FD
What interests me is the relationships between the variables. Rushing touchdowns are considered 21.3 times as valuable as rushing yards, which happens to fit in well with our previous assumptions. But more importantly, this tells us that a rushing first down is worth 16.1 rushing yards. That seems pretty high to me, and I reserve the right to adjust this later, but for now, let’s adjust down and say the value of a rushing first down is 15 yards. Now what?
[continue reading…]
Tagged as:
Adrian Peterson,
Arian Foster,
RB Ranking Systems
{ }
by Chase Stuart
on June 30, 2013

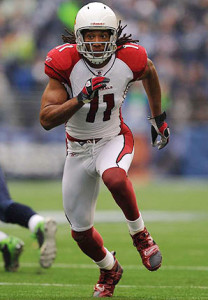
Reggie Wayne dominates when seeing blue.
Over the last few years, the football analytics movement has made tremendous progress. There are many really smart people with access to a large amount of useful information who have helped pioneer the use of statistics and analytics in football. Major news organizations and NFL teams seem to be embracing this movement, too. Unfortunately, there are some less-than-desirable side effects as the reward for presenting “statistical information” seems larger than ever.
Data snooping is the catch-all term used to describe a misuse of data mining techniques. There are perfectly legitimate uses to data-mining, but data snooping is a big ‘no-no’ for the legitimate statistician. If the researcher does not formulate a hypothesis before looking at the data, but instead uses the data to suggest what the hypothesis should be, then he or she is data snooping.
I’m guilty of data snooping, but (hopefully) only in a tongue-in-cheek fashion. When I said Reggie Wayne was much better against blue teams than other opponents, that was data snooping. We’ve all been taught that history repeats itself; that translates to “if the evidence indicates a strong relationship in the past, then it is likely to continue in the future” when it comes to statistical analysis. For example, history tells us that first round picks will perform better, on average, then sixth round picks. That’s both what the data suggest and an accurate statement.
But what happens when the data suggest that being born on February 14th or February 15th means a player is more likely to be a great quarterback? After all, the numbers tell us that 14% of all the NFL’s 31,000-yard passers were born on one of those two days, which only account for 0.6% of the days of the year. Just because history tells us that those dates are highly correlated with success — and the p-value would surely be very impressive — doesn’t mean that there is any predictive value in that piece of information.
[continue reading…]
{ }
by Chase Stuart
on June 29, 2013
Sid Luckman did it twice. Two Packers quarterbacks, Arnie Herber and Irv Comp, did it with help from Don Hutson. Sammy Baugh did it as a rookie in 1937.
In five out of eleven seasons from 1936 to 1946, the league leader in passing yards also won the NFL championship. Otto Graham led the AAFC in passing yards in ’47, ’48, and ’49, and the Browns won the championship each of their four seasons in the AAFC. But since then, only two quarterbacks have led the league in passing yards in the same season as winning a title. Can you name them?
Want to take a look at the list of all 95 players to lead their league in passing and their team’s final results? Click the “Show” button below:
Of course, you already knew that passing yards
wasn’t strongly correlated with winning. But what about being the league’s most valuable player? This year, the Miami Heat won the NBA title and
LeBron James was the MVP (for the second straight year). But in the NFL, it’s much rarer for a player to pull off that feat:
Adrian Peterson won MVP, but the Minnesota Vikings weren’t very close to winning the Super Bowl. Can you name the last player to win the MVP and the Super Bowl in the same year?
| Click Show for Answer |
SelectShow |
Kurt Warner for the ’99 Rams. Were you thinking Aaron Rodgers? He won the MVP when the Packers went 15-1 two years ago, but Green Bay won the Super Bowl the prior year.
|
One more bit of trivia. To really be like LeBron, an NFL player would need to win the MVP, the Super Bowl,
and the Super Bowl MVP. That’s happened six times in NFL history, but only once by a non-quarterback. Can you name him?
| Click Show for Answer |
SelectShow |
Emmitt Smith in 1993. In addition, Bart Starr (1966), Terry Bradshaw (1978), Joe Montana (1989), Steve Young (1994), and Warner (’99) have pulled off that feat.
In the pre-Super Bowl era, in four straight seasons the MVP won the NFL championship: starting in 1959, that award went to Johnny Unitas, Norm Van Brocklin, Paul Hornung, and Jim Taylor.
|
Tagged as:
Awards,
Weekend Trivia
{ }
by Chase Stuart
on June 28, 2013
Smith has excelled despite playing for a ground-based attack.
We don’t rank quarterbacks by passing yards because “passing yards” is largely a function of pass attempts. The same is true for receiving yards, as the
number of times a team passes the ball has a big impact on a receiver’s yardage total. I’ve spent some time this year looking at ways to rank
wide receivers and am throwing another log on that fire today. One idea I like in theory is receiving yards per team pass attempt, as it helps to solve the problem of dealing with receivers who play on pass-heavy teams.
But there are some obvious drawbacks to that approach. There are more passing options on the field now than ever before, so it’s tough to use receiving yards per team pass attempt across eras. For example, Jim Benton in 1945 owns the record in this metric at 5.36 yards per team attempt in 1945; even if you consider that high number a byproduct of World War II, Harlon Hill averaged 4.5 yards per team pass in 1956 for the Bears. Carolina’s Steve Smith is the single-season leader in yards per team attempt since 1970. And he also holds down the #2 on that list. Smith averaged 3.48 yards per team pass attempt in 2005; three years later, he averaged 3.43 Yd/TPA (but in the 14 games he played, Smith averaged an absurd 4.04 Yd/TPA).
A few weeks ago, I ranked receivers by their percentage of team receiving yards in their best six seasons. I thought it would be fun to do the same thing with yards per team pass attempt (excluding sacks). The results are listed below for the top 200 receivers; I’ve also included the six years selected for each receiver to come up with their average. As always, you can use the search box to find your favorite receiver, and the table is sortable, too.
[continue reading…]
Tagged as:
Steve Smith,
WR Project,
WR Ranking Systems
{ }
by Chase Stuart
on June 27, 2013
On September 13, 2008, Doug Drinen wrote this post, which I reproduce in full below.
I’m hearing and reading a lot of crazy stuff this week.
So I just want to document my predictions that (a) the Patriots will win at least 11 games this year, (b) the Patriots will clinch the East before week 17, and (c) Matt Cassel will be a top-12 fantasy quarterback from here out.
That is all.

You think I'm going to lose my top 5 receivers next year? Hahaha. Ok.
With the combination arrest/release of
Aaron Hernandez stacked upon
five surgeries in seven months for
Rob Gronkowski and the departure of
Wes Welker to Denver, it’s fair to say that many are wondering about the fate of the New England passing game. In addition to those three,
Tom Brady is without
Brandon Lloyd (free agent) and
Danny Woodhead (San Diego), the
fourth and fifth leading receivers on the 2012 Patriots. As Jason Lisk pointed out, that puts Brady in
historically bad territory when it comes to roster turnover.
So today’s post doubles as a temperature check and a contest entry. Please predict the following for Tom Brady in 2013, based on the assumption that he is responsible for 99.4% of all Patriots pass attempts by quarterbacks for the second year in a row. To the extent he is not, I will pro-rate his numbers for purposes of judging the contest. To enter, simply copy and paste this table below in the comments and fill out each line.
Your name:
Brady’s number of pass attempts:
Brady’s number of passing yards:
Brady’s number of passing touchdowns:
Brady’s number of interceptions:
Brady’s number of sacks:
Brady’s number of sack yards lost:
Commentary:
[continue reading…]
Tagged as:
Aaron Hernandez,
Contests,
Patriots,
Rob Gronkowski,
Tom Brady
{ }
by Chase Stuart
on June 26, 2013
After the voters did not select Shannon Sharpe as part of the 2009 Hall of Fame Class, I wrote this post comparing Sharpe to Art Monk. While many viewed Sharpe as a receiver playing tight end, I noted that the Redskins used Monk not just as a wide receiver, but as an H-Back and as a tight end. My friend and football historian Sean Lahman once wrote this about Monk:
Even though Monk lined up as a wide receiver, his role was really more like that of a tight end. He used his physicality to catch passes. He went inside and over the middle most of the time. He was asked to block a lot. All of those things make him a different creature than the typical speed receiver…. His 940 career catches put him in the middle of a logjam of receivers, but he’d stand out among tight ends. His yards per catch look a lot better in that context as well.
I haven’t heard anyone else suggesting that we consider Monk as a hybrid tight end, but coach Joe Gibbs hinted at it in an interview with Washington sportswriter Gary Fitzgerald:
“What has hurt Art — and I believe should actually boost his credentials — is that we asked him to block a lot,” Gibbs said. “He was the inside portion of pass protection and we put him in instead of a big tight end or running back. He was a very tough, physical, big guy.”
With Michael Crabtree likely to miss most if not all of the 2013 season due to a torn Achilles, the 49ers may consider moving Vernon Davis from tight end to wide receiver. The most likely explanations for Davis playing exclusively at wide receiver in mini-camp are (a) he doesn’t need more practice at tight end while his route-running could probably use some refining, (b) the 49ers have several young tight ends who could benefit from more reps in mini-camp, and (c) the wide receiver group is currently depleted, and it’s June, so why not try something outside the box?
[continue reading…]
Tagged as:
49ers,
RPO 2013,
Vernon Davis
{ }
by Chase Stuart
on June 25, 2013

Man at Work.
Did you know that
Aaron Rodgers is the longest-tenured Packer? Today I want to take a look at the current player who has been with each team the longest. Now that
Ronde Barber,
Ray Lewis, and
Jason Hanson have retired, the longest-tenured player in the NFL is…
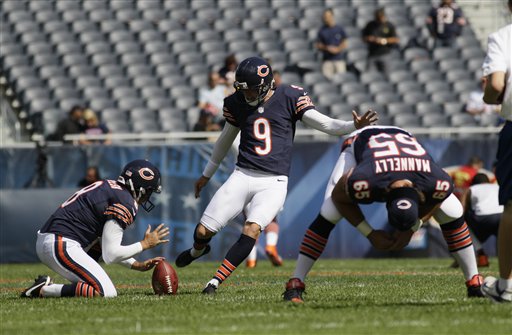
Patrick Mannelly? Don’t feel bad if you have never heard of the Chicago long snapper: I hadn’t, either. How’s this for a crazy fact: as a rookie, Mannelly snapped to punter Mike Horan, who was a Falcons draft pick in 1982. Think you can guess the most senior veteran in the other 31 locker rooms? Good luck.
AFC East
Buffalo Bills – Punter Brian Moorman and defensive end Chris Kelsay are gone, so placekicker Rian Lindell — who is entering his 11th year of the service with the team — is now the longest-tenured Bill. Defensive back Terrence McGee had also been with the team since 2003, but he was released in the offseason. George Wilson is now in Tennessee, which means Kyle Williams (2006) is the most senior non-kicker.
Miami Dolphins – Long snapper John Denney (since 2005) is the longest-tenured Dolphin. After him, it’s punter Brandon Fields and defensive tackle Paul Soliai, both of whom joined Miami in 2007.
New England Patriots – no surprise here: Tom Brady has been around since 2000; the runner up is Vince Wilfork, who came aboard in 2004.
New York Jets – Bryan Thomas, Brandon Moore, and Sione Pouha were casualties of John Idzik’s offseason house cleaning. That leaves two 2006 first round picks — D’Brickashaw Ferguson and Nick Mangold — as the longest tenured players.
[continue reading…]
{ }
by Chase Stuart
on June 24, 2013

Steve Johnson doesn't care about the NFL schedule.
Chris Brown of buffalobills.com is
not happy with the way the Bills’ schedule shakes out. Again. Last year,
this is what Brown wrote after examining the 2012 schedule:
After playing what is expected to be a physical contest with the 49ers in San Francisco in Week 5 [Chase: In retrospect, not that physical], the Bills then face the Cardinals in Arizona in Week 6. The Cards will have the benefit of three extra days of prep time for Buffalo as their Week 5 game is on Thursday night.
The very next week when the Bills play host to Tennessee, the Titans will also have three extra days of prep time for Buffalo because they’re playing on Thursday night the previous week (Week 6) as well.
The Bills look to get a break as they’ll have a bye week in Week 8 to get two weeks to prep for the Texans in Houston. But that extra prep time will be a wash because Houston also has their bye in Week 8.
Finally while the Bills are battling the Texans in Houston, the Patriots will be on their couches watching at home while their head coach grinds tape for two weeks to prepare for the Bills who travel to New England in Week 10 as the Pats have their bye in Week 9.
Brown’s claims were accurate: Buffalo did face a team coming off extra rest (i.e., more than eight days) four times in five weeks. Of course, those were the only times all season the Bills played a team coming off extra rest. Still, if we look at the 2012 season, it’s fair to say the Bills got the short end of the scheduling stick.
But they don’t have the biggest beef. Philadelphia faced four teams coming off bye weeks last year, tying the ’09 Falcons, ’05 Chargers, ’03 Cowboys, and ’99 Chargers for facing the most teams coming off a bye week since 1994.
[continue reading…]
Tagged as:
Bills,
Bye Weeks,
RPO 2013
{ }
 Last week Chase announced this contest in honor of Football Perspective’s first birthday. Here’s the backstory…
A couple of years ago, I moved. The house I was moving into, like many houses, had walls. The walls did not have artwork pre-installed, so I spent a good six months of my life obsessed with finding good wall-art. Somewhere in there, I stumbled on the open-source visualization program called Gephi. It looked super-cool, so I decided to play around with it.
The bug/bean/Australia/peanut/hairball Chase posted last week is the result. In addition to framing one for my own wall, I framed one each for Chase and Lisk, and I mailed them off. I don’t use the word “hero” very often, but really, what other word is there for someone who is talented enough to create world-class art and generous enough to send it to his friends? This was a good thing I had done. So what’s a hero to do when he is told, tactfully of course, by both Chase and Lisk, that his art kinda sucks? I thought the bean’s worth was self-evident.
The mechanics are straightforward. I don’t even remember the specifics but, as you all figured out, this is a roster of the best players in modern-ish NFL/AFL history. The size of a player’s dot represents his quality, as measured by career AV or 100-95-90-… AV — I can’t remember which. The strength of a connection between two players is the number of games they played with and against each other. So Peyton Manning is strongly connected to Marvin Harrison, less connected to Tom Brady, still less connected to Brian Urlacher, and not at all connected to Dan Fouts or Bill George. The layout was determined by Gephi’s “force atlas” algorithm. My understanding is that it pretends the connections are elastic bands — the stronger the connection the tauter the band — and then lets the physics take over. Manning and Harrison naturally end up close together because they are connected by a tight band. Urlacher sort of wants to be close to Manning, but there are tighter bands pulling him in other directions so he doesn’t get too close. He does get closer than Dan Fouts does, though.
[continue reading…]
Tagged as:
Contests
{ }
by Chase Stuart
on June 22, 2013
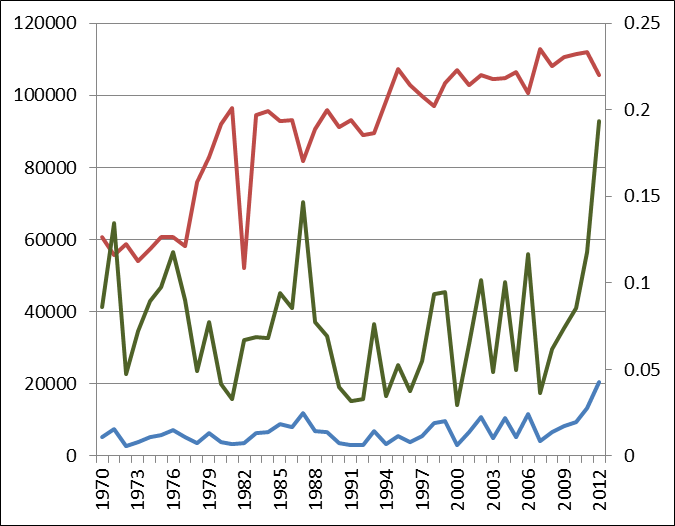
In the graph below, the blue line shows the number of passing yards by rookies in each year since 1970, while the red line shows the number of passing yards by non-rookies in the same season. Both are measured against the left Y-Axis; the green line shows the percentage of rookie passing yards to veteran passing yards. As you can see, Andrew Luck, Robert Griffin III, Russell Wilson, Ryan Tannehill, and Brandon Weeden were part of an extremely productive rookie class:
 [continue reading…]
{ }
by Chase Stuart
on June 21, 2013
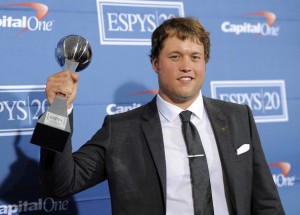
Matt Stafford won the 2012 ESPY for most double chins in a leading role.
Last year’s article on the Lions was
somewhat negative. Detroit went 4-12 in 2012, but the Lions are going to win more games this year. This is the type of article that
Jason Lisk,
Bill Barnwell,
Brian Burke, or
Aaron Schatz could write in their sleep. But I’m writing it while watching TV, writing a more complicated article, working out, taking out the trash, and tweeting. Let’s see Lisk do that!
The Lions went 3-9 in games decided by 8 or fewer points last year, giving them the most losses and the worst winning percentage of all teams in one-possession games. While this might imply that the Lions lack the mental fortitude to win close games, you might recall that in 2011, the Minnesota Vikings (2-9) and the Indianapolis Colts (1-7) were the worst two teams in such situations and then made the playoffs last year.
Another way to convey similar information is to look at each team’s Pythagorean record, which is calculated based on a team’s points scored and points allowed and is a better predictor of future winning percentage than past winning percentage. The table below shows each team’s number of wins, points scored and allowed, and number of Pythagorean wins for 2012, using 2.57 as my exponent(which produced the best fit for recent years). The table is sorted by the difference between actual wins and Pythagorean wins:
[continue reading…]
Tagged as:
Lions,
Pythagorean,
RPO 2013
{ }
by Chase Stuart
on June 20, 2013
In 2008, Larry Fitzgerald had a fantastic regular season capped off by a historically great postseason; in the Super Bowl, he set the record for receiving yards in a season, including playoff games, with 1,977 yards. Of course, 2008 was decades ago in today’s era of what have you done for me lately. The table below shows Fitzgerald’s stats over the past four seasons. The final two columns show the total number of receiving yards generated by all Cardinals players and Fitzgerald’s share of that number.
| Year | Rec | Yds | YPR | TD | ARI Rec Yds | Perc |
| 2009 | 97 | 1092 | 11.3 | 13 | 4200 | 26% |
| 2010 | 90 | 1137 | 12.6 | 6 | 3264 | 34.8% |
| 2011 | 80 | 1411 | 17.6 | 8 | 3954 | 35.7% |
| 2012 | 71 | 798 | 11.2 | 4 | 3383 | 23.6% |
2009 was the last season of the Kurt Warner/Anquan Boldin Cardinals. The 97 receptions and 13 touchdowns look great, although hitting those marks and not gaining 1,100 receiving yards is very unusual. Fitzgerald was only responsible for 26% of the Cardinals receiving yards that season, although one could give him a pass since he was competing with another star receiver for targets.
Can Fitzgerald rebound in 2013?
In 2010,
Derek Anderson,
John Skelton,
Max Hall, and
Richard Bartel were the Cardinals quarterbacks: as a group, they averaged 5.8 yards per attempt on 561 passes. Arizona’s passing attack was bad, but without Boldin, Fitzgerald gained 34.8% of the team’s receiving yards.
Steve Breaston chipped in with 718 receiving yards yards while a 22-year-old
Andre Roberts was third with 307 yards. In other words, Fitzgerald performed pretty much how you would expect a superstar receiver to perform on a team with a bad quarterback and a mediocre supporting cast: his raw numbers were still very good (but not great) because he ate such a huge chunk of the pie. After the 2010 season, I even
wondered if he could break any of
Jerry Rice’s records (spoiler: he can’t).
In 2011, Skelton, Kevin Kolb and Bartel combined for 3,954 yards on 550 passes, a 7.2 yards per attempt average (Kolb was at 7.7 Y/A). That qualifies as a pretty respectable passing game and Fitzgerald appeared to have a monster year, gaining 35.7% of the Cardinals’ receiving yards (Early Doucet was second with 689 yards and Roberts was third with 586 yards). It’s always hard splicing out cause and effect, but my takeaway is that with a more competent passing game, Fitzgerald continued to get the lion’s share of the team’s production but unlike in 2010, this led to great and not just good numbers.
[continue reading…]
Tagged as:
aDOT,
Air Yards,
Cardinals,
Larry Fitzgerald,
RPO 2013
{ }
by Chase Stuart
on June 19, 2013
Yesterday, Joe Fortenbaugh canonized Mike Lombardi for discovering and emphasizing one of the game’s great hidden stats: the number of rushing attempts plus completions a team has in a game. If you hit 50, you’re in great shape. Fortenbaugh reminds us that Lombardi, whose last team went 2-14, “possesses a vast range of knowledge spanning from management to game theory.” Fortenbaugh does the math for us, noting that the “top-10 teams in rushing attempts + completions combined to post a record of 101-59 (.631) in 2012, with seven of those ten organizations advancing to the postseason. On the opposite end of the spectrum, the bottom-10 teams combined for a 62-97-1 (.387) mark, with zero total playoff berths.” Then, he blows us away with the prize-winning line:
If you take only the teams that averaged 50.0 or more rushing attempts + completions per game over the last five years, you get a combined regular season record of 339-189 (.642), with 22 of 33 (66%) teams qualifying for the postseason. That winning percentage puts a team in between 10 and 11 wins per season.
The headline to the article reads: Average a combined total of 50 rushing attempts and completions per game and a winning season will likely follow. I’ll do the article one better: From 2008 to 2012, including playoffs, teams with 50+ rushes + completions have a record of 819-325-3, giving them a .715 winning percentage.
After reading that article and getting an inside look into Lombardi’s wisdom, I had considered the code to producing a winning season cracked. But I’ve got a robust database, so I thought maybe I could do even better than that .715 winning percentage Lombardi’s stat produces. The following information is based on the results from every game, regular and postseason, since 2008:
[continue reading…]
{ }
by Chase Stuart
on June 18, 2013
Yards per Attempt is the basic statistic around which the passing game should be measured. It forms the base of my favorite predictive statistic (Net Yards per Attempt) and my favorite explanatory statistic (Adjusted Net Yards per Attempt). But it’s not perfect.
In theory, Yards per Attempt is a system-neutral metric. If you play in a conservative, horizontal offense, you can have a very high completion percentage, like David Carr in 2006. But if you’re not any good (like Carr in 2006), you’ll produce a low yards-per-completion average, dragging down your Y/A average. You can’t really “game” the system to get a high yards per attempt average; the way to finish among the league leaders in Y/A is simply by being very good.
Courtesy of NFLGSIS, I have information on the length of each pass (or Air Yards) thrown during the 2012 regular season. I then calculated, for each distance in the air, the average completion percentage and average yards per completion. In the graph below, the X-Axis shows how far form the line of scrimmage the pass went (or, as Mike Clay calls it, the depth of target). The blue line shows the average completion percentage (off the left Y-Axis) based on the distance of the throw, while the red line shows the average yards per completion (off the right Y-Axis). For example, passes four yards past the LOS are completed 69% of the time and gain 5.4 yards per completion, while 14-yard passes are at 50% and 17.6.

We can also follow up on yesterday’s post by looking at Air Yards vs. YAC for each distance or depth of throw. Air Yards is in red and on the right Y-Axis, while average yards after the catch is in blue and measured against the left Y-Axis. Initially, there is a pretty strong inverse relationship, just like with completion percentage and yards per completion. On a completion that is one yard past the line of scrimmage, the average YAC is 5.5; on a completion 10 yards downfield, the average YAC drops to 3.0. This is why players like Percy Harvin and Randall Cobb will rack up huge YAC numbers. But once you get past 13 or 14 yards, YAC starts to rise again. This makes sense, as that far down the field, a player is just one broken tackle away from a huge gain (I suspect using median YAC might paint a different picture).
[continue reading…]
{ }
by Chase Stuart
on June 17, 2013

Luck winds up to throw deep.
Consider the following example. The Colts gain possession at the 20-yard line.
Andrew Luck is in shotgun and throws a strike to
Reggie Wayne, who catches it at the 30, runs 15 yards, and gets tackled at the 45-yard line. Luck gets credited with 25 passing yards and Wayne records 25 receiving yards. Wayne is also credited with 15 yards after the catch, a statistic that you’ll occasionally see discussed or cited.
But you rarely see Luck’s completion split into (a) 10 yards through the air, and (b) 15 yards after the catch by his receiver. Brian Burke calls those 10 yards “Air Yards” and I think that is a pretty useful moniker. The question is, what do you do with Air Yards? Luck led the NFL in Air Yards per completed pass last year (8.0), but that doesn’t make the statistic an indicator of quality. Tim Tebow’s 2011 performance produced the highest single-season Air Yards per completion average since 2006 (8.9), while Jake Delhomme (2008) and Derek Anderson (2010) each have led the league in that metric, too. Air Yards per completed pass is a very useful way to describe a player’s style, but you can’t use it alone to determine a player’s quality.
One question I have: Are Air Yards more repeatable for a quarterback than the yards he gains via his receivers’ YAC? It’s important to keep that question separate from this one: Is a quarterback who has a high number of air yards and a low YAC better than a quarterback in the opposite situation? Today, I plan to focus on the first question, but let’s take a second to address the second one.
According to ESPN’s research, yards after the catch is more about what the receiver does than the quarterback. As a result, a completion that is in the air for 40 yards is better for a quarterback’s ESPN QBR than a pass that is in the air for 5 yards on which the receiver runs for 35 yards after the catch. That makes sense, I suppose, and I suspect that’s probably true more often than not. The easiest counterargument is to point to Joe Montana, and say that what made Montana great was his pinpoint accuracy that enabled players like Jerry Rice to rack up big YAC numbers.I’m going to put off any further analysis of how much of YAC should be attributed to the quarterback and how much to the receiver, because it’s pretty complicated. One thing that is a bit easier to analyze is how “sticky” Air Yards are from year to year.
[continue reading…]
Tagged as:
aDOT,
Air Yards
{ }
by Chase Stuart
on June 16, 2013
Over at Footballguys.com, I look at a different method to project receiving yards.
The number of receiving yards a player produces is the result of a large number of variables. Some of them, like the receiver’s ability, are pretty consistent from year to year. But other factors are less reliable, or less “sticky” from year to year. I thought it would be informative to look at three key variables that impact the number of yards a wide receiver gains and measure how “sticky” they are from year to year. These three variables are:
- The number of pass attempts by his team;
- The percentage of his team’s passes that go to him; and
- The receiver’s average gain on passes that go to him.
We can redefine receiving yards to equal the following equation:
Receiving yards = Receiving Yards/Target x Targets/Team_Pass_Att x Team_Pass_Att.
You’ll notice that Targets and Team Pass Attempts are in both the numerator and denominator of one of the fractions, and they will cancel each other out: that’s why this formula is equivalent to receiving yards.
By breaking out receiving yards into these three variables, we can then examine the stickiness of each one, which should help our Year N+1 projections. Below are the best-fit equations for each of those variables in Year N+1:
Future Pass Attempts = 36 + (450 x Pass_Attempts/Play) + (0.255 x Offensive Plays)
Future Percentage of Targets = 6.2% + 71.3% x Past Percentage of Targets
Future Yards/Target = 5.5 + 0.29 x Past Yards/Targets
I then used those three equations to come up with a starting point for receiving yards projections for 28 wide receivers. You can read the full article here.
Tagged as:
Footballguys.com
{ }
by Chase Stuart
on June 15, 2013
On June 15, 2012, I launched Football Perspective. Since that day, Football Perspective has posted a new article every single day. This the site’s 445th post, so I won’t blame you if you’ve missed an article here or there. At the top of every page is a link to the Historical Archive, a page that is updated after each post is published. To get in on the celebration, you can enter the Football Perspective Birthday Contest.
A couple of weeks ago, I thanked many of my friends and colleagues who helped mold me into the writer and person I am today. All of those people are responsible for this site getting to see its first birthday, so I thank them again right now. I also want to give an added thank you to Neil, who occasionally adds another voice to this site and is a wonderful sounding board. And I want to thank you, the reader: without you, there wouldn’t be a site. It means a lot to me that you’ve chosen to come here and stop by every day, once or week, or whenever you like.
I checked the stats, and the five most viewed posts in Football Perspective history were:
If you’ve been to this site, there’s a good chance you’ve read at least one of those posts. But to the newer readers, I thought I’d take a quick a stroll through the Historical Archive and point out some of my more memorable (at least, for me) articles.
- Before last season, I looked at running back records in the context of Steven Jackson‘s adjusted sub-.300 career winning percentage. And now he’s on a Super Bowl contender in Atlanta.
- I projected Peyton Manning to help the 2012 Broncos set the record for the largest increase in pass completions in a post-Tim Tebow world. That’s one prediction that came true.
- I enjoyed researching this post from before the 2012 season that seems even more true today: unlike for most of NFL history, the best quarterbacks are now passing most frequently. That’s one of the reasons the league average passing averages are rising.
- Does it get any worse than predicting Jacksonville Jaguars coach Mike Mularkey to win Coach of the Year?
- One of my favorite posts ever breaks down what percentage of each receiver’s yards came from which quarterback.
- Before the season, I highlighted how impressive it was for Ray Lewis and London Fletcher to still compete at high levels. Fletcher is back for 2013, which is mind-boggling for an inside linebacker.
- Neil wrote a really interesting article last October: how to estimate NFL win probabilities for matchups between teams of various records – Neil is a very smart dude.
- I argued against taking a left tackle high in the draft a few months before three teams took right tackles with the first four picks. Nice.
- In November, I said Joe Flacco had the 9th most ‘it’ of any quarterback in the NFL. You might think that rating was off, but I’d argue that my low ranking of his “it” caused him to have even more ‘it’ going forward, which ended up in a Super Bowl victory.
- On December 1st, I noticed that the Buccaneers were in the midst of one of the greatest statistical turnarounds ever. As it turned out, Tampa Bay jumped from 32nd and 31st in rushing yards allowed and yards per carry allowed in 2011 to 1st in both categories in 2012.
- In December, Larry Fitzgerald caused me to look at other great receivers who had terrible years in their primes. The two most promising examples were Randy Moss and Steve Smith, who rebounded with new quarterbacks (Tom Brady, Cam Newton) in Year N+1. Will Carson Palmer be enough of an upgrade for Fitzgerald?
- We’ve done a lot of data dumps here at Football Perspective, but Neil’s post of SOS-adjusted Pythagorean Records for every team since 1970 may set the record for packing the most information into one post.
- I know I’m a sucker for graphs, but I loved how this graph on passing turned out.
- My playoff predictions: Denver 31, Baltimore 13 based on stats; Baltimore 23, New England 21 based on gut; San Francisco 27, Baltimore 21 based on Xs and Os. I am sure we can all learn a valuable lesson here. I just don’t know what it is.
- I had no idea that pick-sixes were steadily rising before shooting through the roof in 2012.
- My most time-consuming project might have been figuring out the salary cap values for veteran players.
- I think the discovery that scoring is 60% of the game has a lot of applications.
If you had a favorite post or two from this year, let me know in the comments. One of my goals for Year Two is to get comments section to become a little more active.
{ }
by Chase Stuart
on June 14, 2013
Football Perspective turns one tomorrow. To celebrate, Doug Drinen has come up with a contest centered around the following picture.

Question 1: Explain what this is a picture of.
Question 2: Make a case to your real or hypothetical significant other that this is worthy of being printed, framed, and hung on your wall.
[continue reading…]
Tagged as:
Contests
{ }
by Chase Stuart
on June 13, 2013
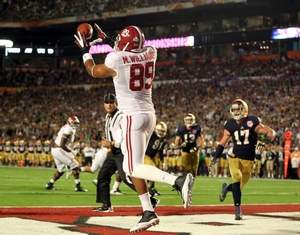
Somebody forgot to cover Mike Williams.
Nine Mike Williamses have played in the NFL. A Tulsa linebacker of the same name was drafted by the Steelers in the 12th round of the 1986 Draft but never appeared in a game. In April, the Lions selected Alabama tight end Michael Williams. Assuming the former Crimson Tide Williams plays in an NFL game, he will move into sole possession of the #10 slot.
#9: Michael Williams – safety, 1995 (San Francisco 49ers)
An undrafted free agent out of UCLA, Williams played in only four games for the 49ers. Despite the limited playing time, he still recorded 31 solo tackles and forced two fumbles.
#8) Mike Williams – tight end, 1982-1984 (Washington)
A fifth round pick out of Alabama A&M, Williams was part of the Redskins teams that made back-to-back trips to the Super Bowl in ’82 and ’83. Joe Gibbs was famous for using multiple tight ends, which kept Williams on the roster even though he was strictly a blocker and fourth on the depth chart. During Williams’ three-year career, Washington tight ends Don Warren (65-727-2), Clint Didier (41-513-10), and Rick Walker (34-312-4) put up respectable numbers, while Williams recorded just three catches (all in 1982).
[continue reading…]
Tagged as:
Mike Williams
{ }
by Chase Stuart
on June 12, 2013

Each coach is given bonus points for mustaches.
Back in 2006, Doug Drinen came up with the
Dungy Index, a way to measure a coach’s performance in the regular season relative to expectations. Because Doug understands
regression to the mean, he was impressed by
Tony Dungy’s ability to continue to string together 12-win seasons year after year. But Doug didn’t want to just use winning percentage to rate coaches: expectations are lower when a coach inherits a bad team, and that needs to be taken into account.
Defining “expectations” is challenging. I don’t have a perfect way, but I do have a simple one: use a linear regression based off of last year’s Pythagorean winning percentage to predict the number of games a team should be expected to win this year. I did just that, and the best-fit formula was:
Year N+1 Wins = 4.23 + 0.472 * Year N Wins
So a 3-win team should be expected to win 5.6 games in Year N+1, a 10-win team is projected at 9.0 wins, and a 13-win team drops down to 10.4 expected wins. If you subtract the number of expected wins from the number of actual wins by the coach in a season, you are left with his number of wins over expectation. You’ll see pretty quickly why this is called the Dungy Index: he fares very, very well in it.
[continue reading…]
Tagged as:
Tony Dungy
{ }