≡ Menu

Matt Schaub and a franchise quarterback in the same sentence

Matt Schaub and a franchise quarterback in the same sentence.

The Texans and Raiders recently made a couple of veteran quarterback acquisitions. The team with the first overall pick in May’s draft signed Ryan Fitzpatrick and then traded Matt Schaub to Oakland, owners of the fifth overall selection. Will either team now be deterred from spending a top five pick on Teddy Bridgewater, Blake Bortles, or Johnny Manziel? Putting aside your feelings on those players, one would certainly hope not simply as a matter of principle. The idea that a journeyman quarterback would cause an organization to pass on a potential franchise quarterback is absurd. If the Texans choose to select Jadeveon Clowney over a quarterback with the first overall pick, that’s fine, but the reason isn’t going to be because Houston is confident that Fitzpatrick is the quarterback of the future.

I thought it would be interesting to review the last 20 years of NFL history and identify situations where a team added a veteran quarterback and then still selected a passer in the first round of the draft. There weren’t quite as many examples as I originally expected, although part of the explanation is that there simply aren’t that many quarterbacks drafted in the first round, period. In addition, the 2011 lockout prevented this from happening that year, but teams that spent high picks on quarterbacks went after veterans once the lockout ended. Minnesota traded for Donovan McNabb after drafting Christian Ponder, the Titans signed Matt Hasselbeck and gave him the starting job over Jake Locker, and even the Panthers brought in Derek Anderson to do something for Cam Newton. But let’s look at some of the examples more similar to Schaub-to-Oakland or Fitzpatrick-to-Houston: [continue reading…]

{ 5 comments }

Meaningless receiving yards

Shorts makes a meaningful catch

Shorts makes a meaningful catch.

Which player led the league in meaningless receiving yards last year? Wait, what are meaningless receiving yards?

I am defining a meaningless receiving yard as one where:

  • On third or fourth down, a player gained fewer yards than necessary for the first down.
  • The receiving yard(s) came in a loss and when the player’s team trailed by at least 28 points.
  • The receiving yard(s) came in a loss and when the player’s team trailed by at least 21 points with fewer than 15 minutes remaining.
  • The receiving yard(s) came in a loss and when the player’s team trailed by at least 14 points with fewer than 8 minutes remaining.
  • The receiving yard(s) came in a loss and when the player’s team trailed by at least 9 points with fewer than 3 minutes remaining.

This definition is not perfect — Le’Veon Bell had a 29-yard reception on 3rd-and-30 last season against the Patriots, and then rushed for a first down on 4th-and-1 — but I think it gets us close enough to perfect that I feel comfortable using it. The results aren’t too surprising — two Jaguars ranked in the top three, separated by the player who led the league in receiving yards — but that doesn’t have to be the end of the analysis. [continue reading…]

{ 7 comments }

Don't worry, this will all make sense by the end. I think.

Don't worry, this picture's presence will make sense by the end. I think.

Two years ago, I wrote this post on running back aging curves. One conclusion from my research was that age 26 was the peak age for running backs, which was immediately followed by a steady decline phase until retirement. In that study, I only wanted to look at very good-to-excellent running backs in the modern era; as a result, I was forced to limit myself to just 36 players. I’ve been meaning to update that post, but wasn’t quite sure what methodology to use.

Last year, Neil wrote a very interesting post on quarterback aging curves. In it, Neil computed the year-to-year differences in Relative ANY/A at every age. While reviewing that post, a lightbulb went off. We can greatly increase the sample size if we only look at running backs from year-to-year, and not just the best running backs on the career level.

There are 723 running backs since 1970 who had at least 150 carries in consecutive seasons and who were between 21 and 32 in the first of those two seasons. For each running back pair of seasons, I calculated how many rushing yards the player gained in Year N and many yards he gained in Year N+1. Take a look:

[continue reading…]

{ 28 comments }

No, Peyton, you are #1

No, Peyton, you are #1.

While working on a different post, I needed to derive a quick-and-dirty formula to identify the top 100 or so quarterbacks in NFL history. Here is how I went about doing that:

1) Calculate the Relative ANY/A of each quarterback in every season since 1950. ANY/A, of course, is Adjusted Net Yards per Attempt, defined as (Gross Pass Yards + 20*Pass_TDs – 45*INTs – Sack Yards Lost) divided by (Pass Attempts + Sacks). For quarterback seasons before 1969, we do not have sack data, so that part of the analysis is ignored (I could have used estimated sack data, but I being lazy).

2) For each quarterback season, multiply each quarterback’s number of dropbacks by his Relative ANY/A to derive a Passing Value over Average metric.

3) Pro-rate non-16 game seasons to 16 games.

4) Calculate a career grade for each quarterback based on the sum of his best five seasons.

Then I realized that this data, while background material for a separate post, was probably interesting to folks in its own right.  Hence today’s post. You should not be surprised to see that Peyton Manning is number one on this list. Here’s how to read his line. His best year came in 2004, when he produced 2113 Adjusted Net Yards over Average. Last year was his second best season — his gross numbers were more impressive, of course, but he produced “only” 2,031 ANY over average. Manning’s other three best years came in ’06, ’05, and ’03. Overall, he produced 8,115 Adjusted Net Yards over Average over his five best seasons, the best of any quarterback in this study (by a large margin). The table below shows the top 100 passers since 1950 (you can change the number of quarterbacks displayed in the dropdown box). [continue reading…]

{ 71 comments }

Reminder: Neil Paine now at FiveThirtyEight

In December, I let you know that Nate Silver’s new FiveThirtyEight had made the smart decision to hire Neil Paine.  On Monday, the website opened its doors, so I wanted to make sure my readers were aware that Neil is (thankfully) back in the writing game.  You can read all of Neil’s posts here. Of course, the full site is worth checking out, too.

{ 2 comments }
Chris Berman has already copyrighted Teddy 'Bridge over troubled' Water.

Chris Berman has already copyrighted Teddy 'Bridge over troubled' Water.

Sometimes, it’s hard to believe that it’s 2014. With draft season now in full gear, I wanted to take a few minutes and look at the stats of the top college quarterbacks from last year. Unfortunately, that’s easier said than done. I couldn’t find a site that presented a full list of all college quarterback stats, including sacks, which is, of course, insane.

College football records sacks as rushing plays for the offense; as a result, knowing how many sacks Johnny Manziel or Teddy Bridgewater took last year is not that easy to find. So here’s what I did:

1) Using team game log data, I found the number of sacks for each defense in each game.

2) Next, I recorded the percentage of team pass attempts recorded by each quarterback for his offense in each game (usually close to 100%).

3) I synched up these two sets of data, and multiplied each quarterback’s percentage of team pass attempts by the number of sacks by his opponent’s defense in that game.

That provided me with some useful estimated sack data. From there, I calculated each quarterback’s Adjusted Net Yards per Attempt average, which is simply (Gross_passing_yards + 20*PassTDs – 45*INTs – Estimated_sack_yards_lost) / (Pass_attempts + Estimated_sacks). I did this for the 140 quarterbacks with the most pass attempts in the FBS (sorry, Jimmy Garoppolo fans) in 2013.

Since the number of pass attempts vary wildly at the college level, I also calculated a Value Over Average statistic. The 140 quarterbacks had an average ANY/A of 6.44, so the Value metric (which is what the table is sorted by) is simply (ANY/A – 6.44) * (Pass_attempts + Estimated_sacks). Here’s how to read Bridegwater’s line, the Louisville quarterback who many believe will be the first quarterback selected in the draft.

Bridgewater provided the 5th most passing value by this formula, completing 303 of 427 passes for 3,970 yards with 31 touchdowns and 4 interceptions. He took 25.5 sacks and lost 185 yards, and had a sack rate of 6% (if I included the percent sign, the table would not sort correctly). Bridgewater also averaged 13.1 yards per completion and had a 9.34 ANY/A average, which combined with his number of dropbacks, means he added 1,310 adjusted net yards of value over average. By default, the table below only shows the top 25, but you can sort and/or search to find each of the 140 quarterbacks (and you can change the number of quarterbacks displayed via the dropdown box to the left). [continue reading…]

{ 8 comments }

The Best Punt Returners in NFL History

Six years ago, I wrote a series of posts looking at the best returners in NFL history. Today, I want to update that list by examining the best punt returners in NFL history. As with most statistics, yards per punt return has fluctuated throughout most of NFL history. The graph below shows the average in this metric from 1941 through 2013:

y pr [continue reading…]

{ 7 comments }

Jones catches another bomb

Jones catches another bomb.

In November, I noted that Chris Johnson was the career leader in average length of rushing touchdown. Since then, he’s actually dropped to number two, as his six rushing touchdowns covered “only” 84 yards in November and December. But what about the career leader in average length of receiving touchdown?

That title belongs to former Giants wide receiver Homer Jones.  A star in the late ’60s, 19 of Jones’ 36 career touchdowns went for 50 or more yards. The table below shows all 413 players to record at least 35 receiving touchdowns (including the postseason) from 1940 to 2013.  While Jones leads in average touchdown length, I think it makes more sense to sort the list by median touchdown length, although that doesn’t matter much for Jones.  For each player listed, I’ve included both their average and median touchdown length, the years they played, and a best guess at their primary position.  The table by default shows 50 entries, but you can change that; in addition, the table is fully sortable and searchable. [continue reading…]

{ 8 comments }

How Bad Was Ray Rice in 2013?

Rice just barely averaged his height in 2013

Rice just barely averaged his height in 2013.

The 2013 season was a disaster for Ray Rice, and 2014 isn’t off to a very good start, either. Last season, Rice carried 214 times for just 660 yards and four touchdowns, producing an anemic 3.1 yards per carry average. On November 9th, I asked whether Rice was already washed up; at the time it felt a bit premature, but in retrospect, such a view seems much more reasonable. Averaging so few yards per carry over such a large number of carries is pretty rare. How rare?

As a disclaimer, I’m in the camp that thinks YPC is an overrated statistic. In 2013, Marshawn Lynch, Eddie Lacy, and Frank Gore all averaged around the league average of 4.17 yards per carry, but that doesn’t make them average backs. So consider much of this post to be a bit of trivia and fun with stats, rather than the best way to identify running back productivity. With that disclaimer out of the way, I calculated each player’s “yards above league average” for each season since 1950, which is the product of a player’s number of carries and the difference between his YPC average and the league average YPC rate.

For example, since Rice averaged 3.08 YPC on 214 carries, he gets credited for being 231 yards below average in 2013. By this measure, Rice was the worst running back in the league. He was worse than his teammate Bernard Pierce (who actually had a lower YPC average but on fewer carries, so he finished 197 yards below average), worse than Willis McGahee (-198) or Rashard Mendenhall (-217), and even worse than Trent Richardson (-220). And this wasn’t your typical worst season in the league, either: his 2013 performance ranks as the 15th worst in this metric since 1950: [continue reading…]

{ 2 comments }

Free Agency Roundup

Happy Friday, folks.

Dr. Jene Bramel (@JeneBramel), who always has interesting insights on defensive players and injuries in the NFL, is producing multiple daily updates for his excellent blog over at Footballguys.com. Jene is very high on DeMarcus Ware (calling the Broncos as good a fit as any schematically for Ware), a bit lukewarm on Jon Beason (“last year showed that he cannot execute sideline to sideline or in coverage”), and thinks the Bears were wise to sign Lamarr Houston.

Sigmund Bloom (@SigmundBloom) handles the blog for offensive players over at Footballguys, and he does a great job of not only telling you what happened, but why the transactions matter from a fantasy perspective.

Bill Barnwell (@billbarnwell) wrote a pair of very good recaps after day 1 and day 2 of free agency.

Mike Tanier (@MikeTanier), who also reviewed the news from day 1 of free agency, later explained why the 49ers traded for Blaine Gabbert and Jonathan Martin.  Mike also contributed an article that is surely near and dear to the hearts of Football Perspective readers: five stats that really should be official.

Three years ago, Matt Waldman (@MattWaldman) wrote this article about new Jet Eric Decker.  Matt also chimes in with his view on the silly test known as the Wonderlic and an in-depth description of how he scouts quarterbacks.

Former NFL safety Matt Bowen (@MattBowen41) argues that the position is more important than ever, and which would explain the large contracts given to Jairus Byrd, T.J. Ward, and Donte Whitner. [continue reading…]

{ 1 comment }

How Have Previous Eric Deckers Fared?

Decker learns how to run a Papa Johns franchise

Decker learns how to run a Papa John's franchise.

Just a few minutes before press time, the Jets signed Eric Decker, generally considered the best wide receiver available in free agency. But for weeks, the #hotsportstake on Eric Decker has been pretty clear: he’s a product of playing with Peyton Manning and alongside Demaryius Thomas (and Wes Welker and Julius Thomas). It would take you awhile to find a discussion of Decker’s free agent candidacy without hearing the phrase “he’s not a number one wide receiver.” This sort of analysis is obviously lazy, but it’s also a fascinating counter to an unmade argument. In the same way that Joe Namath is now an underrated quarterback, it’s fair to wonder: if so many people are calling Decker overrated, how can he be overrated?

In today’s post, I want to look at how the previous ten Eric Deckers have fared. What’s an Eric Decker? A gritty hard working player who runs great routes receiver who met each of the following criteria:

  • Finished as a top-20 fantasy wide receiver (with 1 point per 10 yards, 6 points per touchdown, 0.5 points per reception as the scoring system) in Year N
  • Was not his team’s top fantasy wide receiver in Year N
  • Played for a different team in Year N+1

[continue reading…]

{ 7 comments }

Recapping the News From Day 1 of Free Agency

What uniform will DeMarcus be Waring in 2014? [punches self in face]

What uniform will DeMarcus be Waring in 2014? {punches self in face}.

Free agency kicked off at 4PM yesterday, the start of what may be the dumbest day of the year. Some absurdly large contracts were dished out, as always, but free agent signings weren’t the only news stories on Tuesday.  The new regime in Tampa Bay appears ready to move on from the Darrelle Revis era, possibly via a trade to the Browns or an outright release. The Cowboys ended their game of renegotiating chicken with DeMarcus Ware by cutting him; he was joined on the waiver wire by Chicago DE Julius Peppers, 49ers CB Carlos Rogers and Steelers OLB LaMarr Woodley.

One of the first major signings came in Miami, where 29-year-old Branden Albert was finally brought to South Beach. The Dolphins tried to trade for Albert to replace Jake Long last year, but talks with the Chiefs fell apart, leaving the team to turn first to Jonathan Martin and then Bryant McKinnie at left tackle. The Dolphins gave Albert big money — a five-year deal worth $46M with $25M guaranteed – but after last year’s headache, this is probably money well spent.

The Bucs added former Bengals defensive end Michael Johnson as soon as free agency opened, luring him with a whopping five-year, $43.75M ($24M guaranteed) deal.  Tampa Bay desperately needed to improve the pass rush, and Johnson will team with Gerald McCoy to make the defensive line a strength of the team. And while losing Revis will hurt, Tampa Bay signed Alterraun Verner late in the day to 4-year, $26.5M deal with $14M guaranteed.  That’s a pretty reasonable deal: If Verner plays out that contract, Tampa will have saved nearly $40M compared to what they would have paid Revis over that time.

The Browns played a bit of whack-a-mole on Tuesday.  Cleveland lost inside linebacker D’Qwell Jackson to Indianapolis before the start of free agency, and replaced him yesterday with former Cardinal Karlos Dansby (initially reported as four years, $24M, $14M guaranteed). Dansby, as you may recall, was arguably the second best free agent signing of 2013, so this was probably an upgrade (but the Browns got older). More curious was the team’s decision to pass on resigning safety T.J. Ward (who signed a reasonable $5.75M/Yr deal with the Broncos) and sign former 49er Donte Whitner to a four-year deal worth $28M. To replace Whitner, the 49ers signed longtime Colts safety Antoine Bethea. [continue reading…]

{ 14 comments }

Predictions in Review: AFC North

During the 2013 offseason, I wrote 32 articles under the RPO 2013 tag. In my Predictions in Review series, I review those preview articles with the benefit of hindsight. Previously, I reviewed the AFC West, the NFC West, the the AFC South, and the NFC South. Today, the AFC North.

Marvin Lewis, Jim Mora, and the Playoffs, May 30, 2013

In this article, I noted that Marvin Lewis had coached the Bengals for ten seasons without recording a playoff victory.  That was pretty unique: Since 1966, only Jim Mora had coached a team for longer without notching a playoff victory, and he was fired by the New Orleans Saints in his 11th year after a 2-6 start. Well, Lewis now stands alone in the Super Bowl era, as the only coach to fail to record a playoff win in 11 straight seasons and then be brought back for season twelve.

Since I wrote that article, though, I’ve become much more sympathetic to Lewis.  For years, it was easy to take pot shots at his ridiculous use of challenges or his failure to be aggressive when the situation warranted it, but I now think Lewis is one of the better coaches in the league.  He seems to have a knack for connecting with his players, he’s surrounded himself with very good coaches, and you get the sense that he has more on his plate organizationally than the typical head coach.  He’s the de facto GM, unless you consider Mike Brown the real man building the franchise.  And he’s developed one of the most talented rosters in the league, even if Andy Dalton turns into a pumpkin every January.

Of course, that is just cold comfort to Bengals fans who have witnessed the team go 0-11 in the Lewis era when it comes to recording a playoff victory. On the other hand, Cincinnati didn’t win a playoff game in any of the 12 seasons immediately preceding the Lewis hire, either.  But Lewis’ streak is particularly notable for just how rare his tenure has been in today’s environment. [continue reading…]

{ 1 comment }

One Play Away

Football Perspective accepts guest posts, and Andrew Healy submitted the following post. And it’s outstanding. Andrew Healy is an economics professor at Loyola Marymount University. He is a big fan of the New England Patriots and Joe Benigno.


The Browns were one play away from the Super Bowl

How much did this player lower Cleveland's Super Bowl odds?

The Catch. The Immaculate Reception. The Fumble. We remember all these plays, but which mattered the most? More specifically, what plays in NFL history had the biggest impact on who won the Super Bowl?

The answer to this question is kind of surprising. For example, two of those famous plays are in the top 20, but the other wasn’t even the most important play in its own game. Going all the way back to Lombardi’s Packers, the memorable and important plays overlap imperfectly.

Here, I try to identify the twenty plays that shifted the probability of the eventual Super Bowl winner the most. According to this idea, a simple win probability graph at Pro-Football-Reference.com identifies a not-surprising choice as the most influential play in NFL History: Wide Right. What is surprising is that they give Buffalo a 99% chance of winning after Jim Kelly spiked the ball to set up Scott Norwood’s kick. Obviously, that’s way off. [1]I think it happens because their model basically gives you credit for your expected points on the drive, which is enough to win since Buffalo was down by a point.

A better estimate would say him missing the kick lowered the Bills chances of winning from about 45% to about 0%. Norwood was about 60% for his career from 40-49 yards out, and 2 for 10 from over 50. Moreover, he was 1 for 5 on grass from 40-49 before that kick. But the conditions in Tampa that night were close to ideal for kicking. It’s hard to put an exact number on things, but around 45% on that 47-yard kick seems about right.

So that 45 percentage point swing in a team’s chances of being the champ is what I’m going to call our SBD, or Super Bowl Delta, value. I’m going to identify the twenty plays with the biggest SBD values, the ones that swung the needle the most.

Here are the ground rules for making the cut. [continue reading…]

References

References
1 I think it happens because their model basically gives you credit for your expected points on the drive, which is enough to win since Buffalo was down by a point.
{ 20 comments }

xp avgThe NFL’s Competition Committee is currently considering rules changes to eliminate the boredom associated with the extra point. As you can see from the graph above, extra points are practically automatic now, to the tune of a 99.6% conversion rate in 2013. In fact, extra points have been close to automatic for awhile; the success rate was even as high as 96.8% in 1973, the last year the goal posts were still right on the goal line. The conversion rate was depressed for about 15 years before bouncing back to 97% in 1989, and there have been just 18 missed extra points total in the last three years. I don’t disagree that something could be done to improve the quality of the game.

The simplest alternative is to make touchdowns worth seven points instead of six, and to allow a team to gamble one of those points in the hopes of getting two points by “going for two.” In other words, we would have the system we have now, except that the song and dance of actually kicking the extra point is replaced with an automatic point.

Another solution is to eliminate the extra point entirely, requiring that teams go for two after every touchdown. I won’t try to answer the subjective question of whether or not this would make for a more enjoyable fan experience; the more interesting question to me is whether or not this would lead to more upsets. In other words, if teams had to go for two after every touchdown, would this lead to the better team winning more or less often? I posed this question on the Footballguys.com message boards and got into a good discussion there, much of which I’ll summarize here.

Before analyzing, we must recognize that the two-point play is not like a typical NFL play. A team that’s great in short yardage (say, Carolina) would probably be better off than most teams at converting on these attempts. Likewise, teams that excel in goal-line defense but maybe don’t have great corners (like say, Carolina) would probably be better off, too. But I think, on average, good teams are better at converting two point plays than bad teams, and, on average, good teams are better at preventing two point conversions than bad teams.

So how would such a rule change impact NFL games? One argument that this rule change would make the better team more likely to win is that this would present an additional hurdle for the weaker team. By replacing a play where everyone is successful with a competitive play, this increases the sample size, generally a bad thing for underdogs. Right now, a weaker team only needs to match the stronger team touchdown for touchdown (and field goal for field goal and safety for safety). But if the weaker team matches the better team under this new regime, the weaker team, on average, will still be trailing. By increasing the sample size of relevant plays, the weaker team needs to outplay the better team for longer, making it harder to pull the upset.

On the other hand, the argument is probably more convincing the other way that a mandatory “go for two” rule would lead to more upsets. That’s because the 2-point conversion play is a high-leverage play, and the inclusion of more high-leverage plays is generally a positive circumstance for the underdog. Imagine a rule change where the NFL made going for 2 mandatory, but made the successful outcome worth 20 points. That environment would almost certainly make things better for weaker teams: instead of having to outplay the better team for 60 minutes, the weaker team could be outplayed and win as long as they won on two or three key plays. That’s taking the example to its extreme, but one could argue that the same idea holds with the conversion worth two points, even if the effect would obviously be muted.

Here’s another way to think about it.  Let’s ignore games that aren’t very competitive, because the outcomes of those games won’t change under the current format or the “mandatory go for two” environment.  But there are three other types of games: [continue reading…]

{ 10 comments }

The prevailing view is that Vegas is an example of an efficient market. If there were obvious trends that oddsmakers ignored, it would be easy for people to make money gambling on football, and we know that’s not the case. But I thought it would be interesting to investigate some claims I’ve heard over the years, so I’m introducing the Efficient Vegas tag to Football Perspective.

One theory I’ve heard is that when good teams play bad teams, the smart money is to bet on the bad teams. That’s not because Vegas doesn’t know what it was doing, but that oddsmakers know that fans like to bet on good teams when they play bad ones. But is this true? Here is how I decided to test that question.

From 1990 to 2013, there were 792 games that met the following four criteria: [continue reading…]

{ 26 comments }

Austin and the Rams blew out the Colts

Austin and the Rams were nonconformists.

In week 10 of the 2013 season, the Rams traveled to Indianapolis. By the end of the season, St. Louis had an SRS grade of +2.2, meaning they were 2.2 points better than average. The Colts finished 2013 with an SRS grade of +4.1; if you award three points for home field, we would expect Indianapolis to have defeated St. Louis by 4.8 points (the Colts, in fact, were 9-point favorites). What happened? You probably remember: Tavon Austin had a record-setting day, the Rams jumped out to a 28-0 halftime lead, and Andrew Luck wasn’t able to mount one of his patented comebacks. St. Louis posted a Game Script of 23.2, the second largest result of the season, en route to a 38-8 victory.

Instead of a 4.8-point loss, the Rams won by 30 points. That difference of 34.8 points made it the least-conforming game of the 2013 season. What was the most? In week 6, the Chiefs (SRS of +6.1) hosted the Raiders (SRS of -8.0) and won, 24-7.

The table below shows every regular season game in 2013.  The “Boxscore” cell is linked to the boxscore for that game on PFR, the “Exp” column shows the expected result, and the “Diff” column — by which the table is sorted — shows the difference between the expected result and the actual result. [continue reading…]

{ 4 comments }

What Teams Might Sign Jimmy Graham?

What uniform will Graham be wearing in 2014?

What uniform will Graham be wearing in 2014?

On February 28th, the Saints elected to use the non-exclusive franchise tag on Jimmy Graham. The big dispute now is whether Graham should be classified as a tight end or a wide receiver; if Graham is classified as a tight end, the tag is worth $7.0 million, a number that jumps to $12.3 million if he’s labeled a wide receiver. An arbitrator will decide which position Graham plays for New Orleans, but it’s the type of tag the Saints used that’s interesting to me.

By using the non-exclusive tag, any team can sign Graham to a contract… provided such a team is willing to give up two first round draft picks to the Saints on top of the huge contract needed to lure Graham. On the surface, giving up so much capital for a tight end non-quarterback seems absurd, as the new Collective Bargaining Agreement has increased the value of rookies to a team. Players in their first four seasons contribute nearly half of all value provided by NFL players each season, and these players are now on very cheap contracts. As a result, teams should be even more hesitant to trade draft picks for players than they were before.

But that analysis doesn’t foreclose the idea that for a handful of teams, giving up picks for Graham could be a smart idea. And here’s something important to keep in mind: a team can sign Graham after the draft, giving up only 2015 and 2016 first round picks. We can all agree that there is some time value to draft picks; what does this mean for those future first round picks? Are they equivalent to a 2014 2nd and 2014 3rd? Well, probably not, but they’re not equal to two 2014 firsts, either.

Signing Graham would be a poor decision for most teams, but a team that meets several of these qualifications could justify the decision:

  • In a win-now window, i.e., a team that has a very good chance of winning a title in 2014 and 2015, and just an average chance down the road.
  • That would benefit specifically from harming the Saints
  • One offensive playmaker away from being a challenger
  • Expecting to have very good records in 2014 and 2015
  • In great salary cap shape, mitigating the impact of a large Graham contract

The Seahawks, with huge contracts on the horizon for Russell Wilson, Earl Thomas, and Richard Sherman, along with several others, are probably out of the mix because Seattle is not in great long-term cap shape. And for most teams, giving up two first round picks is just too much. But there are a few teams that might find this to be a very tempting move:

[continue reading…]

{ 20 comments }

Terry Bradshaw finished his career with 212 touchdowns, 210 interceptions and a 70.9 passer rating. Kurt Warner threw 208 touchdowns against only 128 interceptions, and his 93.7 passer rating ranks 8th in NFL history and 2nd among retired players. But Bradshaw played from 1970 to 1982, while Warner played from 1998 to 2009. As a result, comparing their raw statistics holds very little meaning. Comparing across eras is very challenging, but not impossible. And in this case, once you place the numbers in the proper context, Bradshaw’s numbers were arguably more impressive than Warner’s numbers.

Let’s start with Bradshaw and begin by looking at his Relative ANY/A for each year of his career. For new readers, ANY/A stands for Adjusted Net Yards per Attempt, defined as

(Gross Pass Yards + 20 * PTDs – 45 * INTs – Sack Yds)/(Attempts + Sacks)

Relative ANY/A simply compares a quarterback’s ANY/A average to league average, a necessary element when comparing quarterbacks across eras. In the graph below, the size of the bubble corresponds to how many attempts Bradshaw had in each season, while the Y-Axis shows Bradshaw’s Relative ANY/A (by definition, 0 is equal to league average).  The graph shows a clear story: for the first five years of his career, Bradshaw was a below-average quarterback, but over the rest of his career, he was one of the best in football. His best year came in 1978 when Bradshaw finished with a RANY/A of +2.0, which was the third best mark in football (only a hair behind Roger Staubach and Dan Fouts). Those stats, combined with a 14-2 record, led to Bradshaw being named the AP’s MVP that season. [continue reading…]

{ 41 comments }

Was Smith's fast finish a sign of things to come?

Was Smith's fast finish a sign of things to come?

In Geno Smith’s first 12 NFL starts, he completed 179 of 327 passes (54.7%) for 2,256 yards, with 8 touchdowns and 19 interceptions. Those numbers translate to a 6.9 yards per attempt average, quite respectable for a rookie, and a 4.8 Adjusted Yards per Attempt average, abysmal for anybody. But over the last four weeks of the year, Smith went 68/116 (58.6%) for 790 yards with 4 touchdowns and 2 interceptions. His yards per attempt actually went down slightly to 6.8, but he averaged 6.7 AY/A, much closer to league average. Touchdowns and interceptions are less sticky statistics than yards per attempt, but Jets fans looking for reasons for optimism would cling to the massive flip in touchdown-to-interception ratio over the final quarter of the season.

The real question is whether any of that matters. In general, I’m a Splits Happen type of analyst, but I thought I would run some numbers. As it turns out, perhaps there is some reason to think Smith’s strong December (subject to the caveats below) is a sign of good things to come.  Here’s what I did:

From 1990 to 2013, there were 51 quarterbacks who threw at least 224 passes during their rookie season. Toss out the 2013 rookies (EJ Manuel, Smith, and Mike Glennon), along with the nine quarterbacks who threw fewer than 100 passes in year two (Jimmy Clausen, Ryan Leaf, Kyle Orton, Chad Hutchinson, Andrew Walter, Bruce Gradkowski, Chris Weinke, Ken Dorsey, and Matt Stafford), and that leaves us with 39 quarterbacks who threw at least 224 passes as a rookie since 1990 and then at least 100 passes in their second season. For those quarterbacks, I calculated their Y/A and AY/A averages over their final 4 games of the season, and their Y/A and AY/A averages over the first 1-12 games of the season (with the 224 pass attempts minimum, I felt pretty confident that we would have a large enough sample on the “early” portion of the season).  Then I looked at how those 39 quarterbacks fared in their second years.

The table below shows all 39 quarterbacks, plus the 2013 rookies.  Here’s how to read the table below.  Heath Shuler, a rookie for Washington in 1994, had 150 “early” season attempts, defined as all pass attempts before the final 4 games of the season.  His early year Y/A average was 5.0 and his AY/A average was 2.8.  Shuler had 115 “late” season attempts, defined as pass attempts in the final four games.  His Y/A in the late part of the season was 7.9, and his AY/A was 7.8.  As a result, Shuler improved his Y/A by 3.0 and his AY/A by 5.0 over the final four games of the season.  In Year N+1 — i.e., 1995 for Shuler — he had 125 pass attempts, and averaged 6.0 Y/A and 3.9 AY/A. [continue reading…]

{ 10 comments }

The Top Ten Free Agent Acquisitions of 2013

Mike Wallace did not prove to be a steal.

Mike Wallace did not prove to be a steal.

On March 11, the 2014 League Year — and the start of free agency — officially begins. But before we turn our attention to Michael Vick and Eric Decker and Greg Hardy and the free agent class of 2014, I thought it would useful to look back at last year’s free agency class.

If there’s one rule of free agency, it’s don’t get too excited: of the many men who signed with new teams a year ago, just three of them made the Pro Bowl in 2013. Just one of them was named a first-team All-Pro by the Associated Press. March optimism may be enticing, but it is usually misplaced. For example, I reviewed the top 20 free agents identified by Pro Football Talk at the start of free agency last year; thirteen of those players wound up switching teams in free agency, but few were impact players.

At wide receiver, Mike Wallace, Greg Jennings, and Danny Amendola all fell far short of expectations, and even Wes Welker produced a below-average stat line for by his standards. The Rams spent big money to acquire Jake Long and Jared Cook; while neither player was bad, the Rams offense was just as uninspiring in 2013 as it was before either of them arrived in St. Louis. Outside linebackers Paul Kruger and Connor Barwin were brought to Cleveland and Philadelphia to bring the heat, but the duo combined for just 9.5 sacks despite playing in 32 games. The big move in the secondary was Tampa Bay’s signing of Dashon Goldson; and while he provided an upgrade for the Bucs, it was not one commensurate with his contract.

On the positive side, cornerbacks Sean Smith and Dominique Rodgers-Cromartie played well enough in Kansas City and Denver.  Meanwhile, the two best signings may have Cliff Avril and Michael Bennett helped bring a championship to Seattle.  But in general, big free agent contracts don’t tend to live up to expectations, and last year was no exception.

[continue reading…]

{ 12 comments }

Book Review: The Goldfinch, by Donna Tartt

Reviewing a work of fiction falls pretty far outside the normal parameters of this site, [1]While there’s some precedent for literature on a football blog, I’ll be honest about the real reason for today’s post. I publish a post daily, so it feels odd to spend countless … Continue reading but I’ll give it a shot with Donna Tart’s newest book, The Goldfinch. Her novel will be one of the more popular books of the year: it’s 8th on the list of best-selling E-Books and the number two best-seller on Amazon’s fiction hardcopy book list. There are many reviews already out there for you to read, although I’ve quickly learned that reading most book reviews is a miserable experience.  So I’ll write a review that I’d want to read for a book I’m deciding whether I want to read.

A bomb explodes at the Metropolitan Museum of Art. In the museum at the time are 13-year-old Theodore Decker (the main character and narrator), his mother, and a pair of strangers whose presence form the first link in the long chain of events that make up our story. Theo’s mother dies in the terrorist attack, and the first act takes us through Theo’s life as a de facto 13-year-old orphan (his father and grandparents want nothing to do with him).

The title of the book comes from a real piece of art, painted in 1654 by the Dutch artist Carel Fabritius, and currently on display in the Frick Museum in New York City. In the aftermatch of the museum bombing, Theo takes off with the painting, and the book ostensibly is about Theo’s love for the painting.  Only that’s not really the case, at least not for many large sections of the book. As Julie Myerson noted in her review, we are told that there are two loves of Theo’s life — the painting and a girl — but both largely absent for hundreds of pages.  The painting itself is an afterthought for most of the first 85% of the book, although by the end, I felt that the novel was appropriately titled. [continue reading…]

References

References
1 While there’s some precedent for literature on a football blog, I’ll be honest about the real reason for today’s post. I publish a post daily, so it feels odd to spend countless hours reading a 775 page book and then not devote a word about it here.
{ 10 comments }

Predictions in Review: NFC South

During the 2013 offseason, I wrote 32 articles under the RPO 2013 tag. In my Predictions in Review series, I review those preview articles with the benefit of hindsight. Previously, I reviewed the AFC West, the NFC West, and the the AFC South. Today, the NFC South.

Who Will Win 2013 Head Coach of the Year, July 25, 2013

For reasons that are not quite clear to me, I have an unusual fascination with the Coach of the Year award. There’s no harder award to predict in all of sports, since the winner is essentially the coach of the team that had the least predictable (in a good way) season. Still, I threw my hat into the ring in 2014 and predicted that Sean Payton would win Coach of the Year. Here is what I wrote in July:

Rob Ryan is now in charge of a defense that ranked last in yards allowed, net yards per attempt allowed, rushing yards allowed, rushing yards per carry allowed, first downs allowed, Expected Points Added, and defensive DVOA. The 2012 Saints also ranked 31st in points allowed. Ryan himself won’t fix that, but first round pick Kenny Vaccaro should begin to help the problem secondary.

But the real reason for optimism is the always explosive Saints offense. Drew Brees, Jimmy Graham, and Darren Sproles are three of the more unique players in the NFL, and help give the Saints an outstanding passing offense. Of course, New Orleans passing attack was great before either Graham or Sproles arrived, as the Brees/Payton engine (with a dash of Marques Colston and Lance Moore) is at times unstoppable. …

Predicting who will win AP Coach of the Year is a fool’s errand, but I’m willing to put my chips on Brees and Payton leading the Saints to the playoffs in a “bounceback” year. The real question is whether that will be enough to convince the voters to select Payton.

As it turned out, Payton did lead a resurgent Saints team from 7-9 in 2012 to 11-5 in 2013; unfortunately for him, a playoff berth was not enough to get him Coach of the Year. That honor instead went to Ron Rivera, although in my eyes, Andy Reid was an immensely more deserving choice.

What can we learn: In week 16, the Panthers defeated the Saints on a touchdown pass with 28 seconds left in the game; had New Orleans won that game, the Saints would have finished 12-4 and won the division and a first round bye, knocking Rivera’s Panthers down to the 5 seed. Would that have been enough to swing the COTY award to Payton? Probably not, although it likely would have meant Reid would have won the honor. The Coach of the Year award remains impossible to predict.

Did you just grab my torch?

Did you just grab my torch?.

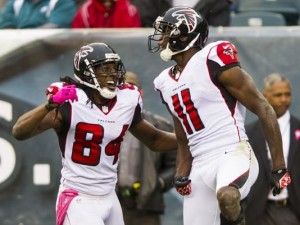
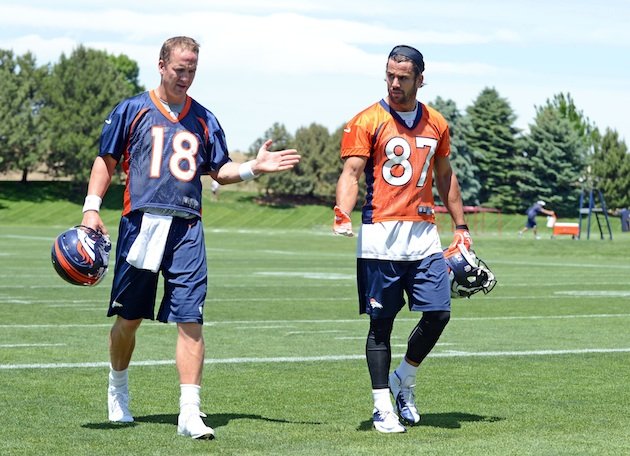
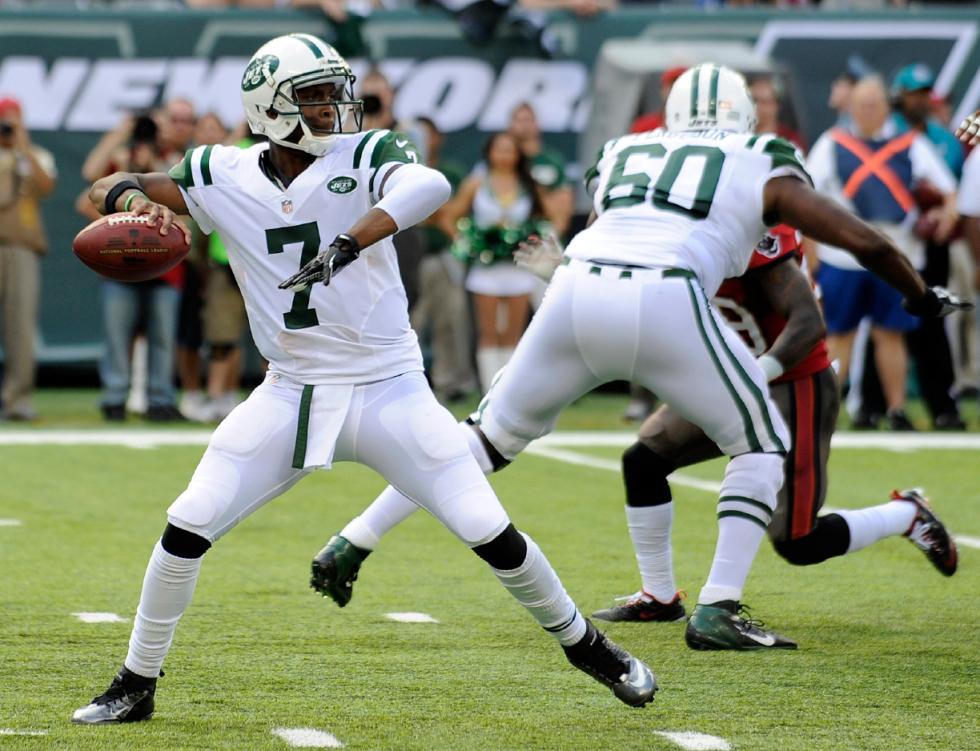
Julio Jones and Roddy White star in Stealing The Torch, July 31, 2013

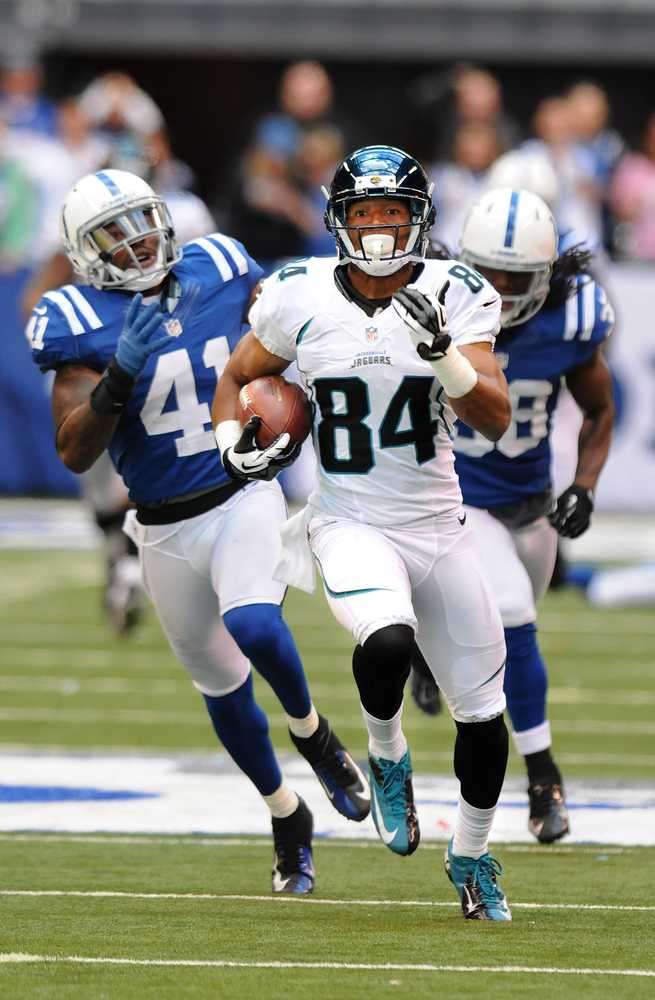
My other three NFC South posts were more walks down memory lane than predictions. The Falcons post was a look at other star wide receiver tandems that were similar to Julio Jones and Roddy White in 2012. This was a fun way to look at comparable receivers, but there was nothing fun about the Atlanta offense in 2013.  Jones averaged 116.0 yards per game last year, but that came over just five games. A foot injury suffered against the Jets in week 5 ended what looked to be a special season: Jones was leading the league in receptions (41) and was second in receiving yards (580) at the time. White, meanwhile, had an absymal start to his season that dragged on for months.

Hamstring and ankle injuries caused White to miss three full games and hampered his production in most of the others. At the end of November, he just 20 catches for 209 yards; at that point, the Falcons were 2-9, and I won’t fault you if you put Atlanta on “ignore” for the rest of the year. But White exploded with 43 catches for 502 yards in December, joining Josh Gordon (658) and Alshon Jeffery (561) as the only players with 500+ receiving yards in December 2013.

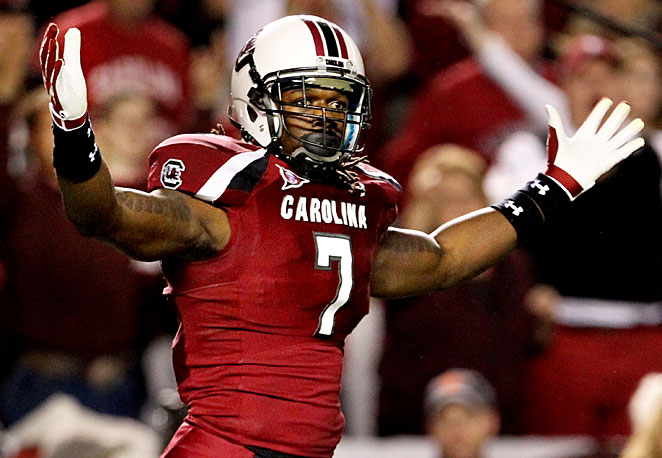
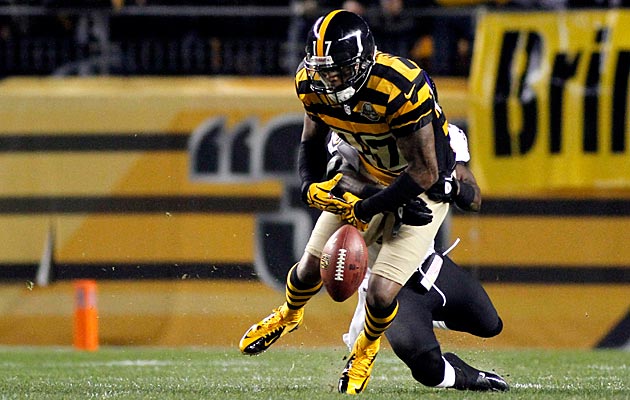
The Steve Smith Post, August 7, 2013

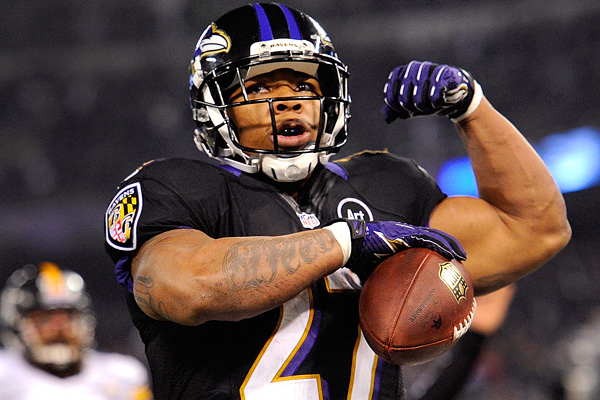
In August, I decided to compile the loose odds and ends I had collected on Steve Smith over the years. When the time comes, I plan on using that post to augment Smith’s Hall of Fame case. Unfortunately for Smith, the time may be coming sooner than he’d like. On December 1st, I wrote that Smith’s poor production may have been a reason for why Cam Newton’s numbers had declined.

Smith has had largely the same role in the Panthers offense for years, so it’s not unreasonable to compare his advanced metrics from each of Newton’s seasons.  In 2013, Smith caught 58.2% of his targets, which is in line with his production from 2012 (52.9%) and 2011 (61.2%). However, Smith started running much shorter routes — according to NFLGSIS, his average reception came just 8.9 yards downfield in 2013, compared to around 12 yards over the prior two years. Smith’s YAC also decreased (which is unusual, as shorter passes tend to lead to more YAC, making this another bad sign); as a result, his yards per target dropped from 10.8 in 2011 to 8.5 in 2012 to just 6.8 in 2013.  It was a down year in a Hall of Fame caliber career. Smith turns 35 in May; unfortunately, it seems safe to suggest that the best is behind him.

Can Tampa Bay Win the NFC South With the Worst Passing Attack?, August 13, 2013

Just about everyone assumed the Bucs would have the worst starting quarterback in the NFC South. What interested me was the rest of the team. The question I posed was more trivia than analysis: how often does the team with the worst passing attack in the division wind up winning the division?

The answer: Since 1950, only nine teams pulled off that feat, with nearly half of them coming since the league moved to a four-teams-per-division-for-each-division format in 2002. No team pulled off that feat in 2013, although the Panthers ranked 3rd in the NFC South in Adjusted Net Yards per Attempt. The team that ranked last in the division was, of course, the Bucs.

The Bucs ranked 32nd in NY/A and finished the year 4-12. But remember: Tampa Bay faced the hardest schedule in the league in 2013. Early DVOA estimates project the Bucs for 7.7 wins in 2014, and there are reasons for optimism in Tampa Bay in 2014.

{ 3 comments }

Pittsburgh’s Aaron Donald Was Your Combine MVP

Building on yesterday’s post, I decided to crown a combine MVP because it’s February and there’s nothing else to do. I looked at each player’s combine results, courtesy of the great NFLSavant.com, in four different tests.

40-yard dash

There were 268 players with 40-yard dash times posted at NFL Savant. I ran a regression using weight as the input and 40-yard time as the output, and the best-fit formula (R^2 of 0.75) was:

[math]Expected 40 Time = 3.433 + 0.00554 * Weight[/math]

Using this formula, Jadeveon Clowney, with a weight of 266 pounds, would be projected to run the 40 in 4.91 seconds. Since he actually ran the 40 in 4.53 seconds, he gets credited for finishing +0.38 seconds above expectation. That was the best of any player in Indianapolis this year. The table below shows, for each of the 268 players (the table, by default, displays only the top 10, but you can change that in the dropdown box), their weight, their actual 40 time, their expected 40 time, and the difference. Auburn tackle Greg Robinson hopes be a top-five pick, and his 40 time does a good job displaying his athleticism. Pittsburgh’s Aaron Donald comes in third, but there will be plenty of reasons to talk about him later. [continue reading…]

{ 20 comments }

Thoughts on Jadeveon Clowney’s 40-yard dash time

The hype on Clowney is almost as wide as his wingspan

The hype on Clowney is almost as wide as his wingspan.

Jadeveon Clowney ran the 40-yard dash in 4.53 seconds, which only confirmed that the South Carolina star is an incredible athlete. But how freakishly insane is that time? The 40-yard dash, like every other aspect of the combine, is only useful when placed in proper context. The dash is biased in favor of lighter players; one way to control for this drawback is to measure Clowney only against defensive ends and linebackers, although that doesn’t totally solve the weight issue. That’s one reason Football Outsiders has published a Speed Score for running back prospects, calculated as (Weight * 200)/(40 time^4).

The website NFLsavant.com is an excellent source of historical combine data going back to 1999. I looked at all the defensive ends and outside linebackers with 40-yard times over that period, and ran a few regressions to get a sense of the relationship between weight and speed. A simple one worked just as well as the more complicated ones, and that formula produced an R^2 of 0.30. That best-fit formula was 40-yard time = 3.609 + 0.00455*weight. So for Clowney, at a weight of 266 pounds, he would be projected to run the 40 in 4.82 seconds. Since Clowney actually ran it in 4.53 seconds, that means he was 0.29 seconds faster than we would expect.

That is really, really good, although you already knew that. Here’s some more context. NFLSavant.com has 706 defensive ends or outside linebackers since 1999 with 40-yard times. Clowney, by rating 0.29 seconds better than expected, comes in ahead of 700 of those players. The other five?

[continue reading…]

{ 9 comments }

Predictions in Review: AFC South

During the 2013 offseason, I wrote 32 articles under the RPO 2013 tag. In my Predictions in Review series, I review those preview articles with the benefit of hindsight. Previously, I reviewed the AFC West and the NFC West. Today, the AFC South, beginning with a straightforward case in Tennessee.

Britt smoked the Eagles secondary

Britt smoked the Eagles secondary.

Can Kenny Britt become the next great wide receiver?, July 9, 2013

Spoiler alert: Kenny Britt did not become the next great wide receiver, at least in 2013 (apparently, I still can’t quit him). Britt is an easy player to fall in love with, if you ignored the warning signs. He was just 20 years old when he played in his first NFL game in 2009. In 2010, he led all players in yards per route run according to Pro Football Focus, but his raw numbers underhwlemed because the Titans were a run-heavy team and Britt missed 30% of the season with a hamstring injury. In 2011, he matched his elite YPRR production, but a torn ACL/MCL tear ended his season after 94 pass routes.

He struggled in 2012, but I was willing to write that off due to recovering from the ugly knee injury, additional hamstring and ankle injuries, and a first-year starter in Jake Locker. That set up 2013 as a season where I thought Britt had great breakout potential. I interviewed Thomas Gower, of Total Titans and Football Outsiders, and asked him his thoughts. Gower was more pessimistic than I was about Britt, and for good reason.

As it turned out, Britt never seemed quite right mentally (in more ways than one); he struggled with drops and was eventually dropped behind Justin Hunter and Kendall Wright on the depth chart. He finished the year with 11 catches for only 96 yards and no touchdowns. In late December, Britt said he would definitely be a #1 wide receiver somewhere in 2014, which means I’m susceptible to falling into the Britt trap again. [continue reading…]

{ 2 comments }

The 1956 NFL Season: The Forward Pass on Life Support

The history of offense in the NFL is not a linear one. The early ’70s was the dead-ball era of the passing game, and it’s largely true that pass frequency and efficiency have steadily increased since then. But NFL teams passed more frequently in the ’60s than they did in the ’70s, and passing ratios wildly fluctuated in the ’50s. The picture below shows the league-average pass ratio for the NFL [1]I have excluded the AFL statistics from this data set. for each year from 1950 to 1980. Pass ratio is simply defined as (Pass Attempts + Sacks) / (Pass Attempts + Sacks + Rush Attempts).

p-r rat2

As you can see, 1956 represents a huge outlier over the 30-year period. Pass ratios dropped significantly in 1956, increased slightly in 1957, and then spiked back up, seemingly without reason. The other main valley, of course, was in the mid-1970s. The pass-to-run ratio dropped every year after the merger before plummeting to 43% in ’73. It spiked back up temporarily in ’74 and ’75 before dropping again, bottoming out at 42% in ’77 and necessitating the 1978 rules changes.

The next graph shows the league-average ANY/A for each season (in green) and the Adjusted Yards per Carry average (Rushing Yards + 20*Rushing TDs) / (Rush Attempts) in red. As you can see, passing was slightly more effective than rushing in the mid-’60s, which presumably caused a shift towards more passing. As pass efficiency decreased, so did pass attempts. [continue reading…]

References

References
1 I have excluded the AFL statistics from this data set.
{ 14 comments }

Brown was number one in 2013

Brown was number one in 2013.

Wide receiver is a notoriously difficult position to analyze using statistics. Era adjustments are arguably more important here than at any other position, but even within the same season it is not easy to compare wide receivers. Most people, myself included, would probably say that Josh Gordon or Calvin Johnson was the best wide receiver in football in 2013. Gordon, after all, led the NFL in receiving yards despite missing two games, while Johnson is well, Megatron. If you place more emphasis on other metrics, you would be interested to know that Pierre Garcon led the NFL in receptions, while Jimmy Graham led all players in receiving touchdowns (and Demaryius Thomas led all wide receivers in that statistic).

But, as you can tell from the title of this post, it was Pittsburgh’s Antonio Brown who led all players in True Receiving Yards. Regular readers are familiar with the concept of True Receiving Yards, but walking through the system with both Brown and Gordon will serve as a useful reminder.

Let’s start by recognizing that Brown’s season was special in its own right: he became the first player to record 50 receiving yards in 16 different games in a single season. He also finished 2nd in both receptions and receiving yards, so it doesn’t take much processing through the True Receiving Yards machine to vault Brown into first place. He ended the year with a 110-1499-8 stat line, while Gordon finished 2013 with 87 catches for 1,646 yards and nine scores.

The first step in the True Receiving Yards calculation is to convert each player’s stat line into a single statistic, Adjusted Catch Yards. By giving each player 5 yards for each reception and 20 yards for each touchdown, Brown is credited with 2,209 Adjusted Catch Yards and Gordon 2,261, making them the top two players in 2013 by that metric. [continue reading…]

{ 3 comments }

Estimated DVOA Ratings From 1950 to 2013

For over a decade, Football Outsiders has been publishing its DVOA grades. Last week, Andreas Shepard, a loyal reader of both FO and this site, came up with estimated DVOA ratings going back to 1950. You can read the fine print on how he derived the formula in the Methodology section at the end of this post. Andreas did an excellent job looking at some of the best and worst teams in many different DVOA categories, so you should give his article a read. But to me, at least, the real value of team ratings for over 1600 teams in 8 different categories is as a reference piece. And since the tables I create here are both sortable and easily searchable, I’ve worked with Andreas to present the team ratings in a way to make life easy for the reader. Consider these like an encyclopedia for team ratings, available for you to find the team you’re interested in whenever you like.

Andreas created estimated DVOA ratings for each year from 1950 to 2013 (remember, Football Outsiders has posted actual DVOA ratings published for each year from 1989 to 2013, but I am providing the estimates for each year.) The table below shows all 1638 teams from 1950 to 2013; here’s how to read the table below, which is sorted from best to worst in Total DVOA. The Packers (you can click the link to see Green Bay’s PFR page that year) in 1962, playing in the NFL, rank as the top team in estimated DVOA. That year, Green Bay went 13-1 with a winning percentage of 0.929 and a points differential of 19.1 points per game.

The Packers had an Offensive Pass DVOA grade of 18.9% and an Offensive Run DVOA grade of 23.0%; all DVOA ratings are centered around 0%, so this shows how the Packers were well above average in both offensive measures. For defensive ratings, negative grades are better, and the Packers have an incredible -33.2% estimated Defensive Pass DVOA grade, along with a -8.6% estimated Defensive Run DVOA grade. The Packers’ Total Offensive DVOA grade was 21.4%, the Total Defensive DVOA grade was -20.7%, and the Special Teams DVOA grade was 5.8%. Finally, the Packers have a total estimated DVOA of 47.9%, the best since 1950. If you type “gnb” into the table below, you will see all Packers teams. You can type in any team’s code to see just their teams, or sort the table by any of the categories available.

[continue reading…]

{ 10 comments }

When will a team go an entire game without running?

Belichick checks to see if anyone has gone a whole game without calling a run yet

Belichick checks to see if anyone has gone a whole game without calling a run yet.

The record for fewest rush attempts in a game is 6, set by the 2004 Patriots and tied by the ’06 Cardinals. The circumstances there are as you would expect. The Patriots fell behind 21-3 in the first quarter to the Steelers in 2004, and Pittsburgh owned the league’s top rush defense. In 2006, the Cardinals faced the Minnesota Vikings, owners of one of the greatest rush defenses in history. Minnesota allowed just 985 yards (the second lowest in modern history) on 2.8 yards per carry (the third lowest mark of the modern era) in 2006. That day, the Cardinals didn’t fall behind early, but called on Matt Leinart to throw 51 passes compared to just four Edgerrin James runs. It was not a winning formula, but I’m not sure Denny Green had the wrong strategy.

But will a team ever go a full game without attempting a run? In college, the floor has also been six runs, at least in recent memory. Baylor — with coach Guy Morris, who coached under Hal Mumme and next to Mike Leach at both Valdosta State and Kentucky — was the first, calling just six runs on the road against the 2006 Texas Longhorns. A year later in Austin, it was Leach who orchestrated the only other six-carry game since 2005. That day, he put the game in the hands of Graham Harrell (36/48, 466 yards, 5 TDs, 1 INT), Michael Crabtree (9/195/2), Danny Amendola (8/82) and Edward Britton (8/125/1), but alas, the Red Raiders defense couldn’t stop Jamaal Charles.

I suppose we should wonder when the first 5-carry game will occur before asking about the first 0-carry game. But it’s a Sunday in the offseason, so I’ll throw this one out to the crowd. Will we ever see a 0-carry game? If so, how many years from now until it occurs? Against the Bills this year, the Ravens called 31 straight passing plays but still passed on “only” 86% of all plays from scrimmage. What will it take to get that percentage to 100?

{ 15 comments }