
Joe Montana’s teams were really good at winning football games, going 117-47 and 16-7 in games started by the Hall of Fame quarterback. Montana’s teams had a 0.711 overall winning percentage, which is great; but what’s even more remarkable is how well his teams did against the points spread.
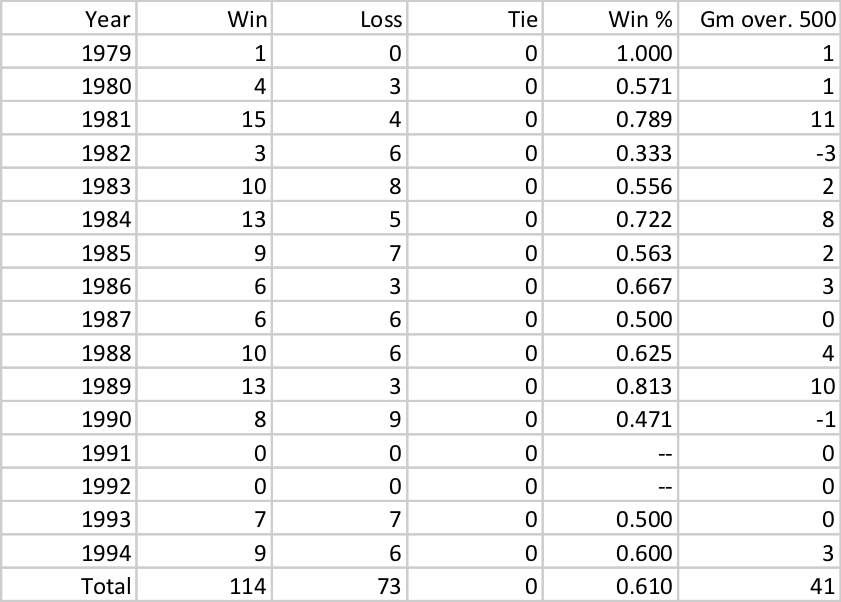
On average, Montana’s teams were favored by 4.5 points. And given the nature of how points spreads work, you would expect most teams to win about half of their games against the spread. But Montana’s teams went 114-73 against the spread, a remarkable winning percentage of 0.610. Much of the success was due to the 49ers of 1981 (15-4 ATS), 1984 (13-5), and 1989 (13-3). The ’81 team was one of the most surprising Super Bowl champions of all time; San Francisco was favored in just 9 of 19 games that year, with three of those spreads being just 1-point lines. And the ’84 and ’89 teams were two of the greatest teams of all time, so it’s not surprising that they had great ATS records, too. The table below show’s the record against the spread for each of Montana’s teams in each season of his career:
 …
…
Also really good against the spread, of course, is Tom Brady and the Patriots. The ’01, ’03, and ’04 Patriots were all Super Bowl champions that were remarkable against the spread, combining to go 41-11-3 relative to the Vegas odds. The Patriots remained solid but unspectacular against the spread since then, although the ’16 team went 13-2 with Brady under center.

What makes the Brady stuff all the more remarkable: the last 52 times the Patriots have taken the field with Brady under center, the Patriots have been favored. And you have to go back 60 games, November 2014 game against the Packers, where New England has been underdogs with Brady under center. More on that tomorrow.
As it turns out, I didn’t pick Montana and Brady at random. Among all quarterbacks since 1978 (which is as far back as the PFR points spread data goes), they have the top two winning percentages against the spread (minimum 40 starts). Although that perhaps isn’t as impressive as it might sound at first glance: the rest of the top 5 are David Woodley, Jim McMahon, and Bubby Brister. The table below shows each quarterback’s winning percentage against the spread since 1978; for quarterbacks who started games prior to 1978, they are included, but have ** next to their name as a reminder that this data does not show their full career.
| Rk | Quarterback | FYr | LYr | Starts | Win ATS | Loss ATS | Tie ATS | Win % | Avg Spread |
|---|---|---|---|---|---|---|---|---|---|
| 1 | Joe Montana | 1979 | 1994 | 187 | 114 | 73 | 0 | 0.61 | -4.5 |
| 2 | Tom Brady | 2001 | 2017 | 288 | 169 | 112 | 7 | 0.599 | -5.4 |
| 3 | David Woodley | 1980 | 1985 | 58 | 34 | 23 | 1 | 0.595 | -1.7 |
| 4 | Jim McMahon | 1982 | 1994 | 103 | 58 | 39 | 6 | 0.592 | -2 |
| 5 | Bubby Brister | 1986 | 1998 | 77 | 44 | 30 | 3 | 0.591 | 0.7 |
| 6 | Aaron Rodgers | 2008 | 2017 | 158 | 91 | 63 | 4 | 0.589 | -4.2 |
| 7 | Andrew Luck | 2012 | 2016 | 76 | 43 | 30 | 3 | 0.586 | -0.1 |
| 8 | Doug Flutie | 1986 | 2004 | 68 | 38 | 27 | 3 | 0.581 | 0 |
| 9 | Danny White | 1978 | 1987 | 102 | 58 | 42 | 2 | 0.578 | -4.3 |
| 10 | Gary Danielson** | 1978 | 1988 | 59 | 33 | 24 | 2 | 0.576 | 0.7 |
| 11 | Stan Humphries | 1990 | 1997 | 87 | 49 | 36 | 2 | 0.575 | -0.7 |
| 12 | Joe Theismann** | 1978 | 1985 | 121 | 68 | 50 | 3 | 0.574 | -1.9 |
| 13 | Donovan McNabb | 1999 | 2011 | 177 | 99 | 73 | 5 | 0.573 | -2.6 |
| 14 | Rodney Peete | 1989 | 2003 | 89 | 49 | 36 | 4 | 0.573 | 1.2 |
| 15 | Charlie Batch | 1998 | 2012 | 55 | 31 | 23 | 1 | 0.573 | 1.8 |
| 16 | Jay Fiedler | 1999 | 2004 | 63 | 35 | 26 | 2 | 0.571 | -1.4 |
| 17 | Vince Young | 2006 | 2011 | 51 | 29 | 22 | 0 | 0.569 | 0.8 |
| 18 | Jim Plunkett** | 1980 | 1986 | 67 | 37 | 28 | 2 | 0.567 | -3 |
| 19 | Andy Dalton | 2011 | 2017 | 113 | 61 | 46 | 6 | 0.566 | -1 |
| 20 | Cam Newton | 2011 | 2017 | 115 | 63 | 48 | 4 | 0.565 | -0.6 |
| 21 | Derek Anderson | 2006 | 2016 | 47 | 26 | 20 | 1 | 0.564 | 2.7 |
| 22 | Don Majkowski | 1987 | 1996 | 57 | 32 | 25 | 0 | 0.561 | 2.6 |
| 23 | Russell Wilson | 2012 | 2017 | 108 | 59 | 46 | 3 | 0.56 | -4.8 |
| 24 | Bill Kenney | 1980 | 1988 | 77 | 43 | 34 | 0 | 0.558 | 2.6 |
| 25 | Ron Jaworski** | 1978 | 1989 | 133 | 72 | 58 | 3 | 0.553 | -0.3 |
| 26 | Phil Simms | 1979 | 1993 | 169 | 91 | 74 | 4 | 0.55 | -1.3 |
| 27 | Alex Smith | 2005 | 2017 | 158 | 84 | 69 | 5 | 0.547 | -0.9 |
| 28 | Terry Bradshaw** | 1978 | 1983 | 78 | 42 | 35 | 1 | 0.545 | -5.8 |
| 29 | Eric Hipple | 1981 | 1989 | 58 | 31 | 26 | 1 | 0.543 | 0.9 |
| 30 | Drew Brees | 2002 | 2017 | 261 | 139 | 117 | 5 | 0.542 | -2.2 |
| 31 | Dave Brown | 1994 | 2000 | 60 | 32 | 27 | 1 | 0.542 | 3.2 |
| 32 | Elvis Grbac | 1995 | 2001 | 73 | 38 | 32 | 3 | 0.541 | -1.8 |
| 33 | Jay Schroeder | 1985 | 1994 | 104 | 55 | 47 | 2 | 0.538 | -1 |
| 33 | Steve Beuerlein | 1988 | 2003 | 104 | 55 | 47 | 2 | 0.538 | 1.1 |
| 35 | John Elway | 1983 | 1998 | 252 | 129 | 110 | 13 | 0.538 | -2.8 |
| 36 | Case Keenum | 2013 | 2017 | 40 | 21 | 18 | 1 | 0.538 | -0.2 |
| 37 | Jim Zorn** | 1978 | 1987 | 82 | 43 | 37 | 2 | 0.537 | 2.6 |
| 37 | Kyle Orton | 2005 | 2014 | 82 | 43 | 37 | 2 | 0.537 | 1 |
| 39 | Peyton Manning | 1998 | 2015 | 292 | 154 | 133 | 5 | 0.536 | -4.3 |
| 40 | Dave Krieg | 1981 | 1996 | 184 | 96 | 83 | 5 | 0.535 | -0.5 |
| 41 | Trent Dilfer | 1994 | 2007 | 119 | 63 | 55 | 1 | 0.534 | 1 |
| 42 | Eli Manning | 2004 | 2017 | 226 | 118 | 103 | 5 | 0.533 | -0.4 |
| 43 | Marc Wilson | 1981 | 1990 | 61 | 32 | 28 | 1 | 0.533 | -1.1 |
| 44 | Brad Johnson | 1996 | 2008 | 132 | 68 | 60 | 4 | 0.53 | -1.6 |
| 45 | Bobby Hebert | 1985 | 1996 | 103 | 54 | 48 | 1 | 0.529 | -0.9 |
| 46 | Jake Delhomme | 1999 | 2010 | 104 | 53 | 47 | 4 | 0.529 | -1.2 |
| 47 | Mike Pagel | 1982 | 1990 | 54 | 27 | 24 | 3 | 0.528 | 5.8 |
| 48 | Ben Roethlisberger | 2004 | 2017 | 219 | 114 | 102 | 3 | 0.527 | -3.9 |
| 49 | Matt Ryan | 2008 | 2017 | 168 | 88 | 79 | 1 | 0.527 | -1.4 |
| 50 | Vince Ferragamo | 1979 | 1985 | 59 | 28 | 25 | 6 | 0.525 | -0.5 |
| 50 | Jim Kelly | 1986 | 1996 | 177 | 92 | 83 | 2 | 0.525 | -3.1 |
| 50 | Tim Couch | 1999 | 2003 | 59 | 30 | 27 | 2 | 0.525 | 5.1 |
| 53 | Brett Favre | 1992 | 2010 | 322 | 161 | 146 | 15 | 0.523 | -2.7 |
| 54 | Tyrod Taylor | 2015 | 2017 | 43 | 21 | 19 | 3 | 0.523 | 0.7 |
| 55 | Joe Flacco | 2008 | 2017 | 169 | 84 | 77 | 8 | 0.521 | -2.3 |
| 56 | Joey Harrington | 2002 | 2007 | 76 | 39 | 36 | 1 | 0.52 | 3.6 |
| 57 | Byron Leftwich | 2003 | 2012 | 51 | 25 | 23 | 3 | 0.52 | 1.1 |
| 58 | Chris Chandler | 1988 | 2004 | 155 | 78 | 72 | 5 | 0.519 | 2.4 |
| 59 | Tony Banks | 1996 | 2003 | 78 | 38 | 35 | 5 | 0.519 | 2.7 |
| 60 | Steve McNair | 1995 | 2007 | 163 | 83 | 77 | 3 | 0.518 | -1.1 |
| 61 | Matt Cassel | 2008 | 2017 | 82 | 42 | 39 | 1 | 0.518 | 2 |
| 62 | Vinny Testaverde | 1987 | 2007 | 219 | 110 | 102 | 7 | 0.518 | 1.8 |
| 63 | Mark Malone | 1981 | 1988 | 55 | 28 | 26 | 1 | 0.518 | 1.6 |
| 64 | Brian Griese | 1999 | 2008 | 83 | 42 | 39 | 2 | 0.518 | -2.1 |
| 65 | Rich Gannon | 1990 | 2004 | 139 | 69 | 64 | 6 | 0.518 | -2.5 |
| 66 | Philip Rivers | 2006 | 2017 | 201 | 102 | 95 | 4 | 0.517 | -2.2 |
| 67 | Chad Pennington | 2002 | 2010 | 87 | 43 | 40 | 4 | 0.517 | 0.6 |
| 67 | Kirk Cousins | 2012 | 2017 | 58 | 30 | 28 | 0 | 0.517 | 1.4 |
| 69 | Derek Carr | 2014 | 2017 | 62 | 31 | 29 | 2 | 0.516 | 2.5 |
| 70 | Jeff Blake | 1994 | 2003 | 100 | 50 | 47 | 3 | 0.515 | 3.5 |
| 71 | Tommy Kramer** | 1979 | 1989 | 113 | 58 | 55 | 0 | 0.513 | 0.3 |
| 72 | Troy Aikman | 1989 | 2000 | 180 | 90 | 86 | 4 | 0.511 | -3.7 |
| 73 | Josh Freeman | 2009 | 2015 | 61 | 31 | 30 | 0 | 0.508 | 2.9 |
| 74 | Blake Bortles | 2014 | 2017 | 64 | 32 | 31 | 1 | 0.508 | 2.5 |
| 75 | Erik Kramer | 1987 | 1999 | 70 | 35 | 34 | 1 | 0.507 | 2.2 |
| 76 | Randall Cunningham | 1985 | 2001 | 144 | 71 | 69 | 4 | 0.507 | -2.1 |
| 77 | Mike Tomczak | 1986 | 1999 | 78 | 39 | 38 | 1 | 0.506 | -1.9 |
| 78 | Mark Brunell | 1995 | 2009 | 161 | 79 | 77 | 5 | 0.506 | -1 |
| 79 | Ken Anderson** | 1978 | 1985 | 92 | 46 | 45 | 1 | 0.505 | 0.7 |
| 80 | Chris Miller | 1987 | 1999 | 94 | 46 | 45 | 3 | 0.505 | 3.6 |
| 81 | Joe Ferguson** | 1978 | 1989 | 111 | 53 | 52 | 6 | 0.505 | 1.4 |
| 82 | Trent Green | 1998 | 2008 | 115 | 55 | 55 | 5 | 0.5 | -0.9 |
| 82 | Kurt Warner | 1999 | 2009 | 129 | 63 | 63 | 3 | 0.5 | -3.7 |
| 82 | Sam Bradford | 2010 | 2017 | 80 | 40 | 40 | 0 | 0.5 | 1.6 |
| 85 | Drew Bledsoe | 1993 | 2006 | 199 | 93 | 95 | 11 | 0.495 | -0.6 |
| 86 | Kordell Stewart | 1997 | 2003 | 86 | 41 | 42 | 3 | 0.494 | -1.7 |
| 87 | Steve Young | 1985 | 1999 | 157 | 76 | 78 | 3 | 0.494 | -6.6 |
| 88 | Jim Harbaugh | 1988 | 2000 | 145 | 69 | 71 | 5 | 0.493 | 0.8 |
| 89 | Kerry Collins | 1995 | 2011 | 187 | 90 | 93 | 4 | 0.492 | 0.9 |
| 90 | Ryan Fitzpatrick | 2005 | 2017 | 119 | 55 | 57 | 7 | 0.492 | 2.4 |
| 91 | Neil O'Donnell | 1991 | 2003 | 107 | 51 | 53 | 3 | 0.491 | -0.3 |
| 92 | Craig Morton** | 1978 | 1982 | 52 | 24 | 25 | 3 | 0.49 | -1.3 |
| 93 | Neil Lomax | 1981 | 1988 | 102 | 50 | 52 | 0 | 0.49 | 1.6 |
| 94 | Boomer Esiason | 1984 | 1997 | 178 | 85 | 89 | 4 | 0.489 | 0.3 |
| 95 | Jeff Hostetler | 1988 | 1997 | 88 | 41 | 43 | 4 | 0.489 | -2.1 |
| 96 | Steve Walsh | 1989 | 1996 | 41 | 20 | 21 | 0 | 0.488 | 1.6 |
| 97 | David Garrard | 2002 | 2010 | 78 | 38 | 40 | 0 | 0.487 | -0.4 |
| 97 | Mark Sanchez | 2009 | 2015 | 78 | 37 | 39 | 2 | 0.487 | -0.7 |
| 99 | Josh McCown | 2003 | 2017 | 73 | 35 | 37 | 1 | 0.486 | 4.1 |
| 100 | Tony Romo | 2006 | 2015 | 133 | 64 | 68 | 1 | 0.485 | -3.2 |
| 101 | Doug Williams | 1978 | 1989 | 88 | 41 | 44 | 3 | 0.483 | 0.3 |
| 102 | Dan Marino | 1983 | 1999 | 258 | 122 | 131 | 5 | 0.483 | -2.7 |
| 103 | Rex Grossman | 2003 | 2011 | 51 | 24 | 26 | 1 | 0.48 | -0.8 |
| 104 | Jack Trudeau | 1986 | 1994 | 50 | 24 | 26 | 0 | 0.48 | 4.4 |
| 105 | Warren Moon | 1984 | 2000 | 213 | 99 | 108 | 6 | 0.479 | -0.6 |
| 106 | Michael Vick | 2001 | 2015 | 118 | 56 | 61 | 1 | 0.479 | -1.4 |
| 107 | Bernie Kosar | 1985 | 1995 | 115 | 53 | 58 | 4 | 0.478 | -1 |
| 108 | Mark Rypien | 1988 | 1995 | 85 | 39 | 43 | 3 | 0.476 | -3.7 |
| 109 | Steve Grogan** | 1978 | 1990 | 102 | 48 | 53 | 1 | 0.475 | -1.4 |
| 110 | Steve Bartkowski** | 1978 | 1986 | 108 | 49 | 55 | 4 | 0.472 | -0.4 |
| 111 | Brian Sipe** | 1978 | 1983 | 85 | 39 | 44 | 2 | 0.471 | 0 |
| 112 | Colin Kaepernick | 2012 | 2016 | 64 | 28 | 32 | 4 | 0.469 | -1 |
| 113 | Jim Everett | 1986 | 1997 | 158 | 73 | 83 | 2 | 0.468 | 1.1 |
| 113 | David Carr | 2002 | 2007 | 79 | 36 | 41 | 2 | 0.468 | 5.9 |
| 115 | Ryan Tannehill | 2012 | 2016 | 77 | 35 | 40 | 2 | 0.468 | 0.8 |
| 116 | Dan Fouts** | 1978 | 1987 | 135 | 61 | 70 | 4 | 0.467 | -2.5 |
| 117 | Steve Fuller | 1979 | 1986 | 44 | 19 | 22 | 3 | 0.466 | 1.3 |
| 118 | Steve DeBerg | 1978 | 1998 | 144 | 64 | 74 | 6 | 0.465 | 2.2 |
| 119 | Matt Hasselbeck | 2001 | 2015 | 171 | 76 | 88 | 7 | 0.465 | -0.7 |
| 120 | Carson Palmer | 2004 | 2017 | 185 | 83 | 96 | 6 | 0.465 | -0.4 |
| 121 | Lynn Dickey** | 1979 | 1985 | 84 | 38 | 44 | 2 | 0.464 | 1.1 |
| 122 | Ken Stabler** | 1978 | 1983 | 83 | 36 | 42 | 5 | 0.464 | -1.9 |
| 123 | Richard Todd** | 1978 | 1984 | 95 | 44 | 51 | 0 | 0.463 | 0.1 |
| 124 | Aaron Brooks | 2000 | 2006 | 92 | 42 | 49 | 1 | 0.462 | 1.1 |
| 125 | Jason Campbell | 2006 | 2013 | 79 | 32 | 39 | 8 | 0.456 | 2 |
| 126 | Jameis Winston | 2015 | 2017 | 45 | 20 | 24 | 1 | 0.456 | 2.4 |
| 127 | Jim Hart** | 1978 | 1983 | 55 | 24 | 29 | 2 | 0.455 | 2.8 |
| 127 | Marcus Mariota | 2015 | 2017 | 44 | 19 | 23 | 2 | 0.455 | 0.8 |
| 129 | Nick Foles | 2012 | 2017 | 43 | 19 | 23 | 1 | 0.453 | -0.4 |
| 130 | Wade Wilson | 1983 | 1998 | 74 | 33 | 40 | 1 | 0.453 | -1.6 |
| 131 | Jon Kitna | 1997 | 2010 | 125 | 55 | 67 | 3 | 0.452 | 2 |
| 132 | Archie Manning** | 1978 | 1984 | 69 | 30 | 37 | 2 | 0.449 | 4.4 |
| 133 | Jake Plummer | 1997 | 2006 | 142 | 61 | 76 | 5 | 0.447 | 0.5 |
| 134 | Ken O'Brien | 1984 | 1993 | 112 | 49 | 61 | 2 | 0.446 | 0.8 |
| 135 | Matthew Stafford | 2009 | 2017 | 128 | 55 | 69 | 4 | 0.445 | 0.2 |
| 136 | Scott Mitchell | 1993 | 2000 | 73 | 32 | 40 | 1 | 0.445 | 0.1 |
| 137 | Steve Bono | 1987 | 1998 | 43 | 19 | 24 | 0 | 0.442 | -2.2 |
| 138 | Matt Schaub | 2004 | 2015 | 94 | 40 | 51 | 3 | 0.441 | -1.4 |
| 139 | Gus Frerotte | 1994 | 2008 | 95 | 41 | 53 | 1 | 0.437 | 0.5 |
| 140 | Kyle Boller | 2003 | 2011 | 47 | 20 | 26 | 1 | 0.436 | 0.5 |
| 141 | Marc Bulger | 2002 | 2009 | 98 | 42 | 55 | 1 | 0.434 | 1.3 |
| 142 | Jeff Garcia | 1999 | 2008 | 122 | 50 | 67 | 5 | 0.43 | -0.3 |
| 143 | Robert Griffin | 2012 | 2016 | 41 | 17 | 23 | 1 | 0.427 | 1.9 |
| 144 | Pat Haden** | 1978 | 1981 | 40 | 16 | 22 | 2 | 0.425 | -4 |
| 145 | Chad Henne | 2009 | 2014 | 53 | 22 | 30 | 1 | 0.425 | 4.5 |
| 146 | Daunte Culpepper | 2000 | 2009 | 104 | 44 | 60 | 0 | 0.423 | -0.1 |
| 147 | Dan Pastorini** | 1978 | 1981 | 46 | 18 | 26 | 2 | 0.413 | -0.9 |
| 148 | Blaine Gabbert | 2011 | 2017 | 45 | 18 | 26 | 1 | 0.411 | 6.2 |
| 149 | Jeff George | 1990 | 2001 | 127 | 51 | 74 | 2 | 0.409 | 2.2 |
| 150 | Billy Joe Tolliver | 1989 | 1999 | 47 | 18 | 27 | 2 | 0.404 | 3.7 |
| 151 | Bert Jones** | 1978 | 1982 | 41 | 16 | 24 | 1 | 0.402 | 2.4 |
| 152 | Jay Cutler | 2006 | 2017 | 155 | 59 | 90 | 6 | 0.4 | 0.4 |
| 153 | Rick Mirer | 1993 | 2003 | 68 | 26 | 40 | 2 | 0.397 | 3.1 |
| 154 | Tony Eason | 1983 | 1989 | 56 | 20 | 34 | 2 | 0.375 | -1.7 |
A couple other notes:
Jay Cutler was 31 games under .500 ATS as a starter, which is a record. The Broncos were particularly bad in games started by Cutler (10-26-1 ATS), and the Bears also went 2-8-1 with Cutler under center in 2013.
You can sort the table by any metric you like. You probably won’t be too surprised — but will still find it interesting — to see that Young and Gabbert played with the largest points spreads, on average, of any quarterback in the study.