by Chase Stuart
on August 5, 2015
You remember the November 20th game between the Bears and Lions in 1960, right? If you look at the boxscore on PFR, you will see that Detroit quarterback Jim Ninowski was 10 for 26 for 121 yards with 0 touchdown passes and 2 interceptions. You’ll also see that the Lions as a team went 10 for 26 for 121 yards with 0 touchdown passes, 2 interceptions, and 12 sacks for 107 yards. But the PFR boxscore does not indicate how many sacks Ninowski took that game, because the individual game log data wasn’t kept on that metric.
But, you know, I’m a pretty smart guy. I have a feeling that Ninowski was probably sacked 12 times in that game for 107 yards. I could be wrong, of course — maybe a backup came in and took two dropbacks, and was sacked on both of them — but it seems like making a good faith effort here is better than ignoring it completely. [continue reading…]
Tagged as:
George Blanda,
Joe Namath,
John Hadl
{ }
by Chase Stuart
on October 27, 2014

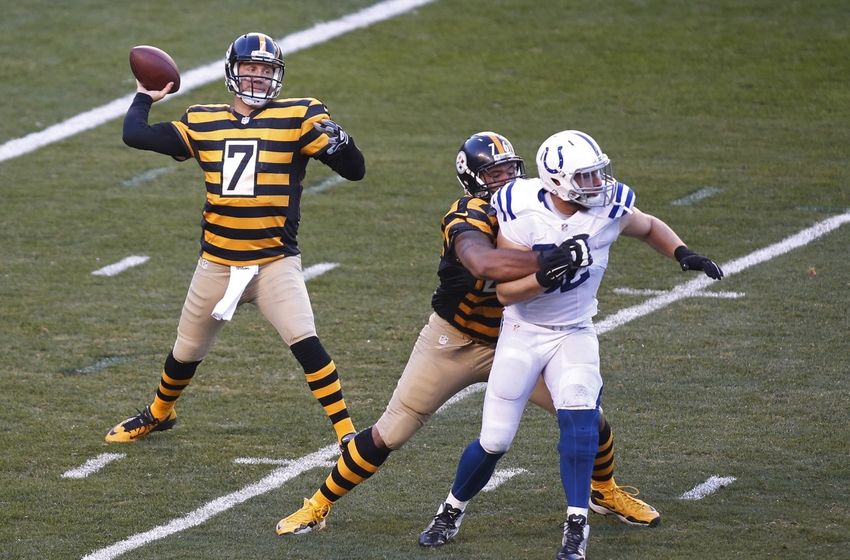
It was criminal how good Ben was on Sunday
Against Indianapolis in week 8, Ben Roethlisberger was close to perfect. He completed 40 of 49 passes for 522 yards. He threw six touchdowns, and didn’t throw an interception or take a sack. That’s a magnificent performance: in fact, among players with an 80% completion percentage in a game, he set a record for completions. It goes without saying that 500+ yard games are rare, and 6+ TD games are rare, and the combination of both are really rare.
But was it the best passing game ever? Not so fast. Let’s start by calculating his Adjusted Net Yards per Attempt, which gives a 20-yard bonus for touchdown passes, a 45-yard penalty for interceptions, and deducts sack yardage from the numerator (and adds sacks to the denominator). Roethlisberger averaged 13.10 ANY/A, a sparkling number. That’s an outstanding number that needs no qualifier, but it’s even more impressive when you consider the opponent. Entering the day, the Colts were allowing just 5.52 ANY/A to opposing passers.
Therefore, the Steelers star averaged 7.58 more ANY/A against the Colts than the average passer in 2014. Over the course of 49 dropbacks, this means Roethlisberger produced a whopping 372 Adjusted Net Yards above average, with average being defined as what all other passers did against Indianapolis.
That number may not mean much in the abstract. But if the Colts defense continues to allow just 5.52 ANY/A to all other passers year, that would give Roethlisberger the 7th best passing game since 1960. [continue reading…]
Tagged as:
Ben Roethlisberger,
Joe Namath
{ }
by Chase Stuart
on December 28, 2013

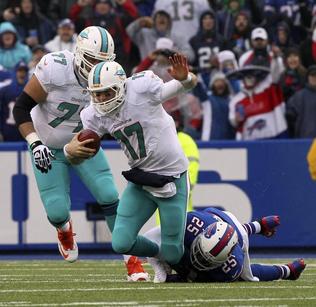
Buffalo just sacked Tannehill again.
Did you happen to notice the
stat line produced by
Ryan Tannehill last week? He completed just 10 of 27 passes for only 82 yards in a 19-0 loss to the Bills. A 37% completion rate and a 3.0 yards per attempt average are ugly numbers in their own right, but Tannehill was also sacked seven times for 46 yards. That means on 34 dropbacks, he produced…. 36 yards.
Tannehill did not throw an interception in the 19-0 shutout, so perhaps that’s why this game has gone under the radar. But a quarterback does not get to fare so poorly and avoid coverage of it at Football Perspective. Can you imagine if Tony Romo or Jay Cutler had a game like this? Why aren’t people talking about this? Tannehill averaged One Net Yard per Attempt over THIRTY FOUR DROPBACKS!?! Tannehill’s NY/A average dropped from 5.72 to 5.46, an unheard of drop this late in the season.
To be fair, Tannehill’s lack of interceptions does make the performance less horrible. But today, I want to just focus on yards produced on pass attempts (including sacks). Lots of good quarterbacks have had bad days when it comes to interceptions, but how often does a quarterback struggle so much on nearly every play for 34 plays?
Let’s provide some context. This season, the average pass play (including sacks) has produced 6.217 net yards, which means you would expect 34 dropbacks to produce 211.4 yards. That means Tannehill’s performance produced 175.4 net yards under average. Among quarterbacks with at least 15 pass attempts in a game, that’s the 25th worst performance since 1960, and the 7th worst performance since 2000.
The table below shows the worst 250 performances since 1960, although the only game I calculated for 2013 was Tannehill’s. The worst performance using this formula goes to Green Bay’s Lynn Dickey in 1981 against the Jets in week 16. He completed just 12 of 33 passes for 96 yards (I’ve included the TD and INT numbers even though they are not part of the calculation), and was sacked an incredible 9 times for 57 yards (Mark Gastineau, Joe Klecko, and Marty Lyons each had multiple sacks). So on 42 dropbacks, Dickey gained 39 yards, for an average of 0.9 NY/A. The NFL average that season was 6.02 NY/A, which means Dickey produced 214 Net Yards below average.
[continue reading…]
Tagged as:
Joe Namath,
Ryan Tannehill
{ }
by Chase Stuart
on March 17, 2013

Wait, how many USC quarterbacks are starting?
There was a streak in jeopardy in week 17 of the 2012 season. With former Trojan
Carson Palmer injured, the Raiders skipped over his
former USC teammate,
Matt Leinart, and started ex-Ohio State Buckeye
Terrelle Pryor at quarterback for the season finale. Since the Chiefs had previously benched
Matt Cassel for
Brady Quinn, if it wasn’t for
Greg McElroy missing the Jets last game against the Bills — which reinserted
Mark Sanchez into the starting lineup for New York — USC’s streak of consecutive weeks with a starting quarterback in the NFL would have ended. Instead, the streak is now up to 81 weeks with at least one of Sanchez, Palmer, Cassel and/or Leinart starting.
As impressive as that might sound, it’s not even halfway to the record. You can take a second to think about which school had the longest run with at least one of its former players starting at quarterback, but first, another bit of trivia: I noticed that in week 12 of the 2009 season, Matt Leinart, Matt Cassel, Mark Sanchez, and Carson Palmer all started. But believe it or not, that’s not a record, either.
In week 13 of the 2000 season, five quarterbacks from the University of Washington — Warren Moon, Mark Brunell, Damon Huard, Chris Chandler, and Brock Huard — were starting in the NFL. Add in Washington State’s Drew Bledsoe and Ryan Leaf, and seven quarterbacks that played college in the Evergreen State were starting in the NFL that weekend.
[continue reading…]
Tagged as:
Alabama,
Bart Starr,
Carson Palmer,
Joe Namath,
Ken Stabler,
Mark Sanchez,
Matt Barkley,
Matt Cassel,
Matt Leinart,
USC
{ }
by Chase Stuart
on August 16, 2012
A couple of years ago, my colleague Jason Lisk explained why Joe Namath is a legitimate Hall of Famer. With each passing year, it seems as though Namath’s career gets more misunderstood, particularly by those who look at his career stats without context. One of the main pieces of evidence that sounds damning: among Hall of Fame quarterbacks who began their careers after 1950, Namath ranks last in both touchdown/interception differential and passer rating:
But analyzing a player by his career numbers is too broad a brush for advanced analysis. Brandon Jacobs is 107 yards away from matching Gale Sayers’ career rushing total. Plaxico Burress and Jeremy Shockey have caught more passes than Lance Alworth and Kellen Winslow. At quarterback, comparing players across eras by their raw numbers is a pointless exercise. Byron Leftwich, Kyle Orton and Aaron Brooks have higher career passer ratings than Johnny Unitas. As always, we can only compare players by how they compared to their peers.
Namath’s career is misunderstood for several reasons. Younger fans think he’s famous because of The Guarantee, but he would have been an elite quarterback (and was acknowledged as one by his contemporaries) even if he never won a Super Bowl. He was among the best ever at avoiding sacks, an often overlooked but key element of effective quarterback play. He played in one of the worst eras for quarterbacks to compile strong passing stats, which is why his numbers don’t compare to modern quarterbacks. And his career arc was unusual, which further makes the use of career numbers an inappropriate way to understand Namath’s career.
There are 17 Hall of Fame quarterbacks to enter the league since 1950, and we can add Brett Favre, Peyton Manning and Tom Brady to get to an even twenty. Through age 26, Namath was outstanding, and was the second most productive quarterback of the twenty behind Dan Marino during those years. The table below shows how much value was added by each of the twenty quarterbacks through the age of 26:
[continue reading…]
Tagged as:
Jets,
Joe Namath
{ }