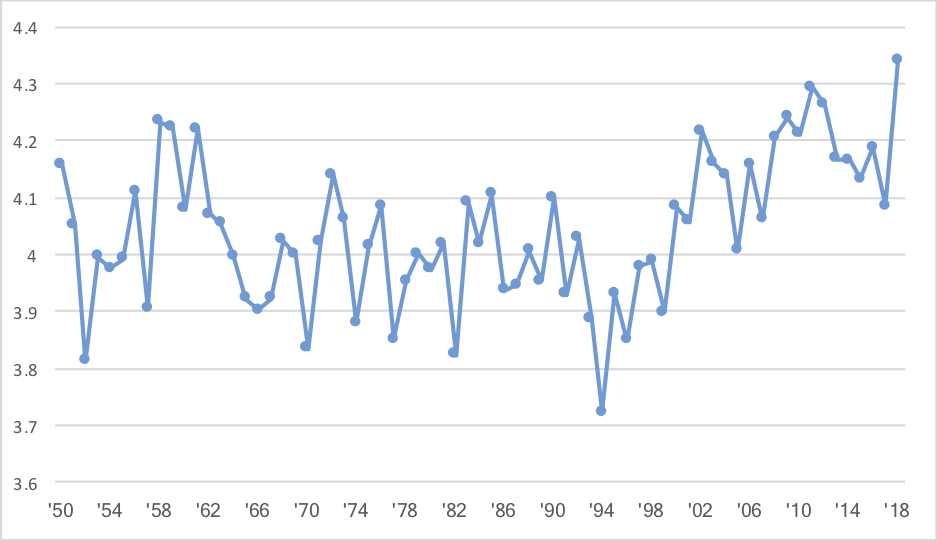
This season, the average carry in the NFL has gained 4.34 yards. That would set a new record, and it would also represent a large 0.25 YPC increase over last season’s average. The graph shows the YPC average in every NFL season since 1950:
But it’s not all about running backs. This year, only 82% of rushing yards have come from running backs, with quarterbacks being responsible for 14% of all rushing yards. Wide receivers are averaging 6.25 YPC, with Robert Woods and D.J. Moore being the most productive wide receivers on the ground so far.
At quarterback, this has been one of the most productive rushing seasons. The graph below shows the quarterback rushing data for weeks 1 through 8 of season from 2002 to 2018. The left Y-Axis shows rushing yards league-wide, while the right Y-Axis shows YPC:

But running back yards per carry is also up, just not at an all-time high. Below is the full-season YPC average by running backs in each season since 2002:

So rushing efficiency — as measured by YPC — is at an all-time high this year. It’s due to a really strong year by running backs, but also fantastic rushing numbers from quarterbacks and receivers. Back in 2007, running backs were responsible for 91% of all rushing yards; this year, that average is down to 82%.

