
So far this season, NFL teams are averaging about 6.4 net yards per pass attempt and 4.3 yards per carry. In addition, teams are passing on about 59% of all plays. I thought it might be interesting today to look at the distribution of the outcomes on rushing and passing plays.
For running plays, the analysis is pretty simple. About 12% of all rushing plays will lose yards, and another 9% of all rushing plays will gain zero yards. Said differently, close to 4 in every 5 rushing plays will gain positive yards. Note, of course, that quarterback scrambles are considered rushing plays for this analysis.
On the other hand, 42% of pass plays do not gain positive yards. So far in 2019, 6.9% of pass plays result in a sack and 33.1% of pass plays result in an incomplete pass, which means 60% of all pass plays (including sacks) result in a completed pass. In addition, about 2.7% of all pass plays result in a completion for either zero yards or negative yards. Add it all up, and on any given pass play in 2019, and there’s about a 3-in-7 chance that the passing team won’t be getting any yards.
I graphed the number of yards gained on all passing plays and all running plays in the picture below. The Y-Axis shows the number of yards gained, and the plays are simply distributed from worst to best (the X-Axis just represents the percentage of plays, going from 0 to 100). There is a minor inflection point early in the graph, because more running plays lose yards (~12%) than passing plays (~10%). So if you absolutely don’t want to lose yards, a passing play is probably the safer bet.
There is then a long flat line on passing plays, representing all the incomplete passes (together with the 0-yard completions). The main inflection point comes close to the 50% mark. This means that the median passing play barely gains more yards than the median rushing play.
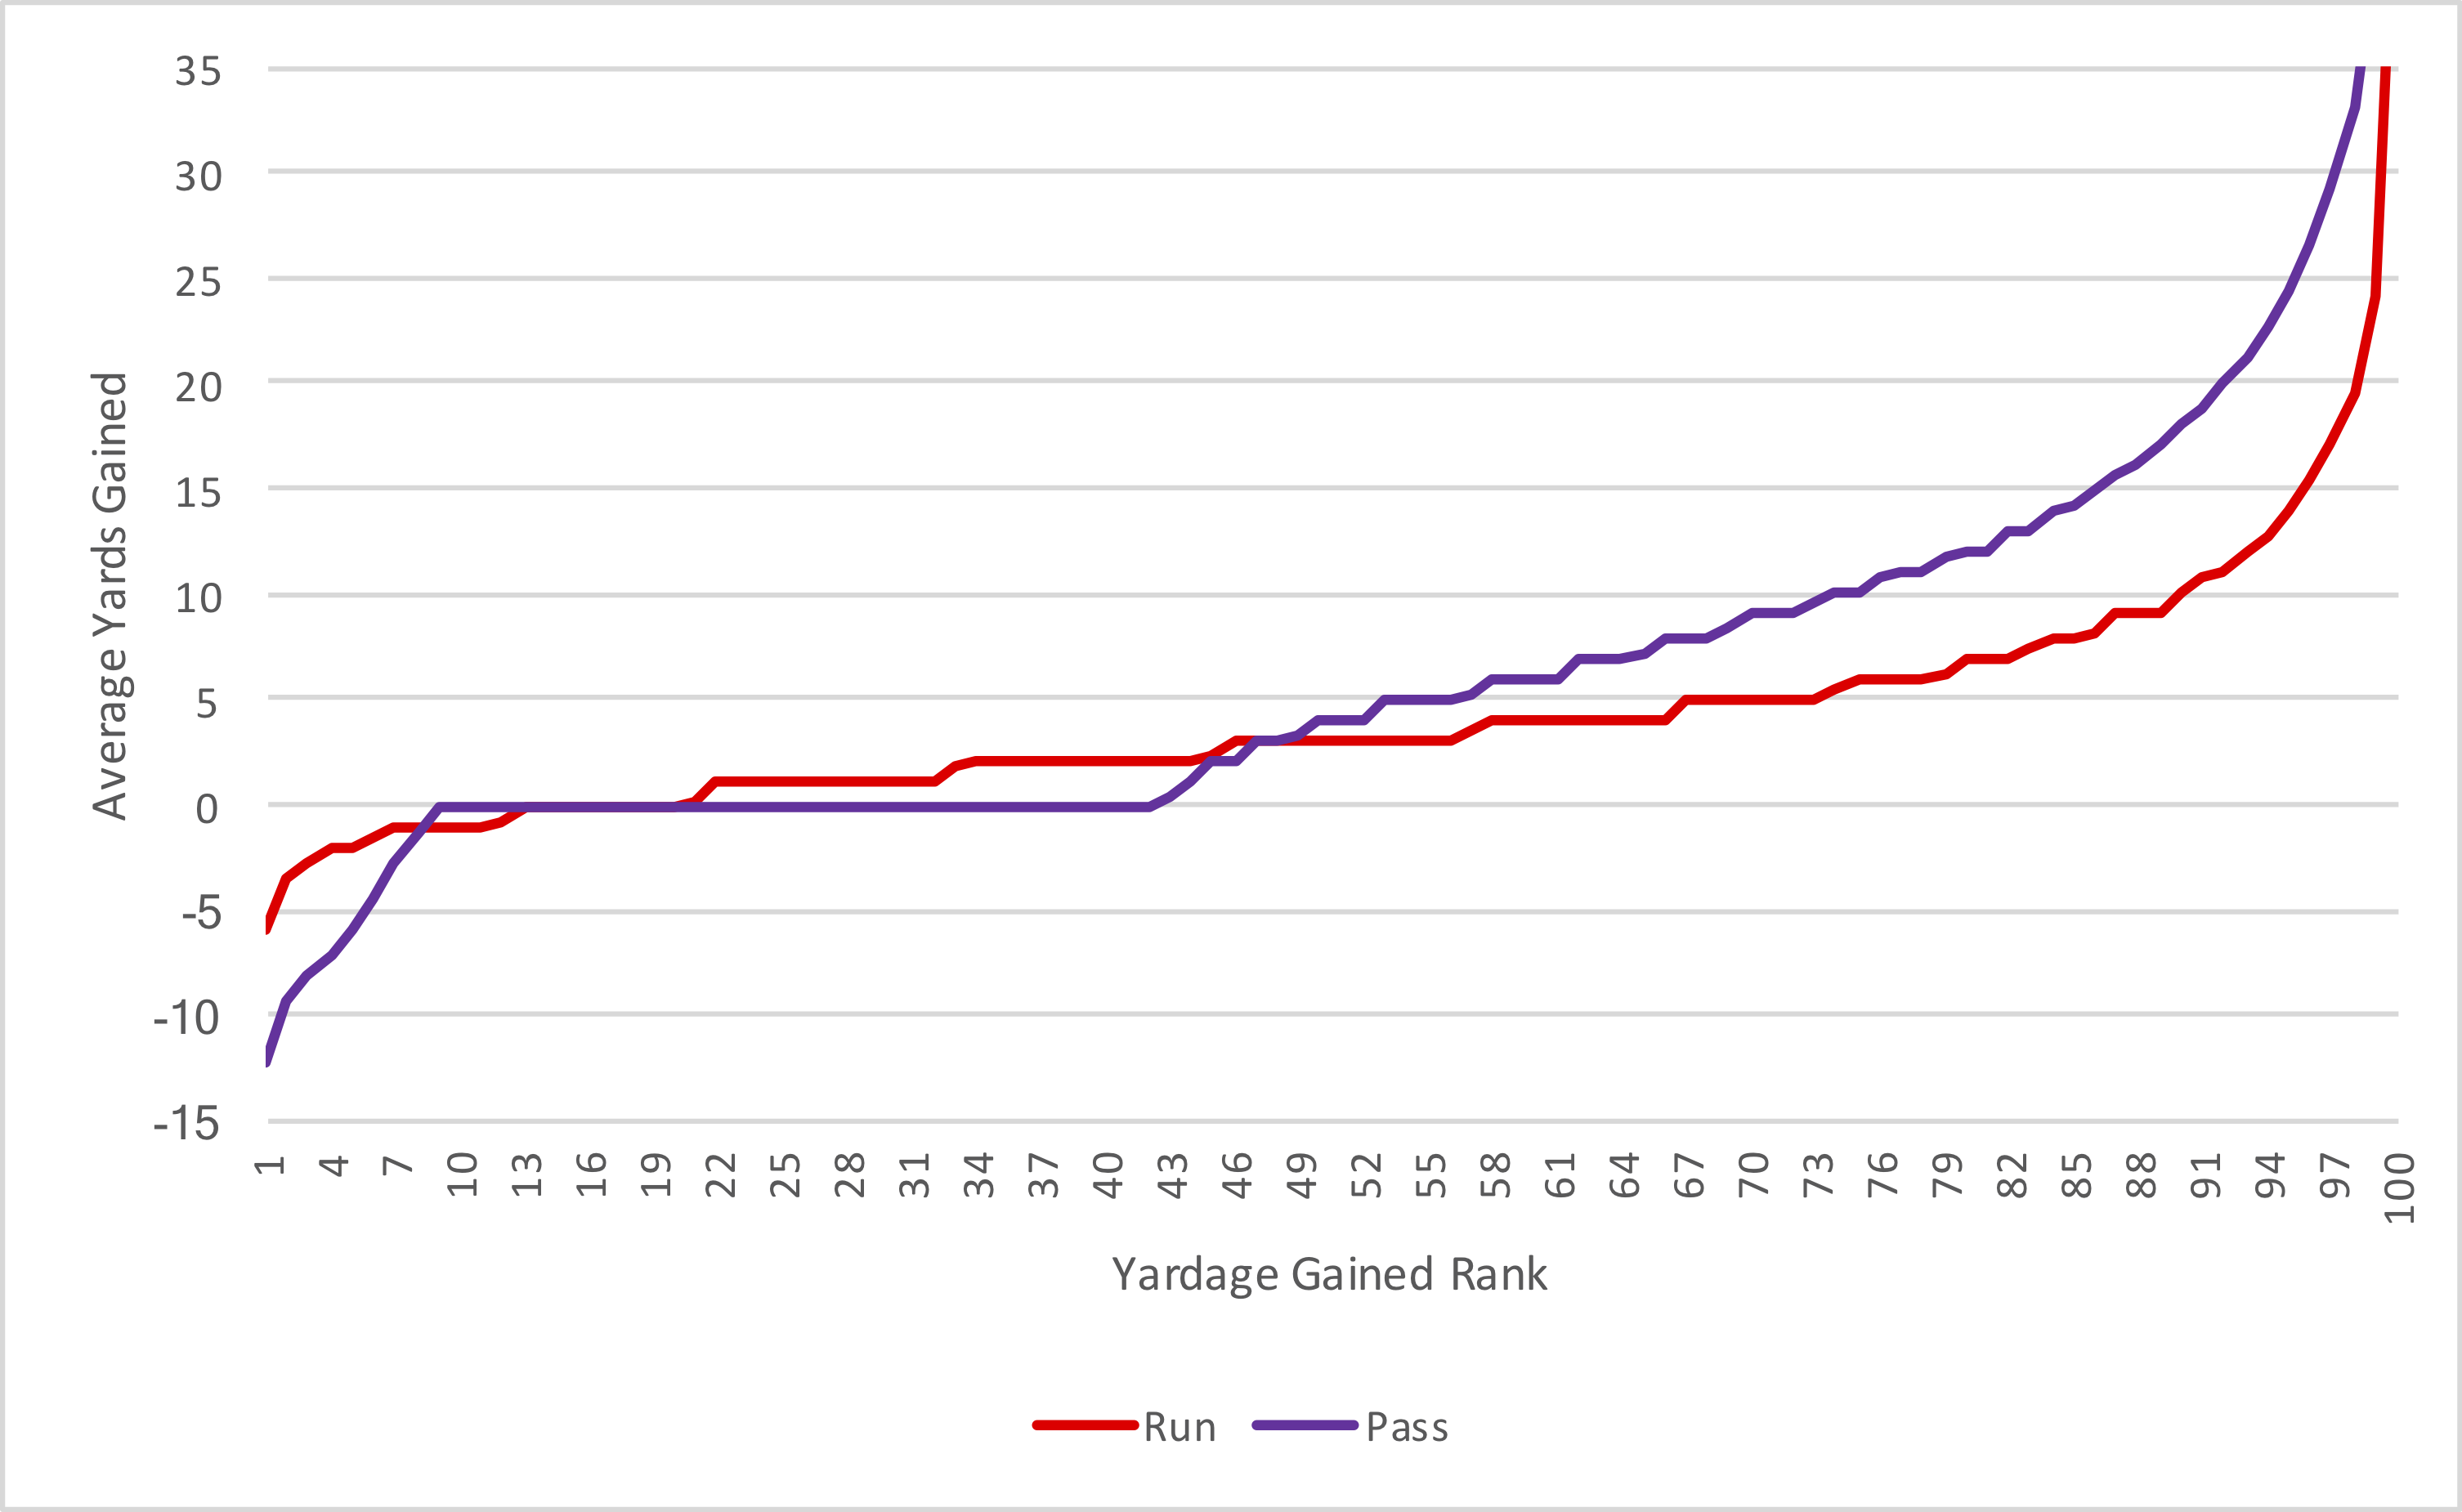
The reason that passing is better than running, of course, is because of the upside. But it’s still interesting to note how reliant on those top plays the passing game truly is to be the more efficient strategy. For example, if you removed the top 30% of all passing plays, the average gain would be about 1.3 yards. If you removed the top 30% of all rushing plays, the average gain would be about 1.5 yards.
Now, this analysis ignores many things, chief among them being interceptions. Let’s assign -45 yards for all interceptions, and re-run the graph. This will really only change the far left side of the graph: the main inflection point will still be at the ~48% mark:
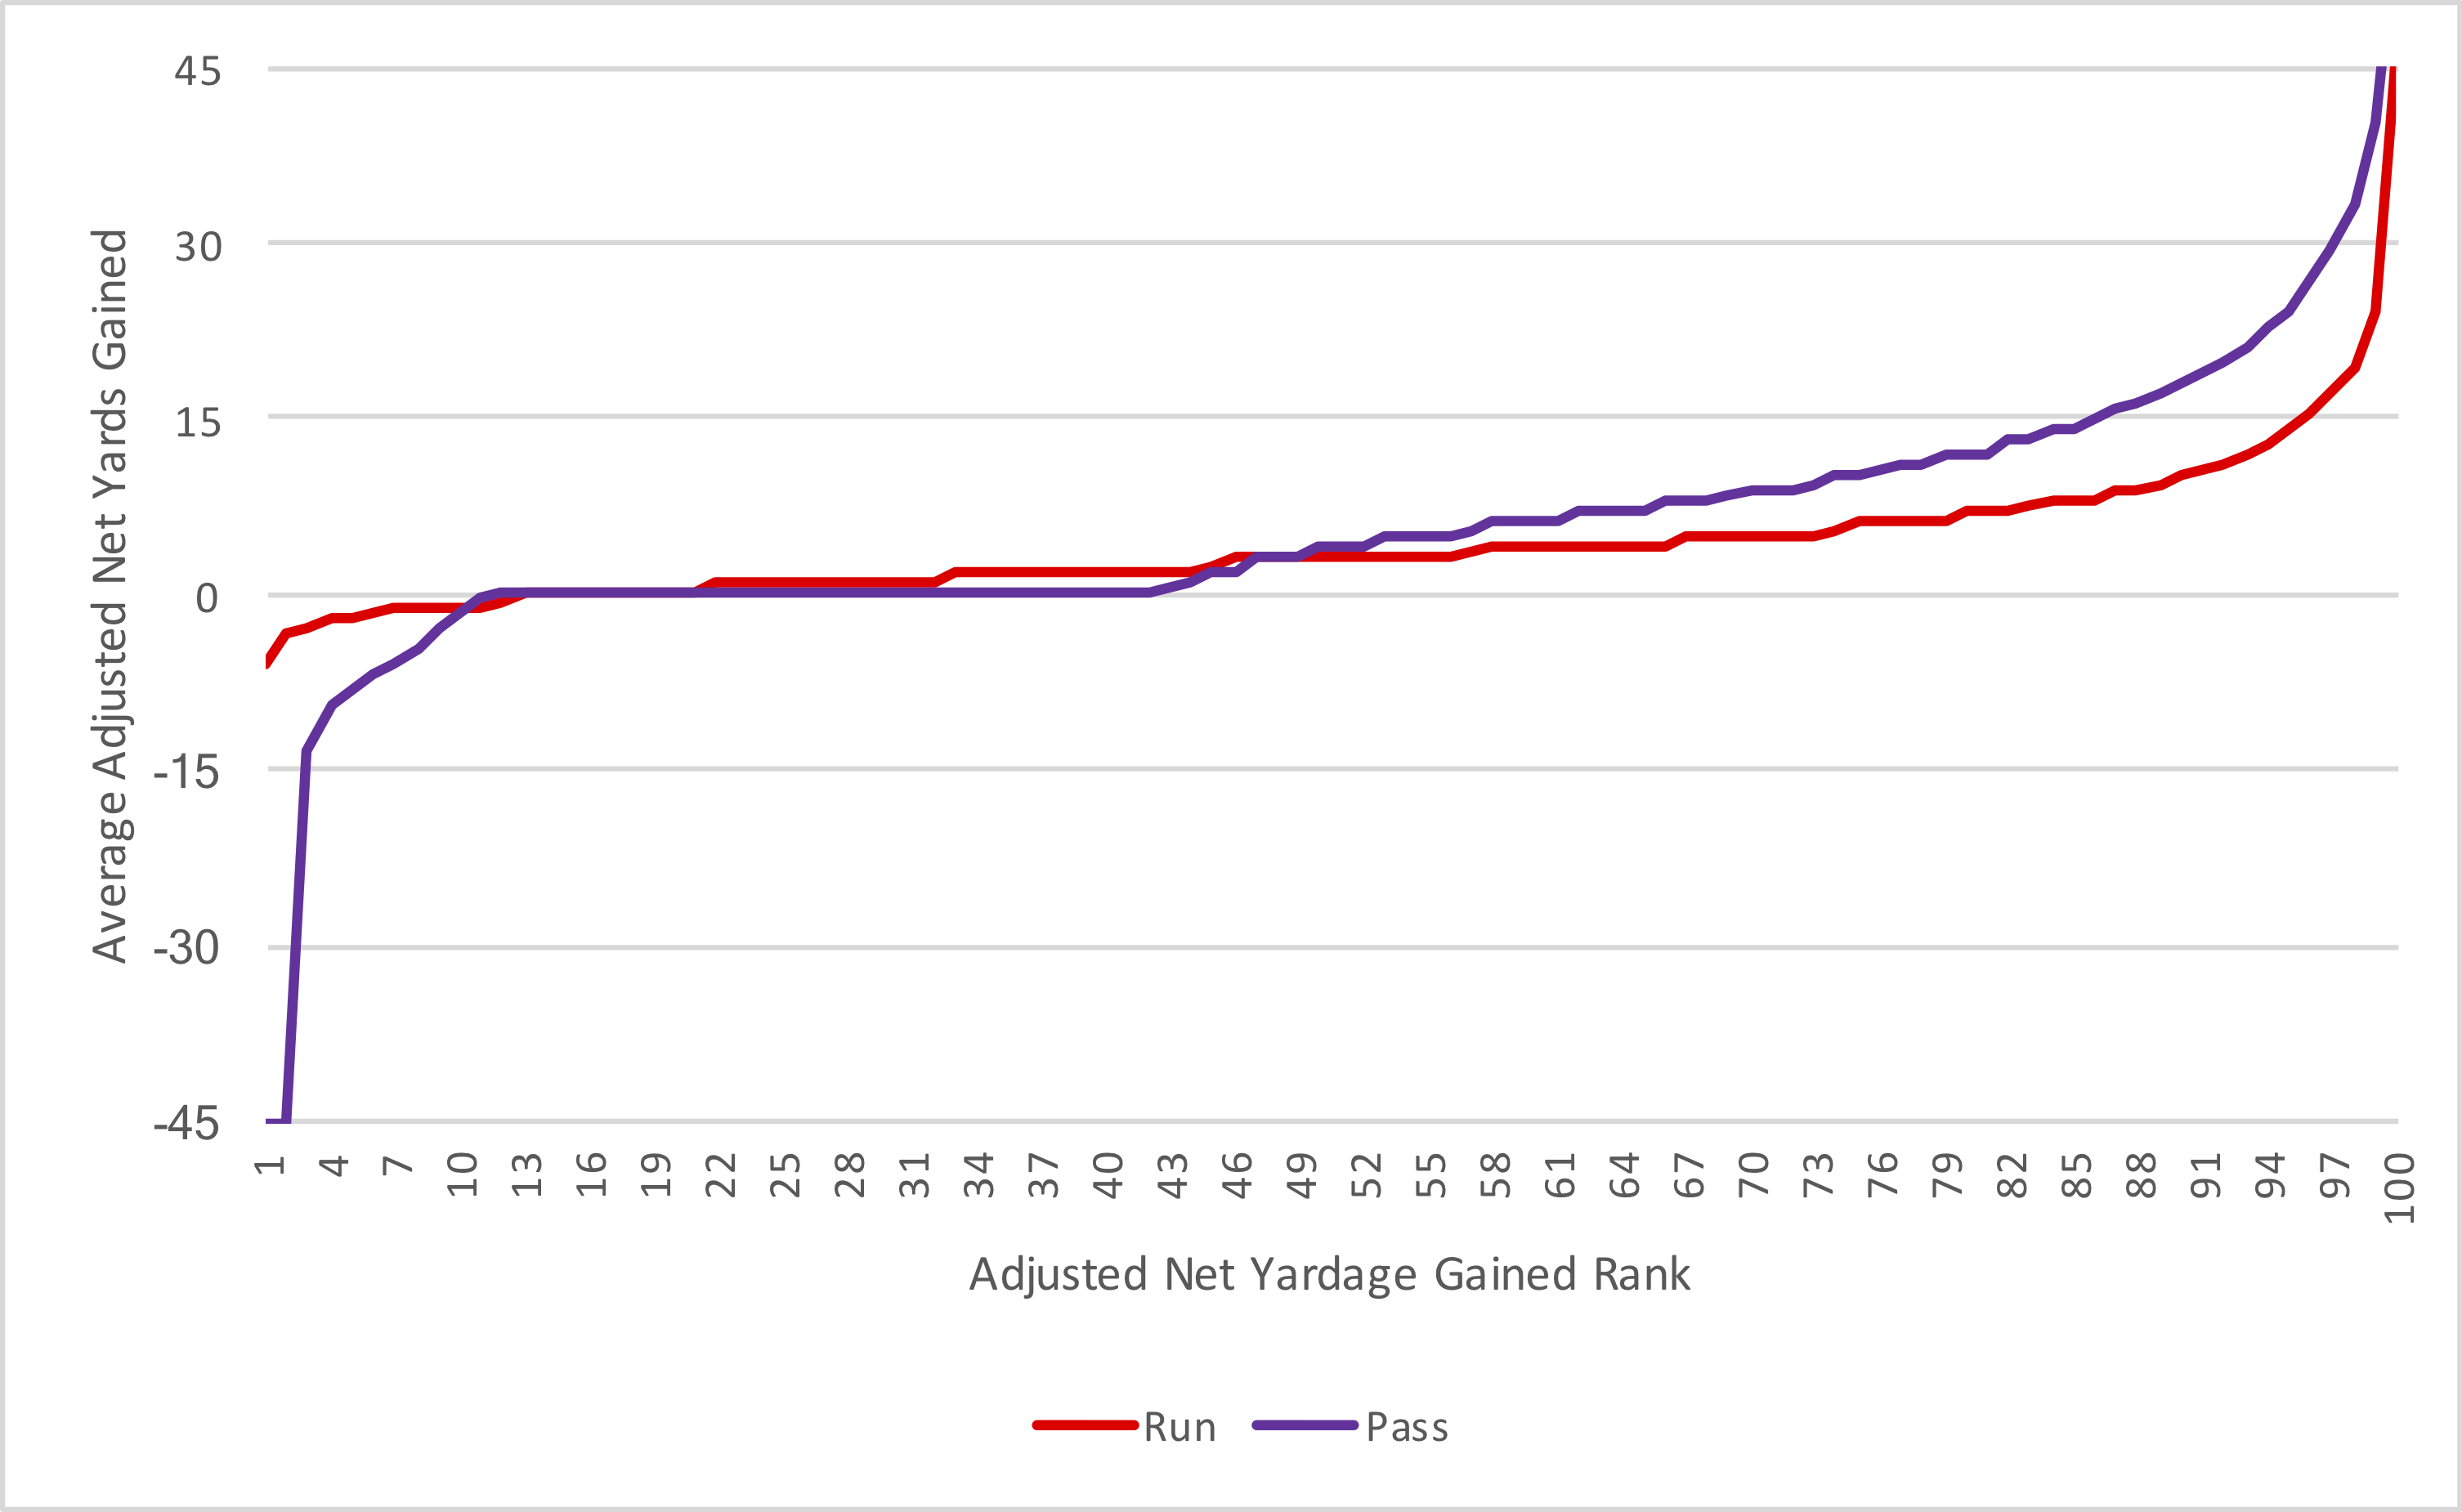
But this does tend to change the analysis when discussing the average gain. If you removed the best 11% of all passing plays, the average adjusted net yardage gain becomes just 2.7 yards. If you removed the best 11% of all rushing plays, the average gain is… also 2.7 yards. Once you include interceptions, it’s really just the 1 out of every 9 passing plays that are really good that make passing better than rushing.