≡ Menu

Last year, I wrote a post on the plays that had the biggest impact on the eventual Super Bowl champion. These were the plays that affected the Super Bowl win probability by the biggest amount among teams that did not win the title. At the time, the Buffalo Bills were on the short end of the most influential play in the Super Bowl era. When Frank Reich put the ball down for Scott Norwood, I estimated that the Bills had a 45% chance on winning the Super Bowl. [1]Recent research by Chase suggests something similar. After the kick went wide right, the Bills’ win probability fell to zero. The 45 percentage point fall was the biggest change for a non-champion of any play in the Super Bowl era. Over 48 years, a bunch of plays fell in that range, but no team could point to a single play as having lowered its championship chances by so large an amount.

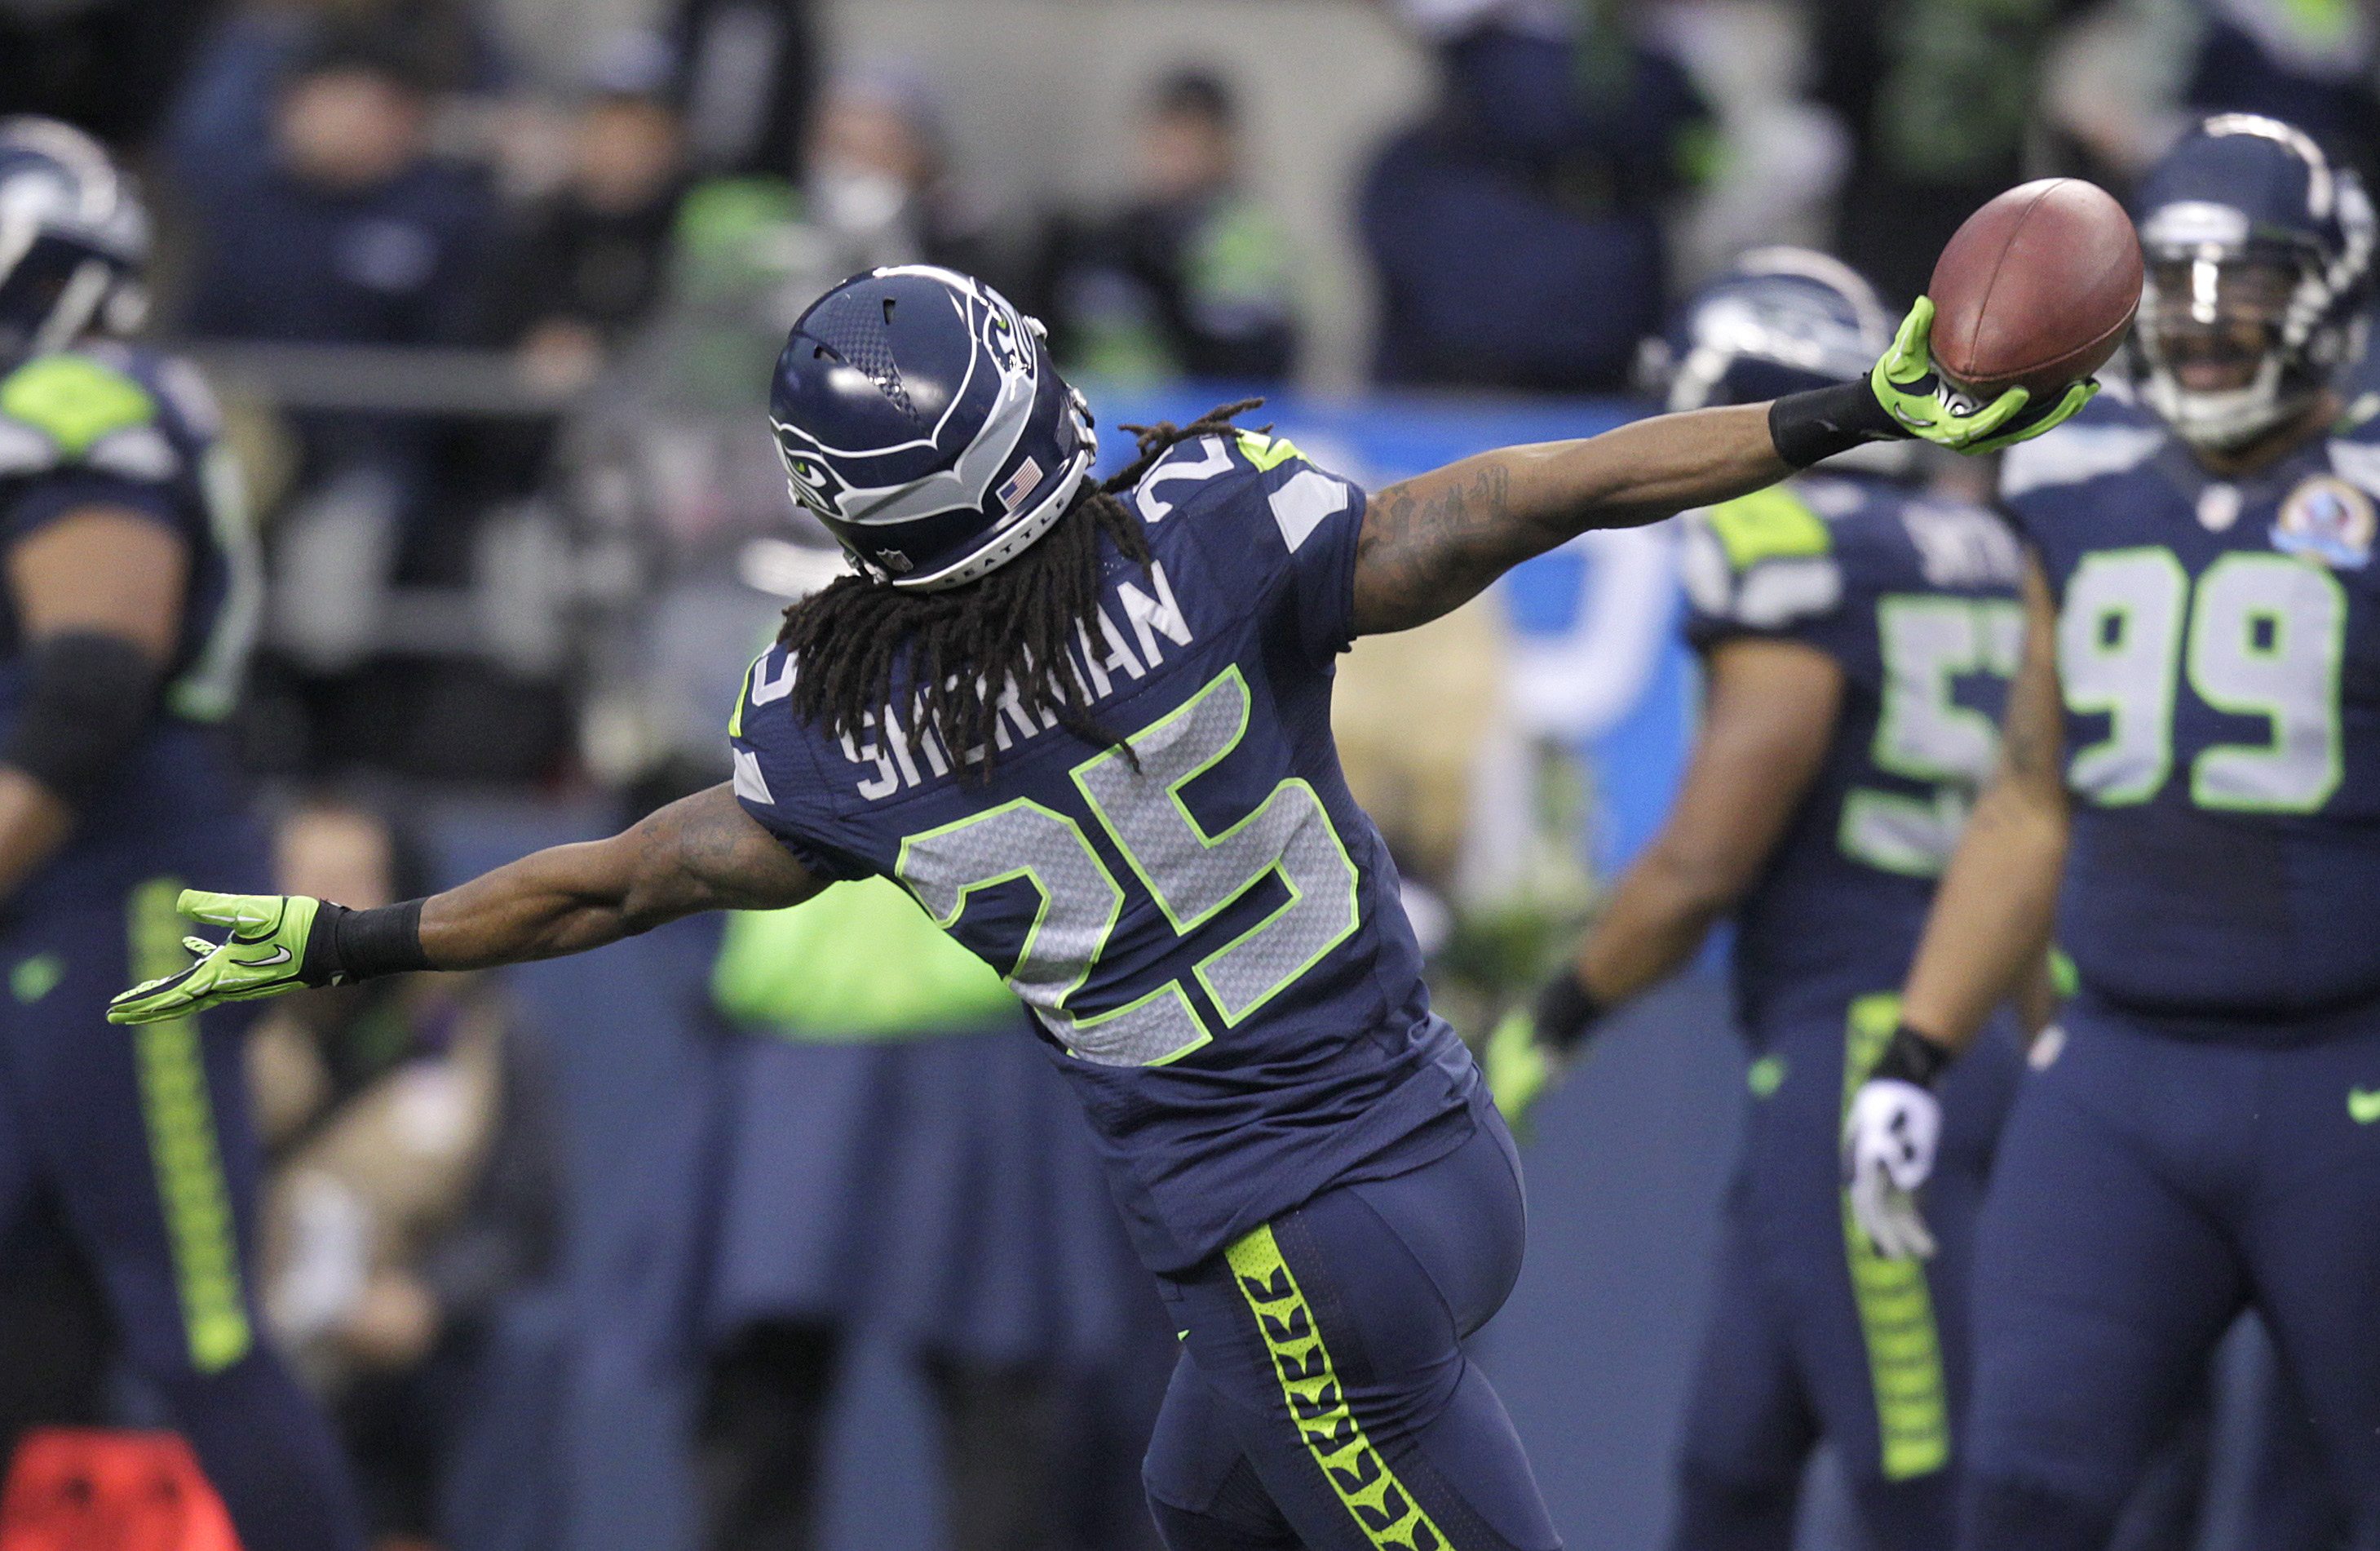
A couple weeks ago, that long-held record got broken kind of like Michael Johnson broke the 200-meter record in the Atlanta Olympics. Malcolm Butler’s pick obliterated the old mark. My estimate has the Butler interception as increasing the Patriots’ chances of winning by 0.87. There is no doubt that what some have called the Immaculate Interception is on an island by itself as the most influential play in NFL history.

To get that change in win probability from Butler’s play, I am going to assume that the Seahawks would have run on third and fourth down. I am going to give a run from the one a 60% chance of working. That might seem high, but the Patriots were the worst team in football in stuffing the run in important short-yardage situations either on third or fourth down, or down by the goal line. And their limited success mostly came against terrible running teams. It is not a huge sample, but against teams outside the worst quarter of rushing teams by DVOA, the Patriots had allowed opponents to convert 16 of 17 times with two yards or less to go for a first down or touchdown. If we add the playoffs, they actually had three more stops against good running teams (Baltimore and Seattle), albeit in games where the opponent had a good amount of success on the ground. [2]Note that the stop against Baltimore should not even count. In an otherwise great game for Gary Kubiak, he called for a reverse to Michael Campanaro on third-and-1 in the second quarter. The run was … Continue reading With Seattle being the best rushing team in football by a mile and the Patriots being at best not great in run defense in that situation, it seems hard to think that Seattle had anything less than a 0.60 chance of scoring on a run. [continue reading…]

References

References
1 Recent research by Chase suggests something similar.
2 Note that the stop against Baltimore should not even count. In an otherwise great game for Gary Kubiak, he called for a reverse to Michael Campanaro on third-and-1 in the second quarter. The run was stopped for a loss. The Patriots basically could not stop Justin Forsett, making the reverse call very unnecessary.
{ 31 comments }

Guest Post: Remembering Charles Follis

Bryan Frye is back with another fun guest post. Bryan, as you may recall, owns and operates his own great site at http://www.thegridfe.com/, where he focuses on NFL stats and history. You can view all of Bryan’s guest posts at Football Perspective at this link. You can follow him on twitter @LaverneusDingle.


Follis at Wooster High School

Follis at Wooster High School

Fans familiar with the history of the NFL know that Fritz Pollard and Bobby Marshall were the first black NFL players, playing in the league’s inaugural season of 1920. [1]For its first two seasons, the NFL was known as the American Professional Football Association, or APFA. It didn’t become the National Football League until 1922. However, often lost in history is the story of the first recorded black professional football player: Charles Follis.

Follis’ name rarely comes up because he played well before the inception of the NFL, before Americans had even heard of Jim Thorpe. When Follis first played professionally, Pollard was only ten years old, and Marshall was just a freshman at Minnesota. The year was 1904 – when Teddy Roosevelt was more interested in negotiating treaties between Japan and Russia than he was in saving football – and the twenty-five year old “Black Cyclone” inked a meager deal with the Shelby Blues of the Ohio League. However, Follis was more than a footnote in football history, and his story merits another telling.

Follis was born in Virginia in 1879, the oldest of seven children. His father was a farm laborer, which effectively meant Charles was, too. He worked long hours with his father, developing great strength at a young age. [2]This reminds me of the well-known story of Jerry Rice working countless hours with his bricklaying father, catching brick after brick after brick that his father tossed to him. It is unclear when the family left Virginia for Wooster, Ohio, but interviews suggest that it was when Follis was still a small child. [3]From Milt Roberts’ 1975 interview with Follis’ sister-in-law, Florence Follis.

As a junior in high school in 1899, he not only led the effort to establish Wooster High School’s first football team, but he was also subsequently elected team captain by his white teammates. He was the team’s star player as they went undefeated, not allowing a point all season. So great was his impact on Wooster High School that the school’s football stadium was named Follis Field in 1998. His prowess in both football and his best sport, baseball, were so easily recognizable that he was eagerly recruited by the local college. [continue reading…]

References

References
1 For its first two seasons, the NFL was known as the American Professional Football Association, or APFA. It didn’t become the National Football League until 1922.
2 This reminds me of the well-known story of Jerry Rice working countless hours with his bricklaying father, catching brick after brick after brick that his father tossed to him.
3 From Milt Roberts’ 1975 interview with Follis’ sister-in-law, Florence Follis.
{ 2 comments }

Beginning on Friday the 6th, Football Perspective hosted a “Wisdom of Crowds” election with respect to that age old question: Who is the Greatest Quarterback of All Time?™ Well, Football Perspective guest commenter Adam Steele offered to count the ballots and provide a summary. What follows are his words, and the results from the contest.


Two of the greatest  quarterbacks of all time

Two of the greatest quarterbacks of all time

First, I want to offer my sincere appreciation to all the readers who participated in this project, as it wouldn’t have been possible without your contributions. We generated over 300 comments and lots of great discussion. And, as you’re about to see, every vote really did matter.

After tallying 80 ballots, 2,000 votes, and 26,000 ranking points, the difference between first and second place was just eight points. That’s insane. Well, I won’t tease you any longer, so here are the results:

This chart is sortable by total points, points per ballot (using 80 as the denominator), GOAT votes, top 10 votes, and top 25 votes. In the interest of statistical significance, a player needed to appear on at least five ballots in order to be ranked in the table below. [continue reading…]

{ 159 comments }

Weekend Trivia: Overtime Touchdowns

In 2014, there were five overtime touchdowns: Two of them came from the Vikings: Teddy Bridgewater threw a short pass to Jarius Wright that went for 87 yards against the Jets, while Anthony Barr returned a fumble 27 yards for the winning score against the Bucs. Khiry Robinson also beat Tampa Bay in overtime with an 18-yard touchdown. The final two came from Seattle: Marshawn Lynch rushed for a 6-yarder against the Broncos, and Russell Wilson threw a 35-yarder to Jermaine Kearse to win the NFC Championship against the Packers.

There have been 9 quarterbacks to throw multiple overtime touchdowns, with Wilson being the latest one (he also did so as a rookie against the Bears). Terry Bradshaw is the only quarterback with exactly three such throws, but there is one quarterback to throw four touchdowns in overtime. Can you guess who?

Trivia hint 1 Show


Trivia hint 2 Show


Trivia hint 3 Show


Click 'Show' for the Answer Show

[continue reading…]

{ 2 comments }

There have been 35 quarterbacks in NFL history to throw for at least 30,000 yards. Given enough time, you could probably guess that Drew Bledsoe, Jim Kelly, and Steve McNair are three of them. All three have something else in common: they were all born on February 14th.

If we drop the cut-off to 16,000 yards, we jump to 130 quarterbacks but get to include David Garrard, another Valentine’s Day baby. But wait, there’s more: If we drop the threshold to 3,500 passing yards, we get to include Patrick Ramsey and Anthony Wright. Those guys may not impress you, but consider that only 322 players have thrown for 3,500 yards. That means dozens of days have zero quarterbacks with 3,500 yards, so slotting in Ramsey and Wright as QB5 and QB6 on your birthday dream team is pretty damn good.

By now, regular readers will have picked up on the fact that this post is a blatant ripoff of Doug’s original post back in 2008, which I updated two years ago. In terms of total career passing yards through the entire history of the league, today has an enormous lead on the second-best birthday, March 24, which consists entirely of Peyton Manning, Aaron Brooks, and Scott Brunner.  Put simply, passing yardage is for lovers, with maybe an exception or two for a certain linebacker or running back.

If you’re looking to give birth to an NFL quarterback, let me give you a word of comfort: one need not be so precise with their delivery dates. That’s because tomorrow, February 15th, is another outstanding day for quarterbacks, ranking in the top five for passing yards. It’s the birthday of Football Perspective love icon John Hadl, a (perhaps) one-day-Hall-of-Famer in Ken Anderson, and former Raider Marc Wilson. So my parenting advice to you is to circle May 14 and May 15 on your calendars, to give yourself a little wiggle room.

Oh, and happy 22nd birthday to one man who is most certainly not a lover of quarterbacks: Jadeveon Clowney.

{ 3 comments }

2014 Fumble Recovery Data

There are few statistics more random in all of sports than fumble recoveries. When a football is on the ground, it’s not the case that better teams are more likely to fall on the ball than bad teams: in the NFL, recovering fumbles is nearly all luck and little skill. This is a fact widely accepted by all statisticians, and I also ran a study which confirmed such intuition just last year.

The 49ers fumbled 18 times in 2014; San Francisco also forced 18 fumbles. When the 49ers fumbled, they managed to recover (or have the ball go harmlessly out of bounds) just six fumbles; when they forced a fumble, they… also only recovered just six times! So of the 36 times the ball hit the ground, San Francisco recovered 12 times, and lost it 24 times. [continue reading…]

{ 4 comments }

Brown was number one in 2014

Brown was number one in 2014

On Monday, I noted that Pittsburgh wide receiver Antonio Brown led the NFL in True Receiving Yards for the second straight season. He also, by the slimmest of margins, your leader in Adjusted Catch Yards per Attempt, too.

On October 1st, I looked at the leaders in Adjusted Catch Yards per Team Pass Attempt; at the time, Jordy Nelson had a big lead on the rest of the NFL, although Brown was in second place. You can read the fine details of the system in that post, but the short version is:

  • Begin with each player’s number of receiving yards. Add 9 yards for every first down gained, other than first downs that resulted in touchdowns, to which we add 20 yards. For Brown, this gives him 2,624 Adjusted Catch Yards (1,698 receiving yards, 87 first downs, 13 touchdowns).
  • Divide that number by the number of team pass attempts, including sacks, by that player’s offense. Pittsburgh recorded 645 dropbacks in 2014, which means Brown averaged 4.07 ACY/TmAtt. Jordy Nelson (1519/71/13) had 2,301 Adjusted Catch Yards and the Packers had 566 team pass attempts. That translates to .. 4.07 ACY/TmAtt, too. But go to three decimal places, and Brown (4.068 to 4.065) becomes your winner.
  • I have also included a column for Adjusted Catch Yards per Estimated Team Dropback; here, we use the same formula, but multiply the numerator by 16, and the denominator by the number of games played by the receiver. Let’s use Odell Beckham as an example. The Giants wide receiver finished with 1,959 ACY (1305/58/12) and New York had 637 dropbacks, giving Beckham 3.08 ACY/TmAtt. But if we adjust for the fact that Beckham missed four games, he gets credited with 4.10 ACY/EstTmAtt, which is the highest rate in the NFL.

The table below shows the top 50 receivers in ACY/TmAtt: [continue reading…]

{ 5 comments }

Additional Thoughts on Turnover Rates

On Sunday, I looked at turnover rates for every year in the NFL since the merger. Today, I want to re-examine turnover data but in a different light. In 2014, the average team committed 23.7 turnovers. As you might suspect, there’s a strong relationship between turnovers and winning percentage, with a correlation coefficient of -0.56. This says nothing about causation, of course, and the causal arrow does in fact run in both directions (committed fewer turnovers leads to more wins, and winning in games leads to fewer turnovers).

Here’s another way to think about the relationship between winning percentage and turnovers. The Patriots were responsible for 4.7% of all wins this year and committed 13 turnovers; as a result, when calculating a weighted league average turnover total, I made New England’s 13 turnovers worth 4.7% of that total. Meanwhile, the Buccaneers and their 33 turnovers were only worth 0.8% of the weighted league average turnover total, since Tampa Bay was responsible for just 0.8% of all wins.

Using this methodology, the weighted league average turnover total in the NFL was 22.5 per team, or 95% of the unweighted league average. I used that same methodology to calculate the percentage of “weighted league average turnover total” to “unweighted league average turnover total” for each year since 1960. In the graph below, the blue line represents the NFL ratio, while the red line represents the AFL ratio. [continue reading…]

{ 6 comments }

In 2013, eight teams hired new head coaches.  Three teams tapped rising offensive coordinators – Mike McCoy, Bruce Arians, [1]Who, of course, was also coming off an award-winning season as interim head coach of the Colts. Rob Chudzinski – while four other hires were head coaches with offensive backgrounds (Andy Reid, Doug Marrone, Chip Kelly, and Marc Trestman).  That means just one head coaching hire came from a defensive background: Gus Bradley in Jacksonville.

Given the current era where the rules are slanted towards the offense, one can understand how teams might be inclined to look towards offensive coaches when selecting a head coach. Consider that scoring is about 60% of the game, which could make owners and general managers break ties in favor of offensive candidates. Then, remember that the pool of teams looking for a new head coach: teams that struggled the prior year. And since offense is so important, that usually means a team that had a bad offense. It’s a bit of an oversimplification, but it’s easy to imagine the average team looking for a head coach as one that just went 5-11 with a bad offense and is looking to turn things around with a new, sexy offensive hire.

There was something else you may recall from 2013: the lack of minority hires. At the end of the 2012 season, there were 15 job openings for general managers and head coaches; none went to a minority candidate. The hiring process for GMs is much more opaque than it is for head coaches, but there was one main explanation given for the fact that all 8 head coaching hires were white: black coaches are disproportionately defensive coaches, and the league was shifting towards offense when it came to coaching hires because of the reasons stated above. [continue reading…]

References

References
1 Who, of course, was also coming off an award-winning season as interim head coach of the Colts.
{ 4 comments }
Brown was number one in 2014

Brown was number one in 2014

You may recall that in 2013, Antonio Brown led the NFL in True Receiving Yards, which felt controversial at the time. Remember, Calvin Johnson and Josh Gordon were the runaway choices by the Associated Press as the top receivers in the NFL; in addition, A.J. Green also received more votes, and Demaryius Thomas finished with as many votes as Brown.

Well, Brown has done it again, but I doubt it will surprise many people this time around. Brown led the NFL in receptions and receiving yards, and received 49 of 50 first-team All-Pro votes. Regular readers are familiar with the concept of True Receiving Yards, but let’s walk through the system using Brown and Dez Bryant, who jumps from 8th in receiving yards to 4th in True Receiving Yards. [continue reading…]

{ 4 comments }

The Patriots won Super Bowl XLIX, and whatever your thoughts on the end of the game, there’s no doubt that New England was one of the top teams in the NFL in 2014. But it’s not quite so easy to identify why, at least when looking at the traditional per-play metrics. New England ranked 17th in Net Yards per Pass Attempt and 16th in Net Yards per Pass Attempt allowed, hardly the stuff of Super Bowl champions. The Patriots didn’t stand out as particularly excellent as a rushing offense or a rushing defense, either.

But those passing statistics belie the fact that the Patriots did, in fact, have a great offense this year. Part of the issue was the slow start and a meaningless week 17 game. Beginning in week 5, and excluding the week 17 game, New England scored 487 points, a 34.8 points per game average. That matches what the team did in 2012, when the Patriots had a historically lethal offense. And it’s not too far off from even the heights reached by the ’07 team.

The Patriots passing attack ranked 5th in TD rate, 3rd in INT rate, and 4th in sack rate; as a result, they jump from 17th to 6th when moving from NY/A to ANY/A. But the Patriots were even better at pure scoring. [1]While New England moves at a fast pace, they actually ranked 3rd in points per drive and 4th in overall points, because the Broncos had even more drives than New England. That’s been a trend for the team: during the Tom Brady era, New England has fared better in points scored than it has in ANY/A, and fared better in ANY/A than the team has in NY/A. And New England has generally been improving in all three statistics, too.

There is one area where the 2014 Patriots stand out as special. New England had just 13 turnovers all season: 9 Brady interceptions, three Brady fumbles, and one Brandon LaFell fumble. That is tied for the third best ever, although that sounds better than it is. The record for turnovers per game is 10 turnovers per 16 games, a feat accomplished by the 2010 Patriots and then the 2011 49ers. In 2014, the Packers also committed just 13 turnovers, and the Seahawks had just 14. As you might suspect, yes, this does mean that turnover rates have declined significantly in recent history. Take a look at the following graph, which depicts turnovers per 16 games for the average NFL team since 1970.  The purple line shows all turnovers; the blue and red lines are for interceptions and fumbles lost, respectively. [continue reading…]

References

References
1 While New England moves at a fast pace, they actually ranked 3rd in points per drive and 4th in overall points, because the Broncos had even more drives than New England.
{ 9 comments }

How many Super Bowls should the Patriots have won?

Since 2001, New England had made the playoffs twelve times, reaching the Super Bowl, incredibly, in half of those seasons. The Patriots have won the Super bowl four times over this fourteen-year span, which made me wonder: how many Super Bowls *should* the Patriots have won?

This could be measured in a few ways. We could look at say, the team’s pre-season odds of winning it all each year. I don’t have that historical data, but we can be sure that New England significantly overachieved by that measure. We could also look at the team’s Super Bowl chances at the start of each post-season. For example, at the end of the regular season, Bovada had the Patriots at 3/1 to win the Super Bowl. That would imply a 25% chance of winning it all, although after adjusting for the vigorish, the Patriots’ true odds would have been 21.8%. I don’t have historical data of this sort, although I am sure one could use a combination of SRS and home-field advantage to come up with something similar. Hey, if you have ideas, present them in the comments.

Instead, I used the same methodology I used a couple of weeks ago to determine the randomness of each post-season. Remember, a point spread can be converted into an expected winning percentage using the following formula in Excel (if you put the point spread in cell L2): [continue reading…]

{ 8 comments }

[Update: You can view the results from our 80 ballots here.]

Regular guest contributor Adam Steele has offered to administer a Wisdom of Crowds edition of the GQBOAT debate. And we thank him for that.


Who is the Greatest Quarterback of All Time? This is a fun question to debate because there is no absolute right answer. In recent years, the practice of crowdsourcing has gained momentum in the analytics community, in some cases yielding more accurate results than mathematical models or expert opinions. For the uninitiated, here’s the gist: Every human being represents a data point of unique information, as all of us have a different array of knowledge and perspective about the world. Therefore, when you aggregate the observations of a group of people, they will collectively possess a greater and more diverse reservoir of knowledge than any single member of the group.

The readers of Football Perspective are an insightful bunch with areas of expertise spanning the entire football spectrum; we are the perfect group for crowdsourcing an age old football question. If you’d like to participate in this experiment, there are just a few guidelines to follow:

1. Create a list of the top 25 quarterbacks of all time, in order, using any criteria you believe to be important. I encourage readers to be bold in your selections – don’t worry about what others may think.

2. Commentary is not necessary, but most definitely welcome. In particular, I’d enjoy seeing a short blurb explaining the criteria you based your selections on.

3. Please compile your rankings BEFORE reading anyone else’s. Crowdsourcing works best when each source is as independent as possible.

4. Please DO NOT use multiple screen names to vote more than once.

I’ll give readers a week or so to cast their ballots, then analyze the results in a follow-up article. A first place vote is worth 25 points, second place 24 points, and so on. Let the process begin!

{ 344 comments }

Super Bowl XLIX, and Thoughts on ANY/A

Let’s get something out of the way.

In the final minute of the game, the Seahawks had an 88% of winning Super Bowl XLIX. To make grandiose statements about the Patriots passing attack and football analytics based on New England winning the Super Bowl would be silly given the way the game ended.

Okay, whew.  But I do want to talk about the Patriots offense, and more specifically, ANY/A.  As regular readers know, Adjusted Net Yards per Attempt is calculated as follows:

(Gross Passing Yards + 20*PassTDs – 45*INTs -SkYdsLost) / (Pass Attempts + Sacks)

ANY/A correlates very well with winning, and it’s my favorite basic metric of passing play.  But ANY/A, based around yards per attempt, is not perfect.  And I think SB XLIX provides a good example of that.  Tom Brady finished the day with 320 net passing yards, 4 TDs, and 2 INTs on 51 dropbacks, which translates to an ANY/A of 6.08.  Russell Wilson had 234 net passing yards, 2 TDs, and 1 very fateful INT on his 24 dropbacks; that translates to an ANY/A of 9.54. [continue reading…]

{ 36 comments }

This week at the New York Times, a look at the most heartbreaking losses in Super Bowl history.

The Seattle Seahawks were a yard from history. Trailing by 4 points in the final minute of Sunday’s Super Bowl, Seattle had the ball, on second down, at the Patriots’ 1-yard line. According to the website Advanced Football Analytics, that gave the Seahawks an 88 percent chance of winning the Super Bowl.

With a win, Seattle would have become just the ninth team in the Super Bowl era to repeat as champion, and the first since the 2003-4 Patriots. The defense, which had allowed the fewest points in the N.F.L. in each of the last three seasons, would have strengthened its argument to be considered the greatest in football history.

But it was not to be. Brandon Browner jammed Jermaine Kearse at the line, and Malcolm Butler shot in front of Ricardo Lockette to make a game-changing interception. For Patriots fans, it was a play to remember forever. For Seahawks fans, it was one they wish they could forget.

But where does Super Bowl XLIX rank among the most painful Super Bowl losses in history?

You can read the full article here.

{ 17 comments }

Yes, Malcolm Butler sealed the win for the Patriots in Super Bowl XLIX.  But if not for a great play by Brandon Browner, Butler never would have had a chance to be the hero.

With less than a minute remaining in the Super Bowl on Sunday, the Seattle Seahawks lined up in a three-wide-receiver set at the 1-yard line. To the right of quarterback Russell Wilson, Ricardo Lockette stood nearly directly behind another wide receiver, Jermaine Kearse, a yard back and on Kearse’s outside shoulder — an alignment commonly used on pick plays.

New England Patriots cornerback Brandon Browner stood across the line of scrimmage from Kearse, a couple of yards in front of Malcolm Butler, who was tasked with guarding Lockette.

For Seattle, the concept was simple. Kearse would run what is known as a clear-out route: With Browner and Butler aligned so close together (in response to the way the Seahawks’ receivers were set), Kearse’s job was to make Browner backpedal. That would block Butler from cutting across the field to cover Lockette, who was to run a slant to the inside.

You can read the full article here.

{ 4 comments }

Open Thread: Post Your Super Bowl XLIX Reactions Here

I’m sure many of you have reactions to the crazy Patriots/Seahawks Super Bowl. Fire away!

{ 77 comments }

Super Bowl XLIX New England/Seattle Preview

Will Brady be mad after today's game?

Will Brady be mad after today’s game?

I’ve done Super Bowl previews the last two years, but I decided not to go with the full-fledged Super Bowl preview this year. One reason: Bill Barnwell’s outstanding preview is so excellent and exhaustive that well, I didn’t have much else to say.

But I do have some high-level thoughts. Regular readers know that I’m a guy who spends a lot of time thinking about rating teams and players and trying to make adjustments to make high-level comparisons across eras. But that doesn’t mean I don’t believe that in any one game, matchups can matter more than pure talent. Last year, I thought the Seahawks were a bad matchup for the Broncos, and I tweeted as much before the 2013 conference championship games. I still believe that if the 49ers had scored on that final drive against the Seahawks, then Peyton Manning would have another Super Bowl in his trophy case.

But the matchups this year are kind of weird, a fact that Barnwell detailed well in his preview. When Darrelle Revis was with the Jets, fans often bemoaned that he was a “waste” against a Patriots team that threw to Wes Welker in the slot and to Rob Gronkowski and Aaron Hernandez. The Jets may have had a star cornerback, but the Patriots didn’t have a star outside wide receiver, and the Jets best player was essentially neutralized when playing New England.

Here, something similar will happen, but for both teams. Revis will be manned up on Doug Baldwin and well, okay. So instead of four catches, Baldwin will have… two? The hunch is that Richard Sherman will see a lot of Brandon LaFell, which means the Seahawks best cornerback will be isolated on the Patriots third-best receiver (behind Gronkowski and Julian Edelman). [continue reading…]

{ 0 comments }
Bettis ran for only five yards on this play

Bettis ran for only five yards on this play

Congrats to the newest members of the Pro Football Hall of Fame. You can read my thoughts on the candidates here; while this class is not exactly the one I would have picked, Jerome Bettis, Tim Brown, Charles Haley, Junior Seau, Will Shields, and Mick Tingelhoff were all outstanding players. In addition, Bill Polian and Ron Wolf were the inaugural selections for the Contributors spots, so congratulations to them as well.

The Bettis candidacy is an interesting one. Many want to focus on his underwhelming 3.9 career yards per carry average. But as I have written many times, I am not keen on putting much weight on YPC as a statistic. Brian Burke has also written about how coaches don’t view running backs in terms of yards per carry, but rather by success rate (which correlates poorly with yards per carry). Danny Tuccitto calls yards per carry essentially “a bunkum stat.” [continue reading…]

{ 17 comments }

Super Bowl Champions and First Round Contributors

The only skill position player in Super Bowl XLIX drafted in the first round

The only skill position player in Super Bowl XLIX drafted in the first round

On offense, the Patriots have one player on the entire roster who was selected in the first round: tackle Nate Solder.  On defense, starters Chandler Jones, Dont’a Hightower, Devin McCourty, and Vince Wilfork were chosen by New England in the first round. And let’s not forget Darrelle Revis, a first round pick of the Jets; those are five of the best players on New England’s defense right now.  The Patriots defense also features Jerod Mayo and Dominique Easley, two former first round picks now on injured reserve.

But most of New England’s key contributors were not first round picks. Tom Brady, of course, was a 6th round pick. Rob Gronkowski was a 2nd, Julian Edelman was a 7th, Brandon Lafell was a 3rd, Rob Ninkovich was a 5th, and so on. Every year, Pro-Football-Reference generates an Approximate Value rating for each player in the NFL. This year, former first round picks of the Patriots generated just 23% of the team’s Approximate Value. [continue reading…]

{ 2 comments }

2015 Hall of Fame Candidates

Tomorrow, the newest members of the Pro Football Hall of Fame will be announced.  There are three first-year candidates that are finalists: Junior Seau, Kurt Warner, and Orlando Pace. This year, the Seniors’ Committee was only allowed to select one candidate, and that was Mick Tingelhoff; the former Vikings center will receive a simple up or down vote, and will not take a space from any of the 15 modern-era candidates (of which a maximum of five will be selected).

In addition, the Hall will open its doors to a special class of Contributors, who, like the Seniors’ choices, will receive a yes or no vote where 80% is required for induction. The choices this year are Bill Polian and Ron Wolf.   So we could have as many as eight members in the Class of 2015, and there’s a very good chance that we’ll have exactly that many.  While the Seniors’ Committee selection is not guaranteed induction, Tingelhoff is a strong candidate and I doubt he would have been chosen if they didn’t think he would be selected; ditto Polian and Wolf, and my guess is the “Contributor” choices will have a pretty easy time gaining entry most years.  Let’s take a look at all 18 candidates, courtesy of Pro-Football-Reference: [continue reading…]

{ 19 comments }

The Patriots SRS rating has been inflated in the postseason

The Patriots true SRS rating is deflated if you only use regular season data.

It has always seemed a little strange to me that we think about the regular season and the playoffs separately when evaluating a team’s season. At least, that’s usually what happens in terms of the numbers. We think about a team’s regular season record and we think about where they were eliminated in the playoffs. A team’s Simple Rating System (SRS) rating is based just on their regular season performance. [1]Note that Football Outsiders’ DVOA does update for the playoffs. When we evaluate a team or a matchup, it might make more sense to think about their whole body of work including the playoffs when calculating ratings.

In the table below, I have calculated the SRS of Super Bowl teams according to Pro Football Reference’s (PFR) method that considers just the regular season. [2]It looks like I get the same numbers as PFR in a bunch of cases, but I have not checked all of them. In any event, it looks like my program works. I have also added adjusted ratings that include the playoff games leading up to the Super Bowl. These set of adjusted ratings help to identify the Super Bowls that were the closest and best matchups based on teams’ performances over the entire season including the playoffs. [continue reading…]

References

References
1 Note that Football Outsiders’ DVOA does update for the playoffs.
2 It looks like I get the same numbers as PFR in a bunch of cases, but I have not checked all of them. In any event, it looks like my program works.
{ 10 comments }

Are NFL Playoff Outcomes Getting Less Random?

In September 2012, Neil Paine wrote a great article at this website titled: Are NFL Playoff Outcomes Getting More Random? In it, Neil found that randomness had increased significantly in the NFL playoffs, with “recently” defined as the period from 2005 to 2011.

In fact, while 2005 was a pretty random postseason, 2006 was one of the more predictable playoff years.  But the five-year period from 2007 to 2011 was a really random set of years. Consider that:

  • In 2007, the Giants won three games as touchdown underdogs, including the Super Bowl as a 12.5-point underdog.  The Chargers also won a playoff game against the Colts as an 11-point dog.
  • In 2008, five of the eleven playoff games were won by underdogs! That list was highlighted by the Cardinals winning in Carolina as a 10-point underdog in the divisional round.
  • The following year, five of the eleven playoff games were upsets, including the Jets winning as 9-point underdogs in San Diego.
  • In 2010, for the third straight year, there were five playoff upsets, including two huge ones: the Jets as 9.5 point dogs in Foxboro, and the Seahawks as 10-point home dogs against the Saints.
  • Noticing a trend? Well, in 2011, five of the playoff games were again won by the underdog. The two big upsets here were the Tim Tebow-led Broncos against the Steelers, and the Giants winning in Lambeau Field against the 15-1 Packers.

[continue reading…]

{ 10 comments }

This week at the New York Times, a look at the Patriots trick formations, and how New England has creatively worked around the NFL’s rules on eligible pass receivers.

In the divisional round of the N.F.L. playoffs, the New England Patriots dived deep into their playbook for a series of trick plays. What the Patriots did surprised even rule book aficionados, to say nothing of the team’s opponent, the Baltimore Ravens. It was also entirely legal, and the result of Coach Bill Belichick’s limitless ingenuity and deep understanding of the N.F.L. rules.

The N.F.L. publishes a rule book each year titled the “Official Playing Rules of the National Football League.” Rule 7, Section 5 of the 2013 edition covers eligibility. It is that section that contains one of the most basic elements of N.F.L. play, a rule so commonly adhered to that it goes unnoticed by most observers: There must be at least seven players on the line of scrimmage at the snap of each play.

Of those seven players, only the two outside players are eligible to catch a pass on a play; the inside five players on the line of scrimmage are, by definition, ineligible. But not only are the two outside players the only ones on the line of scrimmage eligible to catch a pass, those players must be eligible receivers.

You can read the full article here.

{ 0 comments }
There's a flag on Brandon Browner

There’s a flag on Brandon Browner

In 2013, Brandon Browner started eight games for the Seattle Seahawks. And while ended the year on the NFL’s suspended list, he still received a ring when Seattle went on to win Super Bowl XLVIII.

Now with the Patriots, Browner could pull off the rare trick of winning back-to-back Super Bowls with different teams. This has been done only four times before in NFL history:

  • Defensive back Derrick Martin played in five games for the Packers in 2010 and 14 for the Giants in 2011. Sure, Martin totalled just 1 interception and 14 tackles during those two years, but it counts!
  • Guard Russ Hochstein was drafted by Tampa Bay in 2001 and played in one game in 2002; he was waived in October and signed by the Patriots a week later. He stayed in New England through 2008, so Hochstein picked up a Super Bowl ring for his cup of coffee with the Bucs and then earned two more the next two seasons in New England. Hochstein was also a freshman with Nebraska in 1997, when the Cornhuskers were named national champions by USA Today and ESPN.
  • The two more famous members of the club pulled off this trick in 1994, as members of the San Francisco 49ers, and in a surrounding year with Dallas Cowboys. One was Deion Sanders, who left Atlanta for San Francisco in 1994, and then San Francisco for Dallas in ’95. The other was Ken Norton, Jr., who spent the first six years of his career with Dallas, and won the Super Bowl in 1992 and 1993. Norton then joined the 49ers in ’94, where he spent the final seven seasons of his career.  Hochstein and Norton are the only two players to win Super Bowls in three consecutive seasons.

Norton has been the Seahawks linebackers coach since 2010, so he’s looking to pick up his fourth career ring on Sunday.

{ 2 comments }

Rams/Raiders was the Least-Conforming Game of 2014

50/50 chance these guys show up

50/50 chance these guys show up

They’re baaack! In November 2013, the St. Louis Rams blew out the visiting Indianapolis Colts in what was the least-conforming game of the 2013 season.

In November 2014, the Rams blew out the visiting Oakland Raiders in what was the least-conforming game of 2014 (although for my money, the runner-up game between the Titans and Chiefs was probably still the strangest result of the year). The Rams finished the season with a -0.8 SRS rating, eight points better than the 2014 Raiders SRS rating of -8.8. Given that the game was in St. Louis, we would have expected the Rams to win by around 11 points.

In reality, the Rams shut out the Raiders, 52-0. That gave St. Louis a single-game SRS score of 40.2, meaning the Rams were 40.2 points better than average that day. [1]Technically, this bit of information is superfluous for the main point of this post, but I always err on the side of including interesting data. Since St. Louis won by 52 when the Rams were expected to win by 11, they exceeded expectations by a whopping 41 points.

That 41-point total — the amount by which St. Louis exceeded expectations — was the highest of any game in 2014. The table below lists all relevant information from every regular season game this year, with the “diff” column showing the difference between the expected and actual margins of victory. I have also included a link to the boxscore of each game embedded in the “Wk” cell. Note that the table, by default, lists only the top 10 games, but you can view more using either the dropdown box, the search bar, or the previous/next buttons at the bottom of the table. [continue reading…]

References

References
1 Technically, this bit of information is superfluous for the main point of this post, but I always err on the side of including interesting data.
{ 1 comment }

super-bowl-squares-xlixFor the last two years, I’ve written about Super Bowl squares. Well, it’s that time of year again, so here’s your helpful cheat sheet to win at your Super Bowl party.

Every Super Bowl squares pool is different, but this post is really aimed at readers who play in pools where you can trade or pick squares (surely no pool has a prohibition on this!) I looked at every regular season and postseason game from 2002 to 2013. [1]Yes, this means your author was too lazy to update things for the 2014 season, because frankly, the extra work isn’t worth it. The table below shows the likelihood of each score after each quarter, along with three final columns that show the expected value of a $100 prize pool under three different payout systems. The “10/” column shows the payout in a pool where 10% of the prize money is given out after each of the first three quarters and 70% after the end of the game; the next column is for pools that give out 12.5% of the pool after the first and third quarters, 25% at halftime, and 50% for the score at the end of the game. The final column is for pools that give out 25% of the pot after each quarter — since I think that is the most common pool structure, I’ve sorted the table by that column, but you can sort by any column you like. To make the table fully sortable, I had to remove the percentage symbols, but “19, 6.7, 4.1, 2” should be read as 19.0%, 6.7%, 4.1%, and 2.0%. [continue reading…]

References

References
1 Yes, this means your author was too lazy to update things for the 2014 season, because frankly, the extra work isn’t worth it.
{ 0 comments }
Madden cover curses don't scare Sherman

Madden cover curses don’t scare Sherman

The Seahawks had three players named to the Associated Press’ first-team All-Pro roster: inside linebacker Bobby Wagner, safety Earl Thomas, and cornerback Richard Sherman. The Patriots had two such players: tight end Rob Gronkowski and cornerback Darrelle Revis.

It is no surprise that Revis and Sherman were named first-team All-Pros. This is the fourth such time Revis has been so honored, while it’s the third straight year for Sherman. Once deflategate goes away, [1]Just kidding, that will never happen. I expect the media to realize that hey, the teams with the top two cornerbacks in the NFL are in the Super Bowl! That might be a story worth covering! [2]Of course, with Thomas in Seattle, one could extend the story beyond just the cornerback position to the defensive back grouping. In addition, both Patriots safety Devin McCourty and Seattle’s … Continue reading [continue reading…]

References

References
1 Just kidding, that will never happen.
2 Of course, with Thomas in Seattle, one could extend the story beyond just the cornerback position to the defensive back grouping. In addition, both Patriots safety Devin McCourty and Seattle’s other safety, Kam Chancellor, received first-team All-Pro votes, with Chancellor actually being just two votes shy of making the first team, and the leading vote-getter on the second team.
{ 2 comments }

Quite the clickbait title, I know. But given where this post is going, I thought precision was more important than anything else.

Over the last three seasons, Seattle has allowed 15.2 points per game. That’s really, really good. How good?

pa2012

There are flaws with using points allowed as a measure of defensive play, of course. Seattle is known for its long drives on offense, which limits the number of possessions an opponent might have. And the Seahawks offense generally puts the team’s defense in pretty good situations. Using points allowed per drive might be preferable, or using DVOA, or EPA per drive, or a host of other metrics. And adjusting these results for strength of schedule (or, at least, removing non-offensive scores) would make sense, too.

But hey, it’s Friday, and I wanted to keep things relatively simple. [1]In about ten minutes, we can all have a good laugh at this line. Points allowed is a number we can all understand. Given our era of inflating offenses, it’s quite possible that Seattle’s 15.2 points per game average doesn’t stand out as particularly impressive to you. After all, the ’76 Steelers once allowed 28 points over a nine-game stretch! But consider that since 2012, the NFL average has been 22.6 points per game, which means the Seahawks have allowed 7.4 fewer points per game than the average defense.

How good is that? [continue reading…]

References

References
1 In about ten minutes, we can all have a good laugh at this line.
{ 11 comments }

The physicist Werner Heisenberg (this guy, not this guy) found that observers affect the systems they attempt to measure, something that is related to but actually separate from his Uncertainty Principle. Even if Heisenberg was thinking about submicroscopic particles whizzing around, his ideas can still apply to writing about NFL betting. Writing about my bets could change the sequence of events that follow, at least in theory, just like all the other actions people take everywhere that put the world on a different course. The NFL season that just unfolded was just one of an infinite number of potential seasons that could have happened. In what share of the possible seasons did my pick for the NFL’s worst team start the season 9-1? Am I just the worst predictor ever, someone dumb enough to underestimate the great Arians and the new great HC of the NYJ? Or was I tempting fate by writing about real bets?

Since I am supposed to be a coldly-rational, data-driven guy, I am going to chance it and review my NFL betting this year. This is risky since my betting year could still be saved by events yet to be determined. Before I get to all that, I am hoping that maybe my writing about football can influence something much more plausible, namely whether I attend the Super Bowl next week. Apologies for this distraction, but I could really use some help.

***HUMBLE REQUEST BEGIN***

If you have read any of my stuff here or on Football Outsiders, you may know that I am a Patriots fan. Sufficiently dedicated to have flown from Los Angeles to Boston for the Ravens game, then back to LA for the first week at Loyola Marymount, before flying back to Boston for the Colts game. Now I am hoping to obtain two tickets to the Super Bowl. Here is what I can offer: [continue reading…]

{ 16 comments }