≡ Menu

On paper, the Buccaneers added a lot of big names in the offseason. Tom Brady and Rob Gronkowski from the Patriots, a former top-5 pick at running back in Leonard Fournette, and an All-Pro wide receiver in Antonio Brown. Tampa Bay also hit home runs with its first two draft picks, offensive tackle Tristan Wirfs and cornerback Antoine Winfield Jr..

But the Buccaneers did not have a particularly large amount of turnover compared to recent Super Bowl champions. In fact, by one measure, each of the five previous Super Bowl champions had bigger turnover than Tampa Bay. Other than Brady, most of the big names didn’t have a big impact for Tampa Bay, at least until the Super Bowl. Leonard Fournette had just 367 rushing yards during the regular season; Brown had just 483 receiving yards in 8 games; Gronk averaged 39 yards per game, the lowest mark in his career other than during his rookie season (in ’19, O.J. Howard averaged 33 yards per game for Tampa Bay). Of course, in Super Bowl LV it was a different story: our lasting image of the 2020 Bucs will be Gronkowski scoring 2 touchdowns, Brown catching a touchdown, and Fournette picking up 135 total yards and a touchdown.

How do we compare one team to its squad from the prior year? Great question! It’s tricky: we want to compare not just roster turnover, but the value of those players. The Chiefs added both Brady and LeSean McCoy, but that should not count as equal moves. Similarly, you have to look at how the player was used in the prior season. For example, Kurt Warner was on both the ’98 Rams and the ’99 Rams, but it would be poor analysis to say that the ’99 Rams had the same quarterback as they did the prior year.

Really we want to look at two things: how much was the player a part of the Super Bowl team (to avoid overemphasizing the McCoys of the world) and for players on the team, how much was that player a part of the team the prior year (to avoid the Warner problem). To measure how valuable a player was, I am going to use PFR’s AV, which does as good a job as any other metric to compare the value of players across positions and eras. For each player on each Super Bowl team, I will measure how much AV they produced as a percentage of the team’s total AV. I will also do that the year before, and then take the lower of those two values.

Let’s use a few examples. The 2020 Buccaneers had 243 points of AV, and Brady had 15 of them; therefore, he was responsible for about 6% of the team’s value. He was not on the team in 2019, of course, so Brady gets a 0 when we calculate how much of the 2019 Bucs were on the 2020 Bucs. That’s a big deal, because there is only 94% of the AV left to allocate. McCoy had just 1 point of AV, or 0.4% of the team’s AV; he also gets a zero since he wasn’t on Tampa Bay in 2019, but that has a much smaller impact. Donovan Smith had about 4% of the AV on the 2019 Bucs and 4% of the AV on the 2020 Bucs; therefore, taking the minimum doesn’t change things; he gets assigned 4%.

If we do this for every player on the 2020 roster, and take the minimum value between the percentage of AV they had for the ’20 Bucs and the percentage of AV they had for the ’19 Bucs, and then sum the results, we get a value of 60%. This may not mean a ton to you in the abstract — it wouldn’t be quite right to say that 40% of the roster turned over — but it is very helpful if we are comparing teams. [continue reading…]

{ 0 comments }

Leading Rusher For Each Super Bowl Team

The 2014 Patriots were not very reliant on the ground team. Jonas Gray led the team in rushing yards with just 412 in 8 games, while Shane Vereen was second with 391 over the full season. Stevan Ridley had 340 in 6 games, while LeGarrette Blount had 281 in five appearances. Even as a team, New England only ranked 18th in rushing yards. And while Blount ran all over the Colts (30/148/3) in the AFC Championship Game, he was held to just 40 yards on 14 carries in the Super Bowl, which still managed to lead the team.

Among the now 110 teams to make the Super Bowl, the 2014 Patriots rank last when it comes to rushing yards gained by their leading rusher. The 1998 Broncos, of course, rank first: Terrell Davis rushed for 2,008 yards that season. The graph below shows the rushing yards (pro-rated to 16 game seasons for years with shorter schedules) for the leading rusher on each Super Bowl team: the winners are shown in black, the losers in green, and the Bucs and Chiefs are shown in team colors. [continue reading…]

{ 0 comments }

LeSean McCoy Is Looking For Back To Back Rings

Since the start of the 2010 season, no player has more rushing yards than LeSean McCoy. It is easy to forget, but McCoy spent some time as the starting running back for the 2019 Chiefs, even though he did not get a carry in the playoffs. McCoy rushed for 465 yards and 4 touchdowns in the regular season and did earn a ring with Kansas City and his former head coach.

It might be even easier to forget that McCoy is a member of the 2020 Buccaneers. He was signed in early August, before Leonard Fournette would make his way to Tampa Bay.  McCoy has been the team’s fourth string running back, behind Ronald Jones, Fournette, and Ke’Shawn Vaughn. But no matter: McCoy is, technically, back in the Super Bowl, for the second year in a row.

If Tampa Bay wins, McCoy — who was arguably the best running back of the 2010s — will close out his career with a pair of rings with two teams that nobody will ever associate him with. That said, he would join a pretty exclusive list. Here are the eight players who have won back to back rings with different teams.

  • The two famous members of the club pulled off this trick in 1994, as members of the San Francisco 49ers, and in a surrounding year with the Dallas Cowboys. One was Deion Sanders, who left Atlanta for San Francisco in 1994, and then San Francisco for Dallas in ’95. The other was Ken Norton, Jr., who spent the first six years of his career with Dallas, and won the Super Bowl in 1992 and 1993. Norton then joined the 49ers in ’94, where he spent the final seven seasons of his career. Hochstein and Norton are the only two players to win Super Bowls in three consecutive seasons.
  • Guard Russ Hochstein was the next player to do so. He was drafted by Tampa Bay in 2001 and played in one game in 2002; he was waived in October and signed by the Patriots a week later. He stayed in New England through 2008, so Hochstein picked up a Super Bowl ring for his cup of coffee with the Bucs and then earned two more the next two seasons in New England. Hochstein was also a freshman with Nebraska in 1997, when the Cornhuskers were named national champions by USA Today and ESPN. He’s got a lot of hardware!
  • Defensive back Derrick Martin played in five games for the Packers in 2010 and 14 for the Giants in 2011. Sure, Martin had just 1 interception and 14 tackles during those two years, but it counts!
  • Brandon Browner was the next to do it, and he had a big role in both title teams.  He was a star on the ’13 Seahawks, although he was suspended towards the end of the season and did not play in the team’s postseason run. He joined New England in 2014, and then made the play of the game — or, perhaps, the assist of the game — to help the Patriots defeat his former team. [1]Caylin Hauptmann was also a member of the 2013 Seahawks, and he was signed by the 2014 Patriots.  I don’t believe he should be included, but if you want to, feel free!
  • LeGarrette Blount led the NFL in rushing touchdowns in 2016 with New England, picking up a ring with the Patriots that season.  The next year he joined the Eagles, and scored a touchdown in Philadephia’s Super Bowl win over his former team. Chris Long was also a rotational defensive linemen on both the ’16 Patriots and ’17 Eagles.
  • Surely you don’t remember that Kenjon Barner was the kickoff returner for the ’17 Eagles, do you?  Barner, a star of Oregon under Chip Kelly, joined Philadelphia under Kelly’s watch and survived with the team through 2017.  The next season, he was signed by the Patriots and rushed for 71 yards before being cut in midseason.  No matter: when the ’18 Patriots went on to win the Super Bowl, Barner received a ring.  Literally.  Oh, and guess what? Barner is also a member of the ’20 Buccaneers, although he is unlikely to play in Super Bowl LV.  But I assume he is definitely ready for a third ring in four years.


References

References
1 Caylin Hauptmann was also a member of the 2013 Seahawks, and he was signed by the 2014 Patriots.  I don’t believe he should be included, but if you want to, feel free!
{ 0 comments }

How do Kansas City and Tampa Bay compare to previous Super Bowl participants when it comes to scoring and preventing points? Without any adjustments for era, these two teams look like awful defensive teams and very good (but not historically great) offensive teams.

In the graph below, the X-Axis shows points scored per game, while the Y-Axis shows points allowed per game. The best teams would be in the lower right, at least according to this metric. The Bucs and Chiefs are color-coded, with Super Bowl winners in black circles and losers in white circles. The ’99 Rams are in the lower right corner at 33 points per game and 15 points allowed per game; the ’13 Broncos are the team at the far upper right, while the ’11 Giants, of course, are in the upper left: they are the only Super Bowl team to allow more points than they scored. [continue reading…]

{ 1 comment }

The Comeback Chiefs Win Super Bowl LIV

The Kansas City Chiefs are Super Bowl champions. And the Chiefs did it in one of the most remarkable ways possible: by coming back from double digit deficits in all three games.

Kansas City trailed 24-0 early in the 2nd quarter of the Division Round playoff game with the Texans. The Chiefs responded with four touchdown drives to somehow grab a 28-24 lead heading into the locker room.

In the AFC Championship Game, the Titans jumped out to a 10-0 lead 10 minutes into the game, and held a 17-7 lead with 5 minutes left in the half. Once again, Kansas City score two quick touchdowns to take a lead into the locker room, 21-17.

Then, last night in the Super Bowl, the 49ers took a 20-10 lead into the 4th quarter. The low point was probably with 7:13 left in the game, as the Chiefs trailed 20-10 and faced a 3rd-and-15 from the Kansas City 35-yard line. [continue reading…]

{ 1 comment }

Leading Rushers In Each Super Bowl

The last running back to win the Super Bowl MVP was Terrell Davis, which happened over 20 Super Bowls ago. One reason for that is a decline in big rushing games in the Super Bowl, particularly with respect to the winning team. Just once in the last 16 Super Bowls — Dominic Rhodes back in SuperBowl XLI — has the winning team had a 100-yard rusher. Perhaps more interesting is that in the last 9 Super Bowls, the losing team had the game’s leading rusher more than half the time.

The graph below shows the leading rusher for both the winning and losing teams in the Super Bowl. The winning team’s leading rusher is in a full black circle, while the losing team’s leading rusher is in a white circle with a black outline. In addition, in the 13 of 53 Super Bowls where the game’s leading rusher was on the losing team, I’ve put that in a white circle with a red outline. [continue reading…]

{ 0 comments }

Super Bowl Teams In Year N-1

Last year, the Kansas City Chiefs were the #1 seed in the AFC, while the 49ers had the second-worst record in the NFL. This year, the two teams are in the Super Bowl. Today, let’s look at how each of the 108 Super Bowl teams fared in Year N-1 — that is, the year before making the Super Bowl.

For each team, I calculated their Pythagenpat record in Year N-1. The best Super Bowl team by Year N-1 Pythagenpat record was, unsurprisingly, the 1973 Dolphins. As we all know, the year before Miami went 14-0 and won the Super Bowl.

The 2019 Chiefs don’t fare all that well in this regard, mostly because the 2018 team ranked 24th in points allowed. Kansas City was the #1 seed, but it was not a dominant team by these standards. The 49ers, however, do stand out as particularly bad (although I’ll note that San Francisco, despite finishing with the 2nd pick in the 2019 Draft, “only” had the 6th worst Pythagenpat rating of 2018). The 2018 49ers are one of the worst 5 teams to make the Super Bowl the following season. [continue reading…]

{ 0 comments }

[Editor’s note: this is a repost from last year, with a few updates.]

The first four Super Bowls were all played on grass stadiums: the first Super Bowl was at Memorial Coliseum in Los Angeles, the Orange Bowl in Miami hosted Super Bowls II and III, and Tulane Stadium in New Orleans was the venue for Super Bowl IV.

But the dreaded AstroTurf revolution came to football in the ’70s. For Super Bowl V, the Orange Bowl in Miami was again the host site, but by now, the natural grass surface had been replaced with Poly-Turf, making it the first Super Bowl played on artificial turf.

[continue reading…]

{ 0 comments }

In Super Bowl II, Green Bay quarterback Bart Starr completed 13 of 24 passes for 202 yards, with 1 TD and no interceptions. He also took three sacks for 30 yards, and his backup was sacked once for 10 yards.

That means on 28 dropbacks, the Green Bay passing attack picked up 162 yards and produced 1 TD and 0 INTs, which translates to 142 Adjusted Net Yards. That’s an Adjusted Net Yards per Attempt average of 6.50 in Super Bowl II for Green Bay.

So was that a good performance by Starr and the Packers passing attack? No.

It was a great one. Passing efficiency was a lot different in 1967 than it is today, and the Raiders had a great pass defense. In 1966, Oakland allowed 3.14 ANY/A to opposing passers, the 3rd-best in the AFL; in 1967, that number dropped to just 2.23, the best in the AFL and third in all of pro football. And in 1968, opposing QBs averaged just 2.81 ANY/A against the Raiders. (And in 1969, it was just 2.64.)

The graph below shows every game for the Raiders defense from 1966 to 1968, in chronological order. Joe Namath consistently gave the Raiders problems, including in the famous Heidi Game in 1968. But otherwise, the Raiders pass defense tended to overwhelm most quarterbacks. On the X-Axis, we have games played in order. The Y-Axis shows the ANY/A allowed by the Raiders, shown from -6 to 14 (since the league average ANY/A was around 4.0). [continue reading…]

{ 0 comments }

The first four Super Bowls were all played on grass stadiums: Memorial Coliseum in Los Angeles, the Orange Bowl in Miami for Super Bowls II and III, and Tulane Stadium in New Orleans.

But the dreaded AstroTurf revolution came to football in the ’70s. For Super Bowl V, the Orange Bowl in Miami was again the host site, but by now, the natural grass surface had been replaced with Poly-Turf, making it the first Super Bowl played on artificial turf.

The same thing happened the next year, at Super Bowl VI, as Tulane Stadium followed suit and resurfaced its field with Poly-Turf. And after a return to Memorial Coliseum for Super Bowl VII, the Dolphins and Vikings met in the first Super Bowl played on nylon texturized AstroTurf in Super Bowl VIII:

[continue reading…]

{ 0 comments }

There have been 52 Super Bowl games played so far, but they have featured just 17 upsets. But a Super Bowl upset was once extremely rare. The Jets and Chiefs produced the first two Super Bowl upsets, in Super Bowls III and IV, respectively. But then there wasn’t a single Super Bowl upset during the decade of the 1970s! (Excluding, of course, Super Bowl IV, which concluded the 1969 season but took place on January 11th, 1970).

In the 1980s, there were 4 Super Bowl upsets, all featuring the Raiders or the Redskins (or both). Oakland beat Philadelphia in 1980, Washington beat Miami in 1982, the Raiders beat the Redskins in ’83, and the Redskins upset the Broncos in ’87. All featured point spreads of 3.5 or fewer points, in contrast to the two double digit upsets from the AFL teams.

In the ’90s, there were just TWO upsets in the Super Bowl: the Giants over the Bills and the Broncos over the Packers. When Tom Brady and the Patriots took the field as underdogs in Super Bowl XXXVI, but 8 of the first 35 Super Bowls had featured upsets. But beginning with that first Patriots/Rams Super Bowls, there have been a whopping 9 upsets in 17 games (and the denominator is really 16 here, since one Super Bowl had an even point spread and therefore couldn’t feature an upset)! In other words, we’ve gone from an upset happening less than 25% of the time to an upset happening over 50% of the time.

Beginning with the first Patriots Super Bowl, and excluding the New England/Seattle Super Bowl (which featured the even points spread), there have been 16 Super Bowls with a favorite during the Brady/Belichick era. Of those 16 Super Bowls, the favorites have lost 9 times, and failed to cover in 3 of the 7 times that they actually won! There have been just 6 times in Super Bowl history that the favorite won but failed to cover the point spread, so that means half have occurred in relatively recent history.

From 1966 to 2000, favorites went 22-11-2 against the spread during the first 35 Super Bowls. In the 16 Super Bowls since 2001 to feature a favorite, those favorites have gone just 4-12 against the spread. The graph below shows the point spread (in red) and margin of victory (in blue) for the Super Bowl winner in each game. The point spread is shown as an expectation of how much the winner was expected to win by (so the Jets in Super Bowl 3, rather than shown as +18, are shown as -18). All Super Bowl upsets feature red bars that are negative.

What stands out to you?

{ 0 comments }

The Kansas City Chiefs led the NFL in scoring in 2018, and fielded the third highest scoring team in NFL history. But that doesn’t always lead to playoff success. Since 2000, just one team that led the NFL in scoring has won the Super Bowl.

The table below shows all teams to lead the NFL (or combined AFL/NFL) in the Super Bowl era, and how those teams fared in the playoffs. [continue reading…]

{ 0 comments }

Super Bowl LII Notes and Trivia

The matchup for Super Bowl LII is set. The 13-3 New England Patriots will be facing the 13-3 Philadelphia Eagles in Minneapolis, Minnesota in two weeks.

  • This is a matchup of the two #1 seeds, which is starting to become a thing again. The 1993 Bills/Cowboys was the last matchup of #1 seeds in the Super Bowl for a long time, until the 2009 Colts/Saints game. From ’94 to ’12, that was the only matchup of #1 seeds in the Super Bowl, but since then, it happened in 2013 (Seahawks over Broncos), 2014 (Patriots over Seahawks), 2015 (Broncos over Panthers) and now 2017.
  • For the 8th time, Tom Brady, Bill Belichick, and the New England Patriots are going to the Super Bowl. Remarkably, Brady has made the Super Bowl in half of his 16 seasons as the Patriots starting quarterback. He will, of course, extend his own record by playing in his eighth Super Bowl: no player has made seven, while Mike Lodish and Don Beebe each made six (Lodish played in all six; Beebe played in three).

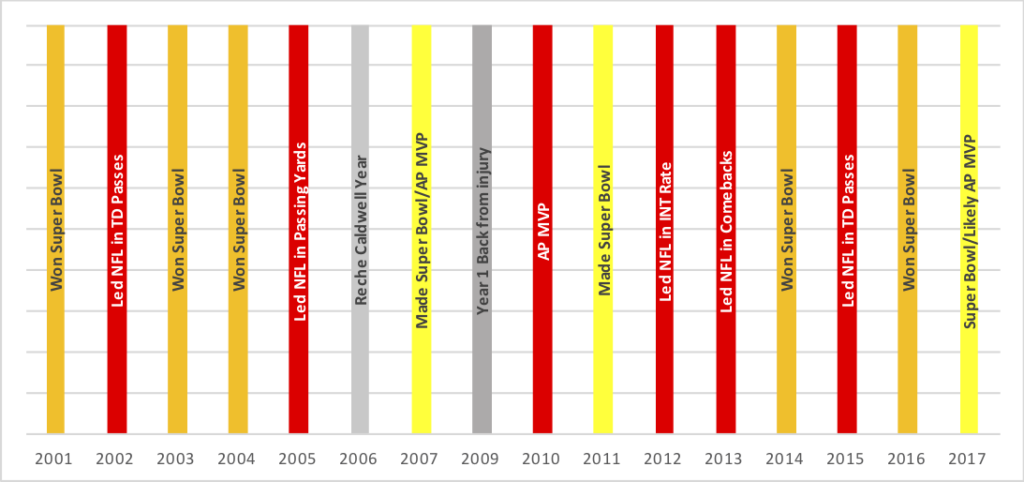
Brady has made the Super Bowl in half of his seasons as a starter; the other seasons haven’t been so bad, either:

[continue reading…]

{ 17 comments }

In 1981, the Chargers and Bengals met in the AFC Championship Game. That game isn’t the most memorable game played that day, in part because of the cold weather: nicknamed the Freezer Bowl, San Diego struggled on the road in a game played with a windchill of -32 degrees.

But the bad weather obscured the fact that Dan Fouts and Ken Anderson — by far the top two passers in the NFL that season — were facing off for the right to play in the Super Bowl. Over in the NFC, the 5th and 6th leading passers in ANY/A — Danny White and Joe Montana — were meeting in what would turn out to be one of the most memorable games in NFL history. [continue reading…]

{ 63 comments }

Guest Post: Alternative Super Bowl MVPs

Today’s guest post comes from Damon Gulczynski, a longtime reader, Seattle sports fan, and part-time writer. He also wrote this book on baseball names. As always, we thank our guest posters for contributing.


White runs for a score against the Falcons

James White was fantastic in Super Bowl LI, setting records in receptions (14) and total points (20), but he did not win the MVP Award.  Instead the voters bestowed that honor on a player who reduced his team’s chances of winning by nearly 15% on a single play (Robert Alford’s pick-six).  That, of course, is a misleading statement — Tom Brady went on to finish the game with over 450 passing yards in leading his team to the greatest comeback in Super Bowl history — but it is completely accurate to say James White was fantastic.  It would not have been unreasonable in the least to pick him over Brady for game MVP.  Super Bowl LI was a case where it would have been more representative of the story of the game to give out two MVP awards — or better yet to have a “three stars” of the game system, like hockey, so that Trey Flowers (2.5 sacks) could have been recognized along with Brady and White.

With this in mind, for fun, I decided to go through each of the 51 Super Bowls and retroactively select the three stars of the game.  In making these selections I relied on box scores, play-by-play logs, news articles, and video clips from past Super Bowls.  My full list is given below.  The actual Super Bowl MVPs are denoted with a + sign after their name; players on the losing team are denoted with a ~ after their name.  In 30 of the 51 cases the MVP was my first star of the game, which means I think the voters “got it wrong” 21 times.  And in six cases I think they really got it wrong, as the player they chose for MVP did not even qualify as my third star of the game. [continue reading…]

{ 29 comments }

Joe Montana had what many consider to be the best performance in Super Bowl history. In Super Bowl XXIV against the Broncos, Montana completed 22 of 29 passes for 297 yards and 5 touchdowns, with 1 sack for 0 yards. Jerry Rice was the biggest beneficiary, catching 7 passes for 148 yards and 3 touchdowns, in a 55-10 blowout of the Broncos.

Do the math, and Montana averaged 13.23 Adjusted Net Yards per attempt that day. Making it even more impressive is that he was facing a Broncos defense that allowed just 3.89 ANY/A to opposing passers during the regular season. That means Montana averaged 9.35 additional ANY/A relative to the average Broncos opponent. Over 30 dropbacks, that’s 280 Adjusted Net Yards of Value that Montana added. That’s the most in Super Bowl history, just ahead of what Doug Williams did two years earlier against the Broncos.

In that game, Williams was 18/29 for 340 yards with 4 TDs and 1 INT, and one sack for 10 yards. That’s an ANY/A of 12.17, but it came against a slightly tougher defense: the Broncos allowed 3.77 ANY/A that season. So Williams was 8.40 ANY/A better than “expected” against Denver, over 30 dropbacks; that means he produced 252 ANY of value in the Super Bowl.

Below are those numbers for each of the 128 passers in Super Bowl history. For Super Bowls prior to 1981, I had to use estimated sack data rather than actual, with the formula for estimated sacks being simply (Team Sacks) * (QB Pass Attempts/Team Pass Attempts). [continue reading…]

{ 40 comments }

Atlanta had a really, really good offense this year. My favorite statistic: the Falcons had 59 drives end in a punt or a turnover, and 58 end in a touchdown.  Atlanta averaged 3.03 points per drive this year, and yet, the offense has been even better in the playoffs.

There was no stopping Matt Ryan and the Falcons against Green Bay, as the group scored 44 points on 9 drives in the NFC Championship Game. In the division round, the Falcons scored 36 points on 9 or 10 drives against Seattle, depending on whether you want to treat the Falcons final drive of the game as a real drive.  In two NFC playoff games, Atlanta’s offense has scored 10 touchdowns, seen 5 drives end on punts, 3 end on field goals, with zero turnovers and one drive end with the clock running out.

Scoring 80 points on 18 or 19 drives translates to an average of 4.21 or 4.44 points per drive. Take an average of those two numbers, and the offense is still averaging a whopping 4.32 points per drive. How remarkable is that? Well, it’s the best average for any of the 102 Super Bowl teams in their pre-Super Bowl playoff games.

The NFL has not historically recorded drive stats, so I previously wrote how one can estimate the number of offensive drives a team has in a game or season.  I used that formula to measure the best playoff offenses entering the Super Bowl; unsurprisingly, the 1990 Bills were the previous hottest offense.

Against Miami in the division round, Buffalo had between 10 and 12 drives, depending on how you treat the final drives of the half (the Bills received the ball with 14 seconds left on their own 32, and took a knee) and the game (Buffalo received the ball with just over one minute to go, and ran three times for a first down to run out the clock). Those other ten drives ended as follows, in order: Touchdown, Field Goal, Field Goal, Touchdown, Touchdown, Interception, Field Goal, Touchdown, Touchdown, Punt. That’s 44 points on 10 real drives.

The next week, in the AFC Championship Game against the Raiders, the Bills had 11 or 12 drives, as the final drive of the game featured Buffalo taking a pair of knees to close out a 51-3 victory. The first 11 drives went: TD, TD, Interception, TD, missed FG, TD, TD, Punt, TD, FG, Punt.  That’s 44 points (Buffalo also scored on a pick six, and one extra point was missed) on 11 drives. [continue reading…]

{ 14 comments }

On Saturday, I noted that Matt Ryan and Tom Brady were the top two quarterbacks in ANY/A in 2016, setting up a rare Super Bowl matchup of the two leaders in that metric. The Falcons and Patriots offenses as a whole also rank 1st and 2nd in ANY/A: Matt Ryan averaged 9.03 ANY/A, and since he handled all but 3 of the Falcons pass attempts this year, you won’t be surprised to know that the Falcons offense averaged 9.01 ANY/A. Brady averaged 8.81 ANY/A, but of course missed four games due to a suspension; the Patriots team ANY/A was 8.46, still good enough for second-best in the NFL.

But as regular readers will remember, the Falcons and Patriots don’t just rank 1-2 in ANY/A; they rank first and second in ANY/A differential, too. Atlanta’s ANY/A differential was 2.70 (9.01 on offense, 6.31 on defense), just a hair ahead of New England (8.46, 5.78, net of 2.68). No other team was within 1 ANY/A of those two, making them the clear best teams in the NFL in ANY/A differential. [continue reading…]

{ 19 comments }

Best Offensive/Defensive Super Bowl Matchups

Three years ago, I wrote about how the Broncos/Seahawks Super Bowl was going to be the best matchup between offensive and defensive teams in Super Bowl history. This year doesn’t quite match that hype — particularly given that the Patriots defense isn’t as good as you might think, and that New England is actually more of an offensive team than a defensive team. If anything, this Super Bowl should be remembered as a matchup of two great passing attacks, rather than an offensive/defensive showdown.

But if we want to just look at points scored and points allowed, then yeah, this still stands out as a pretty good matchup of the number one scoring team in the NFL (Atlanta) against the number on team in points allowed (New England). The Falcons scored 33.8 points per game this year, while the Patriots allowed just 15.6; that produces a differential of 18.1 (difference due to rounding), which would make this the 5th best “offense/defense showdown” in Super Bowl history: [continue reading…]

{ 2 comments }

The two leaders in ANY/A in 2016.

Matt Ryan and Tom Brady finished the season ranked 1st and 2nd in the NFL in Adjusted Net Yard per Attempt. How unusual is that?

  • In 1966, Bart Starr led the NFL in ANY/A and was the NFL MVP. Len Dawson led the AFL in ANY/A, and was the AFL’s first-team All-Pro selection at quarterback (running back Jim Nance was the MVP). The Packers and Chiefs met in the Super Bowl, of course, making it one of just two times that the Super Bowl featured two first-team All-Pro choices at quarterback. The other? Super Bowl III, featuring Earl Morrall and Joe Namath).
  • In 1971, Roger Staubach had a historically great season, producing a remarkable 7.81 ANY/A. The runner-up that year was Bob Griese, at 6.35, and no other passer was over 6.00. Those 1971 seasons from Staubach and Griese both ranked in the top 50 in my era-adjusted passer rating seasons, too. Alan Page was the AP MVP choice that year, Staubach won the Bert Bell Award for Player of the Year, and Griese won the third MVP, given by the NEA. So when the Cowboys and Dolphins met in the Super Bowl, it featured two MVP quarterbacks, a feat that could be matched this year. The PFWA has already named Ryan as its MVP, but the AP or the Bert Bell Award could choose Brady, which would give us another set of dueling MVPs.
  • In 1984 Dan Marino was a unanimous MVP (AP, NEA, PFWA, Bert Bell) on the back of a groundbreaking performance. His raw numbers (48 TDs, 5,084 yards) were remarkable, but so was his 8.94 ANY/A average. Joe Montana had a darn good year, too: his 49ers went 15-1 and his 7.93 ANY/A was 1.24 ANY/A better than any quarterback not named Marino. From an ANY/A dominance standpoint, it’s very similar to what Ryan and Brady have done this year.

[continue reading…]

{ 1 comment }

Before last year’s Super Bowl, I wrote that Carolina led the NFL in points scored in a unique way. What made the Panthers scoring success so unusual? Most notably were these two facts:

  • Carolina ranked only 11th in yards, the worst-ever ranking for the top-scoring team; and
  • Carolina ranked only 9th in NY/A, the worst-ever ranking for the top-scoring team.

With the Patriots, you may be surprised to learn that while New England finished 1st in points allowed, the defense ranked just 16th in DVOA. There are a few explanations here:

  • The Patriots faced by far the easiest schedule of any defense in the NFL.  New England’s SOS was -7.1%, while Tennessee was 31st at -4.2%, and the Bills were 30th at -3.0%.  The Patriots would be tied for 8th in DVOA if that metric was not adjusted for strength of schedule, which is why the defense falls to 16th with those adjustments.
  • New England had just 11 turnovers, tied with the Falcons for fewest in the league. Combined with a generally good offense, and the average opponent’s drive against New England started inside the 25-yard line, the best in the league. That means the Patriots defense had a lot of turf behind them, making life much easier for the defense.
  • Opposing kickers missed 8 of 29 attempts, including three from within 45 yards.  In addition, the Patriots were 8th in red zone defense and 3rd in goal-to-go defense, which helps the points allowed numbers.

New England’s defense was hardly bad by traditional numbers: the Patriots ranked 8th in total yards allowed, 6th in Net Yards per pass Attempt allowed, and 3rd and 4th in yards per carry allowed and rush defense DVOA.  That’s a good defense, but again, is boosted by the very easy schedule. [continue reading…]

{ 13 comments }

Beating the Patriots in a Shootout

Can the Falcons beat the Patriots in Super Bowl LI in a shootout?  On some level, the answer is of course.  Atlanta was the highest-scoring team in the regular season, and the Falcons offense has been historically great. And yet, the early returns from the media on how Atlanta can beat New England tend to focus on whether the Falcons defense and pass rush can dominate the game.

That’s not surprising given the post mortem written following the Patriots two Super Bowl losses, and there is no doubt that “getting the better of Brady” has been the m.o. for most teams that have knocked New England out of the playoffs.   So can Atlanta win a 35-31 style game against the Patriots?

In general, the conventional wisdom is true regarding how to beat New England: the Patriots are 19-1 when scoring over 21 points in playoff games since 2001, with the only loss coming in the classic 2006 AFC Championship Game against the Colts.  But there are other exceptions.  There have been 12 games in the Tom Brady era that I would classify as a shootout, which means:

  • Both teams combine for 60+ points;
  • The game is decided by 15 or fewer points; and
  • Both teams combined for 600+ passing yards (which, surprisingly, eliminates the ’06 AFCCG)

The first of those games was Super Bowl XXXVIII against the Panthers; that game, of course, was in fact decided by the last team to have the ball, which was New England. The Patriots are “only” 8-4 in these games, though, which means there may in fact be a blueprint for the Falcons to follow.  Let’s look at those losses and see if they meet the spirit of the question:

  • 2009, SNF at Indianapolis: This was the “4th and 2” game, and it wouldn’t surprise anyone if the Patriots (or Falcons) employed a similarly aggressive tactic in this year’s Super Bowl.  The Patriots led the 9-0 Colts 31-14 early in the 4th quarter, when Peyton Manning kicked it into overdrive.  He led Indianapolis on a 5-play, 79-yard drive for a touchdown; after a Patriots punt, a Manning deep pass was intercepted.  New England responded with a FG to extend the lead to 34-21, but Manning responded with another 79-yard touchdown drive. New England tried to run out the clock, but faced a 4th-and-2 with 2:08 to go at the Patriots own 28.  The idea of giving Manning two minutes while trying to prevent a 6-point lead didn’t sound very good — and it wouldn’t against 2016 Matt Ryan, either — so the Patriots went for it but fell a yard short.  Manning responded with a quick touchdown, and Indianapolis won, 35-34.
  • 2011, week 3, at Buffalo: Yes, the “If Ryan Fitzpatrick can do it” game. Both Brady and Fitzpatrick cleared 350 passing yards, and Buffalo recorded four interceptions, one of which was a pick six. Buffalo had a 95-yard touchdown drive in the 4th quarter, and hit a field goal as time expired for a 34-31 win.
  • 2012, SNF at Baltimore: Another primetime game on the road against a hated rival. This was a back-and-forth game that saw Brady and Joe Flacco combine for over 700 yard through the air.  With 7:29 left in the game, Baltimore had the ball at their own 8, down by 9 points.  The Ravens drove 92 yards for the score, forced a punt, and then hit the game-winning field goal as time expired to steal a 31-30 win.
  • 2012, SNF vs. San Francisco: Yet another primetime game, and this one was a crazy one. The 49ers jumped out to a 31-3 lead, with Randy Moss, Delanie Walker, and Michael Crabtree all pulling in touchdowns.  The Patriots then stormed back with four touchdowns to make it 31-31 in the 4th quarter, before Kaepernick hit Crabtree for another touchdown.  The 49ers iced it with a field goal late, and a last-minute field goal by New England made the final score 41-34.

There are also these 12 regular season games that, for one reason or another, don’t fit the above criteria, but involved New England losing and the opponent scoring over 30 points:

Points
Tm
Year Date Time LTime Opp Week G# Day Result OT PF PA PD PC
NWE 2016 2016-11-13 8:30 SEA 10 9 Sun L 24-31 24 31 -7 55
NWE 2015 2015-12-06 4:25 4:25 PHI 13 12 Sun L 28-35 28 35 -7 63
NWE 2014 2014-09-07 1:03 1:03 @ MIA 1 1 Sun L 20-33 20 33 -13 53
NWE 2014 2014-09-29 8:31 7:31 @ KAN 4 4 Mon L 14-41 14 41 -27 55
NWE 2010 2010-11-07 1:02 1:02 @ CLE 9 8 Sun L 14-34 14 34 -20 48
NWE 2009 2009-11-30 8:40 7:40 @ NOR 12 11 Mon L 17-38 17 38 -21 55
NWE 2009 2010-01-03 1:02 12:02 @ HOU 17 16 Sun L 27-34 27 34 -7 61
NWE 2005 2005-10-02 1:02 1:02 SDG 4 4 Sun L 17-41 17 41 -24 58
NWE 2005 2005-11-07 9:08 9:08 IND 9 8 Mon L 21-40 21 40 -19 61
NWE 2004 2004-10-31 4:15 4:15 @ PIT 8 7 Sun L 20-34 20 34 -14 54
NWE 2003 2003-09-07 1:04 1:04 @ BUF 1 1 Sun L 0-31 0 31 -31 31
NWE 2001 2001-10-28 2:15 2:15 @ DEN 7 7 Sun L 20-31 20 31 -11 51

Do any of those games (or the ones described in more detail above) stick out to you as the right blueprint for Atlanta?  Would you say Atlanta has better odds of winning in a shootout, or in a low-scoring game?

{ 24 comments }

This week at the Washington Post, an ironclad, inarguable ranking all 106 players on the Broncos and Panthers. The list is a combination of best players, most valuable players, and also most important ones. For example, two players who maybe aren’t quite as good as these rankings imply have a pretty critical role on Sunday:

11. Michael Oher, T, CAR
Oher, who started for the Ravens in Super Bowl XLVII, joins Harry Swayne (San Diego, Denver, Baltimore), Jon Runyan (Tennessee, Philadelphia), and Fred Miller (St. Louis, Chicago) as the only offensive tackles to start in Super Bowls for different teams.

12. Mike Remmers, T, CAR
Given the Broncos’ league-best pass rush, the pressure will be on Oher and Remmers to contain Denver’s terrifying edge-rushers. Remmers, an undrafted free agent in 2012 who has been with six franchises in four seasons, could be the key to the game — for both teams.

You can read the full article here.

{ 16 comments }

In 1974, Terry Bradshaw was not very good. He threw for just 785 yards on 148 pass attempts, while throwing only 7 touchdowns against 8 interceptions. That translates to a 2.92 Adjusted Net Yards per Attempt average, which is terrible even for 1974. He ranked 25th in ANY/A among the 32 quarterbacks with at least 120 pass attempts. Given the league average of 3.91, that means Bradshaw finished the year with a Relative ANY/A of -0.99.

That’s the worst of any quarterback who wound up winning the Super Bowl. But that doesn’t mean Bradshaw wasn’t a big part of why Pittsburgh won its first title. He was excellent in the team’s three playoff games, particularly in Pittsburgh’s first win. [continue reading…]

{ 11 comments }

Last year, I wrote a post on the plays that had the biggest impact on the eventual Super Bowl champion. These were the plays that affected the Super Bowl win probability by the biggest amount among teams that did not win the title. At the time, the Buffalo Bills were on the short end of the most influential play in the Super Bowl era. When Frank Reich put the ball down for Scott Norwood, I estimated that the Bills had a 45% chance on winning the Super Bowl. [1]Recent research by Chase suggests something similar. After the kick went wide right, the Bills’ win probability fell to zero. The 45 percentage point fall was the biggest change for a non-champion of any play in the Super Bowl era. Over 48 years, a bunch of plays fell in that range, but no team could point to a single play as having lowered its championship chances by so large an amount.

A couple weeks ago, that long-held record got broken kind of like Michael Johnson broke the 200-meter record in the Atlanta Olympics. Malcolm Butler’s pick obliterated the old mark. My estimate has the Butler interception as increasing the Patriots’ chances of winning by 0.87. There is no doubt that what some have called the Immaculate Interception is on an island by itself as the most influential play in NFL history.

To get that change in win probability from Butler’s play, I am going to assume that the Seahawks would have run on third and fourth down. I am going to give a run from the one a 60% chance of working. That might seem high, but the Patriots were the worst team in football in stuffing the run in important short-yardage situations either on third or fourth down, or down by the goal line. And their limited success mostly came against terrible running teams. It is not a huge sample, but against teams outside the worst quarter of rushing teams by DVOA, the Patriots had allowed opponents to convert 16 of 17 times with two yards or less to go for a first down or touchdown. If we add the playoffs, they actually had three more stops against good running teams (Baltimore and Seattle), albeit in games where the opponent had a good amount of success on the ground. [2]Note that the stop against Baltimore should not even count. In an otherwise great game for Gary Kubiak, he called for a reverse to Michael Campanaro on third-and-1 in the second quarter. The run was … Continue reading With Seattle being the best rushing team in football by a mile and the Patriots being at best not great in run defense in that situation, it seems hard to think that Seattle had anything less than a 0.60 chance of scoring on a run. [continue reading…]

References

References
1 Recent research by Chase suggests something similar.
2 Note that the stop against Baltimore should not even count. In an otherwise great game for Gary Kubiak, he called for a reverse to Michael Campanaro on third-and-1 in the second quarter. The run was stopped for a loss. The Patriots basically could not stop Justin Forsett, making the reverse call very unnecessary.
{ 31 comments }

This week at the New York Times, a look at the most heartbreaking losses in Super Bowl history.

The Seattle Seahawks were a yard from history. Trailing by 4 points in the final minute of Sunday’s Super Bowl, Seattle had the ball, on second down, at the Patriots’ 1-yard line. According to the website Advanced Football Analytics, that gave the Seahawks an 88 percent chance of winning the Super Bowl.

With a win, Seattle would have become just the ninth team in the Super Bowl era to repeat as champion, and the first since the 2003-4 Patriots. The defense, which had allowed the fewest points in the N.F.L. in each of the last three seasons, would have strengthened its argument to be considered the greatest in football history.

But it was not to be. Brandon Browner jammed Jermaine Kearse at the line, and Malcolm Butler shot in front of Ricardo Lockette to make a game-changing interception. For Patriots fans, it was a play to remember forever. For Seahawks fans, it was one they wish they could forget.

But where does Super Bowl XLIX rank among the most painful Super Bowl losses in history?

You can read the full article here.

{ 17 comments }

Super Bowl Champions and First Round Contributors

The only skill position player in Super Bowl XLIX drafted in the first round

The only skill position player in Super Bowl XLIX drafted in the first round

On offense, the Patriots have one player on the entire roster who was selected in the first round: tackle Nate Solder.  On defense, starters Chandler Jones, Dont’a Hightower, Devin McCourty, and Vince Wilfork were chosen by New England in the first round. And let’s not forget Darrelle Revis, a first round pick of the Jets; those are five of the best players on New England’s defense right now.  The Patriots defense also features Jerod Mayo and Dominique Easley, two former first round picks now on injured reserve.

But most of New England’s key contributors were not first round picks. Tom Brady, of course, was a 6th round pick. Rob Gronkowski was a 2nd, Julian Edelman was a 7th, Brandon Lafell was a 3rd, Rob Ninkovich was a 5th, and so on. Every year, Pro-Football-Reference generates an Approximate Value rating for each player in the NFL. This year, former first round picks of the Patriots generated just 23% of the team’s Approximate Value. [continue reading…]

{ 2 comments }

The physicist Werner Heisenberg (this guy, not this guy) found that observers affect the systems they attempt to measure, something that is related to but actually separate from his Uncertainty Principle. Even if Heisenberg was thinking about submicroscopic particles whizzing around, his ideas can still apply to writing about NFL betting. Writing about my bets could change the sequence of events that follow, at least in theory, just like all the other actions people take everywhere that put the world on a different course. The NFL season that just unfolded was just one of an infinite number of potential seasons that could have happened. In what share of the possible seasons did my pick for the NFL’s worst team start the season 9-1? Am I just the worst predictor ever, someone dumb enough to underestimate the great Arians and the new great HC of the NYJ? Or was I tempting fate by writing about real bets?

Since I am supposed to be a coldly-rational, data-driven guy, I am going to chance it and review my NFL betting this year. This is risky since my betting year could still be saved by events yet to be determined. Before I get to all that, I am hoping that maybe my writing about football can influence something much more plausible, namely whether I attend the Super Bowl next week. Apologies for this distraction, but I could really use some help.

***HUMBLE REQUEST BEGIN***

If you have read any of my stuff here or on Football Outsiders, you may know that I am a Patriots fan. Sufficiently dedicated to have flown from Los Angeles to Boston for the Ravens game, then back to LA for the first week at Loyola Marymount, before flying back to Boston for the Colts game. Now I am hoping to obtain two tickets to the Super Bowl. Here is what I can offer: [continue reading…]

{ 6 comments }

This week at the New York Times, a look at the second straight “historically great offense vs. historically great defense” Super Bowl:

Last year’s Super Bowl pitted one of the greatest single-season offenses in N.F.L. history against one of the greatest single-season defenses. Using slightly different time frames, this year’s Super Bowl can boast similar claims.

Both the New England Patriots and the Seattle Seahawks had slow starts in 2014. After New England’s 41-14 loss to the Kansas City Chiefs in Week 4, pundits wondered if we were witnessing the end of the Tom Brady/Bill Belichick-era Patriots. But since that game, the offensive line emerged as a cohesive unit, Rob Gronkowski’s health improved and Brady became red-hot. Since that game, New England has averaged 35.3 points per game, including the playoffs (but excluding the meaningless Week 17 finale, in which the Patriots benched many starters).

From Games 5 to 15 of the regular season, New England scored 379 points, the seventh most during such a stretch of any team since 1970. Then, the Patriots scored 35 points in the team’s first playoff win over the Baltimore Ravens, and 45 last weekend against the Indianapolis Colts. New England joins the 1994 San Francisco 49ers and the 1990 Buffalo Bills as the only Super Bowl participants to average 40 points per game through multiple playoff games before the Super Bowl.

You can read the full article here.

{ 2 comments }

A full one-quarter of all NFL teams have opening day starters who have won a Super Bowl: New England (Tom Brady), Pittsburgh (Ben Roethlisberger), Baltimore (Joe Flacco), Denver (Peyton Manning), New York Giants (Eli Manning), Green Bay (Aaron Rodgers), New Orleans (Drew Brees) and Seattle (Russell Wilson) all sport Super Bowl winning passers.

That’s pretty rare. In 1991, Jeff Hostetler was the only quarterback starting in week 1 who had a Lombardi Trophy on his resume. [1]Phil Simms was the team’s backup, Joe Montana missed the entire year with an elbow injury, Doug Williams had retired, Jim McMahon was the backup in Philadelphia, Jim Plunkett and Joe  … Continue reading From 1993 to 2012, an average of 4.0 week 1 starters had previously won a title. Having a Super Bowl winning quarterback is nice, but it doesn’t exactly make a team unique. At least not for 2014.

YearWk 1 SB QBsQuarterbacks
20148Tom Brady; Ben Roethlisberger; Peyton Manning; Eli Manning; Drew Brees; Aaron Rodgers; Joe Flacco; Russell Wilson
20137Tom Brady; Ben Roethlisberger; Peyton Manning; Eli Manning; Drew Brees; Aaron Rodgers; Joe Flacco
20126Tom Brady; Ben Roethlisberger; Peyton Manning; Eli Manning; Drew Brees; Aaron Rodgers
20115Tom Brady; Ben Roethlisberger; Eli Manning; Drew Brees; Aaron Rodgers
20105Brett Favre; Tom Brady; Peyton Manning; Eli Manning; Drew Brees
20096Brett Favre; Kurt Warner; Tom Brady; Ben Roethlisberger; Peyton Manning; Eli Manning
20086Brett Favre; Kurt Warner; Tom Brady; Ben Roethlisberger; Peyton Manning; Eli Manning
20074Brett Favre; Tom Brady; Ben Roethlisberger; Peyton Manning
20064Brett Favre; Kurt Warner; Tom Brady; Brad Johnson
20054Brett Favre; Kurt Warner; Trent Dilfer; Tom Brady
20044Brett Favre; Kurt Warner; Tom Brady; Brad Johnson
20034Brett Favre; Kurt Warner; Tom Brady; Brad Johnson
20023Brett Favre; Kurt Warner; Tom Brady
20012Brett Favre; Kurt Warner
20003Troy Aikman; Brett Favre; Kurt Warner
19993Troy Aikman; Steve Young; Brett Favre
19984Troy Aikman; Steve Young; Brett Favre; John Elway
19973Troy Aikman; Steve Young; Brett Favre
19962Troy Aikman; Steve Young
19953Jeff Hostetler; Troy Aikman; Steve Young
19943Joe Montana; Jeff Hostetler; Troy Aikman
19936Joe Montana; Jim McMahon; Phil Simms; Jeff Hostetler; Mark Rypien; Troy Aikman
19922Phil Simms; Mark Rypien
19911Jeff Hostetler
19902Joe Montana; Phil Simms
19893Joe Montana; Jim McMahon; Phil Simms
19884Joe Montana; Jim McMahon; Phil Simms; Doug Williams
19872Joe Montana; Phil Simms
19862Joe Montana; Jim McMahon
19853Jim Plunkett; Joe Montana; Joe Theismann
19843Jim Plunkett; Joe Montana; Joe Theismann
19834Ken Stabler; Jim Plunkett; Joe Montana; Joe Theismann
19824Terry Bradshaw; Ken Stabler; Jim Plunkett; Joe Montana
19813Terry Bradshaw; Ken Stabler; Jim Plunkett
19803Bob Griese; Terry Bradshaw; Ken Stabler
19794Roger Staubach; Bob Griese; Terry Bradshaw; Ken Stabler
19783Roger Staubach; Terry Bradshaw; Ken Stabler
19775Joe Namath; Roger Staubach; Bob Griese; Terry Bradshaw; Ken Stabler
19764Joe Namath; Roger Staubach; Bob Griese; Terry Bradshaw
19754Joe Namath; Roger Staubach; Bob Griese; Terry Bradshaw
19744Joe Namath; Len Dawson; Roger Staubach; Bob Griese
19734Joe Namath; Johnny Unitas; Roger Staubach; Bob Griese
19723Joe Namath; Len Dawson; Johnny Unitas
19711Len Dawson
19703Bart Starr; Joe Namath; Len Dawson
19692Bart Starr; Joe Namath
19681Bart Starr
19671Bart Starr

References

References
1 Phil Simms was the team’s backup, Joe Montana missed the entire year with an elbow injury, Doug Williams had retired, Jim McMahon was the backup in Philadelphia, Jim Plunkett and Joe Theismann had long been retired, and that takes us all the way back to 1979.
{ 10 comments }
Previous Posts