≡ Menu

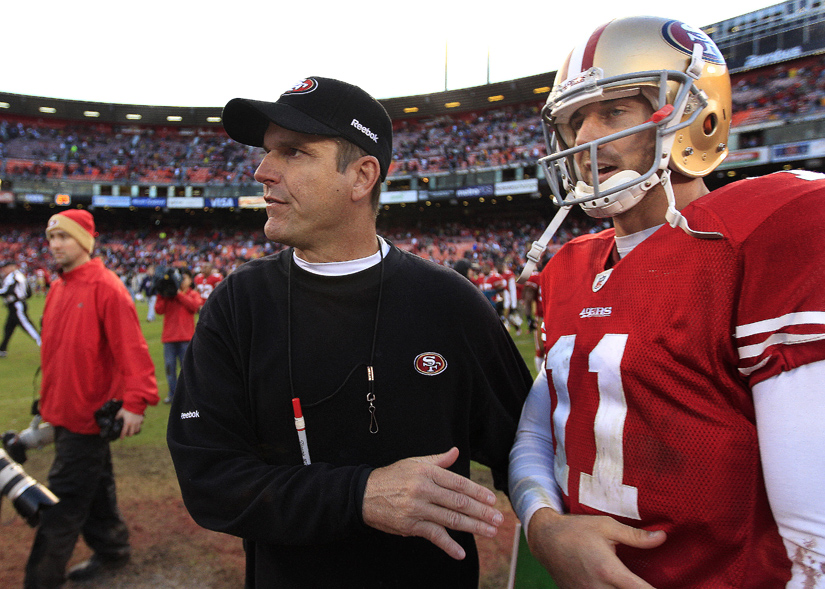
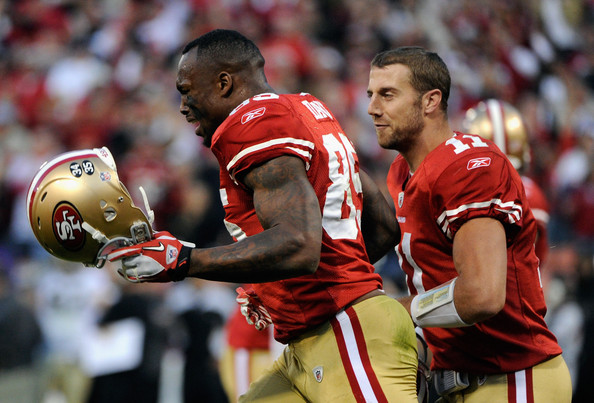
Smith and Davis with the 49ers

On Sunday against the Panthers, Washington quarterback Alex Smith threw a touchdown pass to tight end Vernon Davis. Over 12 years ago, the two connected for the first touchdown reception of Davis’s career, back when both players were with the 49ers.

How rare is it for a quarterback to throw a touchdown pass to a player, and then throw a touchdown pass 12 years later to the same player on a new team? Well, it’s never happened before. The closest was with Randall Cunningham and Cris Carter; the duo connected for a touchdown pass in November 1987 with the Eagles, and last connected for a touchdown pass in September 1999 with the Vikings, a span of nearly 12 years.

The table below shows, through 2017, all QB/Receiver pairings where the duo connected for touchdown passes on different teams.  I have used “different teams” liberally here (e.g., including the old Browns and Ravens as different teams), but you can consider them the same team if you like.

QBReceiverFirst TDFirst TmLast TDLast TmTD Tm1TD Tm2Total TDsYears
Alex SmithVernon Davis09/10/2006sfo10/14/2018was3513612.1
Randall CunninghamCris Carter11/01/1987phi09/12/1999min17163311.9
Y.A. TittleHugh McElhenny10/05/1952sfo10/27/1963nyg1321511.1
Drew BledsoeTerry Glenn09/08/1996nwe10/01/2006dal21103110.1
Peyton ManningBrandon Stokley12/14/2003clt01/12/2013den186249.1
Jay SchroederGary Clark12/08/1985was12/04/1994crd141159
Steve McNairDerrick Mason10/25/1998oti09/23/2007rav303338.9
George BlandaBilly Cannon10/30/1960oti11/24/1968rai201218.1
Jay CutlerEddie Royal09/08/2008den09/11/2016chi5278
Jay CutlerBrandon Marshall12/03/2006den11/16/2014chi1426408
Ken StablerDave Casper09/22/1974rai11/29/1981oti387457.2
Zeke BratkowskiCarroll Dale09/17/1961ram10/20/1968gnb47117.1
Brian GrieseDesmond Clark09/04/2000den10/07/2007chi7297.1
Vinny TestaverdeMark Carrier12/06/1987tam01/01/1995cle215267.1
Jim HarbaughCurtis Conway10/10/1993chi11/05/2000sdg2247.1
Carson PalmerT.J. Houshmandzadeh11/28/2004cin12/04/2011rai341357
Fran TarkentonBob Tucker10/25/1970nyg10/30/1977min8197
Neil O'DonnellYancey Thigpen09/19/1993pit09/10/2000oti114157
Vinny TestaverdeKeyshawn Johnson09/20/1998nyj12/19/2004dal86146.2
Carson PalmerJermaine Gresham09/12/2010cin11/27/2016crd4376.2
Jack KempKeith Lincoln11/12/1961sdg12/09/1967buf1566.1
Trent DilferDarrell Jackson11/04/2001sea10/21/2007sfo5166
Billy WadeJoe Marconi09/26/1959ram10/25/1964chi1455.1
Steve DeBergTony Martin12/05/1993mia12/27/1998atl1125.1
Neil O'DonnellJeff Graham09/06/1992pit08/31/1997nyj1345
Jim HarbaughFloyd Turner09/04/1994clt12/13/1998rav105154.3
Jim HarbaughRoosevelt Potts09/25/1994clt12/27/1998rav2244.3
Browning NagleTerance Mathis10/04/1992nyj12/02/1996atl2134.2
Earl MorrallNorm Bulaich10/10/1971clt12/01/1975mia2134.1
Jim HardyBob Shaw10/20/1946ram12/10/1950crd111124.1
Ralph GuglielmiJoe Walton11/02/1958was12/09/1962nyg5164.1
Vinny TestaverdeMichael Jackson10/24/1993cle11/16/1997rav1217294.1
Ernie NeversCobb Rooney10/10/1926dul10/26/1930crd2354
Josh McCownMatt Forte11/17/2013chi12/03/2017nyj2134
Lamar McHanGary Knafelc10/04/1959gnb10/20/1963sfo2134
Vinny TestaverdeBrian Kinchen09/26/1993cle10/05/1997rav3254
Tarvaris JacksonSidney Rice11/25/2007min11/20/2011sea7294
Peyton ManningJacob Tamme11/01/2010clt09/21/2014den46103.9
Frank ReichPete Metzelaars12/15/1991buf09/03/1995car2133.7
Rodney PeeteIrving Fryar09/01/1996phi01/02/2000was3143.3
Chuck MuncieWes Chandler09/02/1979nor12/20/1982sdg1233.3
George TaliaferroDick Wilkins09/02/1949lda11/27/1952dtx2133.2
Boomer EsiasonRob Moore09/05/1993nyj11/17/1996crd6173.2
Vinny TestaverdeDerrick Alexander09/18/1994cle11/02/1997rav216183.1
Milt PlumTom Watkins09/24/1961cle11/01/1964det1123.1
Rich GannonAndre Rison11/30/1997kan12/16/2000rai56113
Bob GaglianoTerry Greer10/11/1987sfo10/07/1990det1123
Kent GrahamLeShon Johnson09/29/1996crd09/26/1999nyg1123
James HarrisBob Klein11/04/1974ram10/30/1977sdg5163
Josh McCownAustin Seferian-Jenkins11/09/2014tam10/22/2017nyj1343
Rich GannonDerrick Walker11/28/1996kan10/10/1999rai1122.9
Gus FrerotteRandy McMichael09/11/2005mia12/02/2007ram5272.2
Kyle OrtonBrandon Lloyd09/21/2008chi11/28/2010den29112.2
Erik KramerChris Penn10/12/1997chi10/03/1999sdg5162
Norm SneadBob Grim10/31/1971min10/21/1973nyg1342
Benny FriedmanLen Sedbrook11/18/1928dwl10/05/1930nyg2681.9
Jeff BlakeWillie Jackson09/12/1999cin11/05/2000nor2131.1
Benny FriedmanOssie Wiberg11/06/1927cib12/09/1928dwl2241.1
Benny FriedmanRex Thomas10/30/1927cib11/29/1928dwl2241.1
Al DekdebrunRay Ebli11/10/1946bba12/07/1947cra1121.1
Vinny TestaverdeEarnest Byner09/24/1995cle10/20/1996rav1121.1
Benny FriedmanCarl Bacchus10/23/1927cib11/11/1928dwl3361.1
Benny FriedmanProc Randels11/27/1927cib12/09/1928dwl1121
Bob CeleriBuddy Young10/21/1951nyy10/26/1952dtx2131
Bob CeleriGeorge Taliaferro12/09/1951nyy10/18/1952dtx2130.9

Stabler and Casper hold the record for combined touchdowns on two teams, at 45, although most of those were in Oakland. Bledsoe/Glenn, Cunningham/Carter, Cutler/Marshall, and — if you want to include them, Testaverde/Jackson and Testaverde/Alexander — are the only pairs to connect for double digit touchdowns on two different teams.

{ 0 comments }

Former 49ers and Chiefs quarterback Alex Smith has a well-earned reputation for being overly conservative. Smith was known as a low-risk, low-reward passer for years: he avoided interceptions but took a ton of sacks and threw a lot of short, safe passes. In 2011 with the 49ers, he ranked 30th in average pass length; he didn’t have enough passes in 2012 to qualify, but in 2013 with the Chiefs, he ranked 36th in how far his average pass traveled. In 2014, he ranked 33rd, and he repeated that ranking in 2015. In 2016 he ranked 29th, before vaulting to 22nd last year.

From 2011 to 2017, Smith threw 43 interceptions but took an incredible 260 sacks! That means over the last seven seasons, Smith has been sacked over 6 times as often as he’d thrown an interception (6.05 to be precise). Among the 32 quarterbacks who have thrown the most passes since 2011, only three others have even a 4:1 sack:interception ratio. Two of them are two of the best quarterbacks in the NFL in Russell Wilson (4.4 to 1) and Aaron Rodgers (5.20 to 1).  And there are some extenuating circumstances in both cases.

Wilson has played behind terrible offensive lines and scrambles often, which inflates his sack rate. Rodgers has been arguably the best quarterback in the NFL over the last seven years and has a tiny interception rate, although taking too many sacks is a legitimate criticism of his game. But neither passer is a dink-and-dunk type: both rank in the top 8 in yards per completion since 2011 (Rodgers averaged 12.0 yards per completion, Wilson 12.2) while Smith ranked in the bottom 8 with an 11.2 average.

The fourth quarterback is Smith’s old teammate, Colin Kaepernick (5.70 to 1). Even as a young player, Kaepernick always took a lot of sacks, and like Wilson, his scrambling inflated his sack rate a bit. Kaepernick averaged 5.3 sacks for every interception in 2012, then 4.9 in 2013, 5.2 in 2014, 5.6 in 2015, before catapulting to 9.0 in 2016, a year that may have been influenced by his political stance. But even still, Kaepernick wasn’t really a great match for Smith because he averaged 12.1 yards per completion, the 6th-highest rate since 2012.

So over the last 7 years, it’s pretty clear that no quarterback embodied the risk-averse style of player quite like Smith. With a ton of sacks, not many interceptions, and a low yards per completion average, Smith was the most conservative passer in football.

But over the last three years, Tyrod Taylor has taken the crown. In fact, Taylor is more Alex Smith than even Alex Smith! I looked at the 32 quarterbacks with the most pass attempts since the start of the 2015 season. Among that group, Taylor ranks 2nd in interception rate at just 1.29%, but he also ranks last in sack rate at 9.1%! The scramble factor is an issue here — by scrambling when a play breaks down instead of throwing it away, Taylor’s sack rate isn’t quite as bad as it appears — but only two of the other 32 quarterbacks have a sack rate within even two percent of Taylor’s. [continue reading…]

{ 1 comment }

Back in November, Cian Fahey tweeted me a simple question: “What is Alex Smith’s record in games where his D gives up 21 or more points?”

I made a note to run the numbers in the off-season, and guess what? It’s the off-season. Smith now holds a career record of 7-38-1 (including a 1-1 mark in the postseason) when his team [1]Yes, that is not the same thing as his defense. allows 21 or more points. That’s really bad, as it turns out. In fact, among quarterbacks who started such a game last year, only Ryan Fitzpatrick (5-43-0) has a worse career record. [continue reading…]

References

References
1 Yes, that is not the same thing as his defense.
{ 32 comments }
Luck's rushing ability makes him a QBR star

Luck's rushing ability makes him a QBR star.

A few weeks ago, I put ESPN’s Total QBR under the microscope. Today, I want to look at the quarterbacks whose passing statistics most differ from their QBR grades.

Total QBR grades go back to 2006, so to start, I ran a regression using Adjusted Net Yards per Attempt to predict Total QBR. The best-fit formula was:

Total QBR = -13.5 + 11.23 * ANY/A

For those curious, the R^2 was 0.80, indicating a very strong relationship between ANY/A and Total QBR. What this formula tells us is that a passer needs to average 5.65 ANY/A to be “projected” to have a QBR of 50; from there, every additional adjusted net yard per attempt is worth 11.2 points of QBR. Last year, Peyton Manning averaged 8.87 ANY/A, which projects to a QBR of 86.2. In reality, Manning had a QBR of “only” 82.9; this means Manning’s QBR says he wasn’t quite as amazing as his excellent efficiency numbers would indicate (to say nothing of his otherworldly gross numbers). One likely reason for this result is that Manning ranked 29th in average pass length in the air (according to NFLGSIS) and 6th in yards after the catch per completion; this matters because ESPN gives more credit to quarterbacks on the yards they accumulate through the air. (Throughout this post, we will be forced to deal with educated guesses, because Total QBR is a proprietary formula.)

As it turns out, Manning rating higher in actual QBR than projected QBR is a stark departure from prior years. In 2012, he finished 7.2 points higher in actual QBR than projected QBR, but that’s nothing compared to his time with the Colts. In five years in Indianapolis during the Total QBR era, Manning finished at least 10 points higher in actual QBR each season.

Along with Manning, Matt Ryan and Andrew Luck are the two quarterbacks who are most likely to over-perform relative to their “projected” ratings. Let’s be careful about exactly what this means: whatever the ingredients that go into the QBR formula that don’t go into the ANY/A formula, Manning, Ryan, and Luck seem to have a lot of them.

Luck is a fascinating case. In 2012, he ranked just 20th in ANY/A, but 11th in QBR. I wrote several articles during Luck’s rookie season about how his QBR ratings surpassed his standard stats. [1]Although now I can’t recall if his 2012 ratings were inflated because of his 4th quarter comebacks.  And I can’t check, because once ESPN decided to cap the clutch weight associated with … Continue reading Last year, he ranked 16th in ANY/A and 9th in QBR. Does this make Luck the quarterback most underrated (if you buy into QBR) by his traditional passing numbers (if you buy into ANY/A)? [continue reading…]

References

References
1 Although now I can’t recall if his 2012 ratings were inflated because of his 4th quarter comebacks.  And I can’t check, because once ESPN decided to cap the clutch weight associated with each play, they retroactively applied the current formula across past years.
{ 11 comments }

Superman wears #12 in Indianapolis now.

Superman wears #12 in Indianapolis now.

The NFL playoffs began in very entertaining fashion in Indianapolis. The Chiefs lost Jamaal Charles on the first drive of the game to a concussion, but stormed out to a 38-10 lead. Then the Colts pulled off the second greatest comeback in NFL history, eventually winning 45-44. The much-maligned Alex Smith had the game of his life, finishing 30 of 46 for 378 yards, with 4 touchdowns and no interceptions while also rushing for 57 yards.

Of course, Andrew Luck had an incredible game, too, even if it wasn’t necessarily as efficient. Luck went 29/45 for 443 yards and 4 touchdowns to counter his 3 interceptions, rushed for 45 yards, and recovered a Donald Brown fumble and ran it in for the touchdown.

Which made me wonder: where does this game rank among the greatest quarterback battles? To make life simpler, I’m only going to look at passing statistics, although obviously both players added some value on the ground. Smith averaged 9.23 Adjusted Net Yards per Attempt, defined as (Passing Yards + 20*TD – 45*INT – Sack Yards) divided by (Pass Attempts + Sacks). The NFL average in 2013 was 5.87 ANY/A, which means Smith produced 3.36 ANY/A over average. And, since he had 48 pass attempts (including sacks), that means Smith provided 161 yards over average.

Luck’s averages were hurt by the three interceptions, but he still produced 8.23 ANY/A and therefore 2.41 ANY/A over average. That means, over his 46 dropbacks, he produced 111 yards of value over average. So where does that mean this game ranks among all playoff games since 1970? My initial thought was to simply add the two value over average numbers, but that ended up producing a list dominated by great games by one quarterback. To counter this, I decided to only look at games where both quarterbacks were above average and to instead take the Harmonic Mean of their values. This wound up producing a pretty good list, and it places Luck/Smith at #9. [continue reading…]

{ 5 comments }

New York Times: Post-Week 7, 2013

This week at the New York Times, I look at how the Chiefs have gone from worst to first:

The Chiefs have found success in an unusual way. In the modern N.F.L., the best teams tend to be the best passing teams, but Kansas City has managed to succeed with a mediocre passing attack thanks to a great defense, excellent field position, a dynamic offensive talent and an easy schedule.

Kansas City’s defense has been dominant, ranking first in both points allowed and passer rating allowed. Bob Sutton, a defensive coach with the Jets from 2000 to 2012, has done a remarkable job transforming a defense that struggled in 2012 into the league’s best in 2013.

Inside linebacker Derrick Johnson made the Pro Bowl in each of the past two seasons and has been strong again this season, but he is just the third best linebacker on the team, behind outside linebackers Justin Houston and Tamba Hali.

Houston has 10 sacks and 2 fumble recoveries. Hali has nine sacks and four forced fumbles, and he has returned an interception for a touchdown. Hali has 40 hurries, the most in the N.F.L., according to Pro Football Focus. No. 2 on that list? Houston, with 28.

Houston and Hali made the Pro Bowl last year, but they are reaching new heights this season in part because of a greatly improved defensive line. Dontari Poe, Tyson Jackson and Mike DeVito were question marks entering the season, but the three have produced remarkable results through seven weeks.

I also discuss how Alex Smith has the lowest average depth of pass this season, but still has a mediocre completion percentage:

Smith’s average pass has traveled just 6.23 yards past the line of scrimmage this year, the shortest of any passer. Quarterbacks who throw shorter passes tend to produce high completion percentages — Smith, who frequently checked down with San Francisco, too, completed 70.2 percent of his passes last year — but this season, Smith has completed only 58 percent of his passes with Kansas City.

You can read the full article here.

{ 0 comments }

How bad were the Chiefs last year?

  • Kansas City went 2-14, tied for the worst record in the league with Jacksonville. Since the Chiefs faced an easier schedule, they received the first pick.
  • With an Simple Rating System score of -14.0, Kansas City had the worst SRS rating in the league. They ranked 32nd in points scored and 25th in points allowed, leaving them 32nd in points differential. With a slightly easier than average schedule, that left them 32nd in the SRS, too.
  • The Chiefs ranked in the bottom three in both NY/A and NY/A allowed.
  • With a -24 turnover differential, K.C. tied several other teams, including the 2012 Eagles, for the third worst turnover differential since 1978.
  • Brian Burke ranked the Chiefs 31st overall, 31st on offense, and 31st on defense, just edging out the Jaguars (who ranked 32nd on offense and 30th on defense).
  • Kansas City finished 32nd in Aaron Schatz’s efficiency rankings, as Football Outsiders ranked them 31st on offense, 30th on defense, and 22nd on special teams.

[continue reading…]

{ 9 comments }

Quarterback Age Curves

The master and the puppet?

The master and the puppet?

Last summer, I looked at the age curves for running backs in an attempt to find out if there is a magical cliff at age 30 (there isn’t). But when I wrote about Josh Freeman last week, I started thinking about quarterback age curves.

The first step in trying to measure the aging patterns of quarterbacks is to figure out a sample to analyze. I decided to look at all quarterbacks who entered the league since 1970 and have since retired. I further limited my sample to quarterbacks who had at least three seasons of above-average play based on this system. That brought us to a group of 77 quarterbacks, from quarterbacks like Jon Kitna, Jay Fiedler, and Dan Pastorini to Hall of Famers like Joe Montana, Brett Favre, and Dan Marino.

While before I graded quarterbacks based on how much value over average they provided, that baseline is too high for this type of post. Instead, I gave quarterbacks credit for their value over replacement, defined as 75% of the league average. I then calculated the best three seasons of value over replacement (VOR) for each quarterback’s career to get a sense of their peak level of play. The last step was to divided their VOR in each season of their career by their peak value. Do this for each of the 77 quarterbacks, and we can get a sense of quarterback aging patterns.

There is another thing to consider when coming up with an age curve: The intuitive way is to sum up each quarterback’s value (relative to his peak) in each season and divide that total by the number of quarterbacks active at that age. Another way is to divide that total by 77, the number of quarterbacks in the study. The former method will make really young and really old ages look closer to average than they really are, but I have decided to include both methods in the picture below. The blue line represents the average performance based on the number of quarterbacks actually playing in the NFL that season; the red line shows the aging patterns when you divide by the total number of passers in the group.
[continue reading…]

{ 11 comments }

The teacher and the pupil.

Alex Smith has had an incredible career revival since Jim Harbaugh came to San Francisco. The first six seasons of his career, Alex Smith won just 38% of his 50 starts, but he has an incredible 15-3 regular season record since 2011 (83%). From 2005 to 2012, Smith had an ugly 72.1 passer rating, the worst of any quarterback with 1500 attempts over that span. Since Harbaugh came to town, Smith has a 93.6 passer rating, the 7th best mark of any quarterback over that time frame.

But there are two other, related, metrics, that indicate a fundamental shift in Smith’s style of play. In 2011, Alex Smith led the NFL in interception rate, but he also led the league in sacks. Smith threw an interception on just 1.1% of his passes in 2011 but took a sack on 9.0% of his dropbacks; this year, his sack rate has jumped to 10.9% while he has yet to thrown an interception.

Last year, the average quarterback threw an interception on 2.9% of his passes and was sacked on 6.4% of his dropbacks, meaning Smith’s interception rate was just 39% of the league average while his sack rate was 41% higher than league average. Smith also averaged just 197 passing yards per start, 80% of the league average metric.

It’s extremely early, of course, but Smith looks to be on a similar path this year. Which made me wonder: how often does a quarterback [1]For purposes of this study, I also limited the group to quarterbacks since 1978 who played for the same team for both years and who threw at least 200 passes in both years. have a two-year stretch with (1) an excellent interception rate, (2) a bad sack rate, and (3) a below-average amount of passing yards per game? The answer is very rarely.

There’s a lot of information to present, so I’ve overloaded the table below. This lists all quarterbacks since 1978 who over a two-year period had a sack rate at least 30% higher than average, an interception rate of 70% of league average or lower, and were below league average in passing yards per game. After the traditional categories, I’ve listed each quarterback’s sack rate, interception rate and yards per game, and then how their sack rates, interception rates and yards per game compared to league average. The last two columns show the quarterback’s record over those two years.

QBTmYearsAttYdTDINTSkSkYdSkRtINTRtYPGSk%INT%YPG%RecWin%
Charlie BatchDET1998--1999573413524137340811.3%2.3%180159.9%68.3%80.1%11-11-00.500
Steve YoungSFO1996--199767254393312693809.3%1.8%201134.6%55.6%91.5%21-6-00.778
Jim HarbaughIND1996--199771446902315774469.7%2.1%180140.7%65.4%81.9%9-16-00.360
Jim HarbaughIND1995--199671952053016724099.1%2.2%179145.3%69.2%78.6%14-12-00.538
Jim HarbaughIND1994--199551640152611532919.3%2.1%149156.2%69%64.3%11-10-00.524
Ken O'BrienNYJ1987--198881752632815876319.6%1.8%202134%46.6%91.9%11-12-10.479
Neil LomaxSTL1985--19868925797312411382311.2%2.7%193141.2%65.9%85.8%9-20-10.317
Ken O'BrienNYJ1984--1985691529031158456710.8%2.2%203130.1%52.8%89.9%12-9-00.571
Steve BartkowskiATL1983--1984701532533159164811.5%2.1%213140.5%50.8%94.6%9-16-00.360
Neil LomaxSTL1982--1983559400329177454911.7%3%182147.7%69.6%82%12-9-10.568

During Jim Harbaugh’s 4 years in Indianapolis, he was essentially Alex Smith. He had a 9.6% sack rate and a 2.1% interception rate, while averaging under 180 passing yards per game. When discussing Joe Namath, I noted that he almost never took sacks, which by some measures penalized him because it drove down his completion percentage and increased his interception rate. You can put Alex Smith and the Indianapolis version of Jim Harbaugh on one end of a spectrum and Joe Namath on the other. Both interceptions and sacks are bad, but to some extent, quarterbacks can decide whether they want to throw interceptions or take sacks. Smith, under Harbaugh’s tutelage, has clearly chosen the latter.

On a team with a great defense, that can work. Namath’s defenses weren’t always good, but when they were, the Jets were Super Bowl contenders. When the defenses struggled, Namath pressed even more, and ended up throwing even more interceptions. Smith is never asked to do too much, and Harbaugh has surrounded him with enough talent on the other side of the ball to make that a winning formula.

From 1994 to 1996, Jim Harbaugh went just 20-26 with the Colts. In 1997, Harbaugh had the lowest interception rate in the NFL and the second highest sack rate in the league. But the 1997 Colts ranked in the bottom 5 of the NFL in points allowed, passing touchdowns allowed, interceptions forced, rushing yards allowed, rushing touchdowns allowed and yards per carry allowed. The team went 3-13 overall, and 2-9 with Harbaugh, indicating that this conservative philosophy has its limitations.

Often times we use stats as a way to rank players, where more of one stat or less of another means a player is good, and less of one stat and more of another means a player is bad. But stats can also be used descriptively without overarching themes of good or bad. Just like some running backs are big and slow and others are small and fast, some quarterbacks are risky and some are risk-averse.

Harbaugh clearly was a risk-averse player in Indianapolis under Lindy Infante. What about the other players on the list? Conservative and risk-averse were good adjectives to describe Charlie Batch’s first two years in the league. In 1998, he had Barry Sanders, but Batch’s numbers were nearly identical both seasons (of course, you would normally expect some improvement by a quarterback betwen year one and two). It looks like he played things very safe as a rookie on a good team in 1998, and let’s not forget how he got the starting job: Scott Mitchell was benched after throwing a pick-six in overtime. We can safely conclude that Batch was told to avoid interceptions at all costs, for many reasons.

Steve Young led the league in passer rating in ’96 and ’97, and for many reasons, doesn’t really feel like a comparable player to Alex Smith. He had already been a two-time MVP by 1996.

Ken O’Brien was a very accurate quarterback who led the league in interception rate in ’85, ’87 and ’88. But he took a ton of sacks, in part because of a below-average offensive line. At his peak he was better than Smith has been so far — in ’85 he was 2nd in yards per attempt and he was 5th in that metric in ’86 — but there are some similarities between the two players.

From 1982 to 1986, Neil Lomax had a 10.5% sack rate but a tiny 2.8% interception rate; despite the conservative nature, his team went just 30-36-2 over that span. Lomax was outstanding in 1984, but otherwise was a solid but unspectacular player during this span (Lomax made the Pro Bowl in ’87 when he led the league in completions, attempts, and passing yards.) Lomax also benefited from consecutive All-Pro seasons from Roy Green in ’83 and ’84, but poor defenses prevented Lomax from compiling a winning record in St. Louis.

In the early ’80s, Steve Bartkowski had some success under Leeman Bennett, and made the Pro Bowl in ’80 and ’81. During those years, he was at or above average in sack rate and also interception rate, but then his interception rate improved dramatically in ’83 while his sack rate fell off for the rest of his career. A likely explanation is the hiring of Dan Henning that season, who may have emphasized a more conservative approach.

The two years before Harbaugh arrived, Smith had a 6.2% sack rate and a 3.1% interception rate, both numbers which were pretty close to league average. But Alex Smith 2.0 is not trying to prove to the world that he’s the #1 pick who can do everything; this version is concerned with minimizing risks at all costs. So far, it’s been a very successful formula.

References

References
1 For purposes of this study, I also limited the group to quarterbacks since 1978 who played for the same team for both years and who threw at least 200 passes in both years.
{ 4 comments }

[You can find lots of websites previewing each team as we head towards the 2012 season. You won’t find that at FootballPerspective.com, but instead, I’ll share some random thoughts on each franchise based on well, whatever springs to mind. We’ll kick things off with look at the San Francisco 49ers.]

The 49ers are an interesting team to me because they seem like the ideal candidate to regress. Generally, teams that make huge jumps in one season are better candidates to fall back to the pack than elite teams with a history of success. Additionally, defensive teams are generally less likely to retain their success than offensive teams. But since I don’t expect you to just believe me…

I looked at all teams since the AFL-NFL merger in 1970 that won at least 75% of their games (San Francisco went 13-3 last year) and then separated them based on their records in the prior season (the 2010 49ers went 6-10). There were 155 of them, and how they performed in the year before (Year N-1) their elite season was relevant in determining their record in the year (Year N+1) after that big season. The table below breaks down the teams based on their winning percentages in Year N-1 (for our purposes, that’s 2010 for the 49ers) and then shows how well they performed in Year N+1 (for our purposes, the 2012 49ers):

Year N-1# of TmsN-1 Win%N Win %N+1 Win %
Over 80%2486.3%79.7%67.2%
70-80%3274.2%81.5%70.2%
60-70%3965.1%80.6%62.6%
50-60%3553.8%79.6%63.2%
<50%2536.8%79%53.6%
Total15563.1%80.2%63.5%

Just so we’re all on the same page, the top row of that table informs us that of the 155 teams to win at least 75% of their games, 24 of them won over 80% of their games in Year N-1. On average, those teams won 86.3% of their games in Year N-1, 79.7% of their games in Year N, and then 67.2% in Year N+1. The 49ers would represent a team in the bottom row. There have been 25 teams like the 2011 49ers who won at least 75% of their games after having a losing record the prior year (on average, those teams won just 37% of their games – just like the 2010 49ers); in the following year (e.g., the 2012 49ers) those teams won just 53.6% of their games.

[continue reading…]

{ 5 comments }