by Bryan Frye
on December 23, 2021
Adam Steele is back to give us his thoughts on this week’s quarterbacks. It’s been fun to follow his progression from hopeful fan to ranting madman over the course of just fifteen weeks.
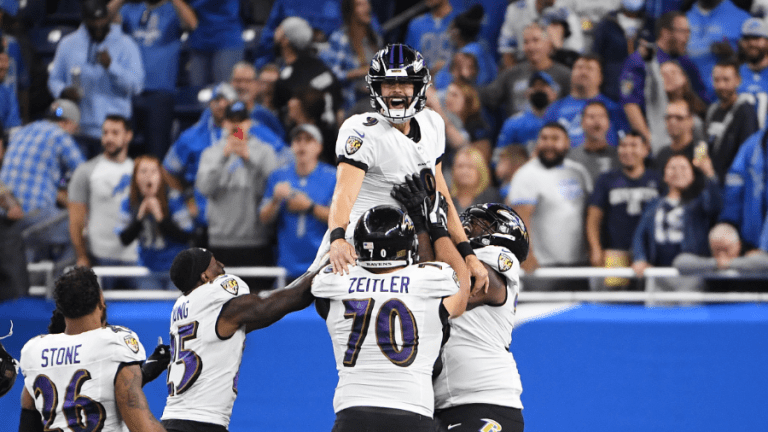
This is starting to sound like a broken record but we just witnessed yet another week of terrible quarterbacking. Only 9 of 32 qualifiers even cracked a QBR of 50! We can’t even blame this on backup QB’s dragging down the average as the bottom 10 were all regular starters aside from Mike Glennon. If anything, the backups outperformed the starters with Tyler Huntley taking the week 15 crown and Nick Mullens placing eighth. [continue reading…]
Tagged as:
Adam Steele,
Guest Posts,
stat recap
{ }
by Bryan Frye
on December 15, 2021
Adam Steele is back with another quarterback recap. He has a broken arm and a detached retina, and he’s ready to win it.
This may have been the least interesting week of the 2021 season for overall game quality (favorites were 12-2 with some totally noncompetitive matchups), but it was still a fascinating slate for analyzing quarterback performance. [continue reading…]
Tagged as:
Adam Steele,
Guest Posts,
stat recap
{ }
by Chase Stuart
on December 14, 2021
The Minnesota Vikings have played a lot of close games this season. In fact, all but one of their games was decided by 8 or fewer points, and the average margin of victory — regardless of who won the game — has been just 5.15 points.
[continue reading…]
{ }
by Chase Stuart
on December 10, 2021
On Monday Night Football, the Bills and Patriots squared off in a game defined by the elements. The temperature was 36 degrees at kickoff, with heavy winds and some mix of rain and snow. There was a 15-yard punt by the Patriots going into the wind in the 1st quarter, and a 71-yard punt by New England kicking with the wind in the 4th quarter. New England opted for a 2-point conversion try after the team’s only touchdown of the game. But by far the most meaningful impact came in the Patriots pass/run run ratio: New England wound up passing on just three of 49 plays! That’s a 6.1% pass ratio, highlighted by a stretch of 32 consecutive runs in the middle of the game. Bill Belichick will be remembered as coming up with a great game plan in poor weather, asking almost nothing out of his rookie quarterback Mac Jones.
Since 1950, that made this just the fifth game where a team ran on at least 93% of its plays. Let’s review the the other four now: [continue reading…]
{ }
by Bryan Frye
on December 9, 2021
As has been the case for nearly two months now, the steady decline of NFL offenses continued in week 13. Scoring has dropped from 24.8 points per game last year to 22.9 this year. The league is currently averaging 11.0 yards per completion; if this holds it will be the lowest in NFL history. There’s also been a marked shift in touchdown passes vs. interceptions. Early in the season there were 3.5 TD passes for every INT; that ratio is now below 2 to 1. For the first time in several years the NFL has found a nice equilibrium between offense and defense. It’ll be interesting to see if the competition committee devises rule changes to boost offense again in 2022.
Here are the week 13 rankings: [continue reading…]
Tagged as:
Adam Steele,
Guest Posts,
stat recap
{ }
by Bryan Frye
on December 2, 2021
This week I’m excited to introduce a new data set into my quarterback rankings, courtesy of Pro Football Focus. I’d like to give a helmet knock to our good buddy Bryan Frye for working out some details behind the scenes to make this possible.
From this point forward, I will be using two metrics to rate quarterbacks: QBR and PFF offensive grades. This makes me giddy because both systems attempt to isolate the QB’s contribution from that of his teammates. That’s a significant step up from ANY/A, DYAR, and EPA which simply assign team offensive statistics to the QB taking the snaps. I can live with that for historical comparisons where we don’t have anything better, but in today’s world of robust data there’s no reason to settle for such a high degree of entanglement.
As neither QBR nor PFF grades account for workload, I needed to make an adjustment to prevent low usage QB’s from hogging the top of the rankings. After experimenting with a few ideas I settled on adding a z-score for play count (based on qualifiers only) and giving it half weight compared to the z-scores for the two metrics. It’s not perfect but it gets the job done without too many arbitrary decisions.
Let’s see how the new system looks for week 12: [continue reading…]
Tagged as:
Adam Steele,
Guest Posts,
stat recap
{ }
by Bryan Frye
on November 24, 2021
Adam Steele is back, and he’s eschewing the expository fluff (which I am re-adding, right here). Enjoy, friends.
Here are this week’s quarterback rankings: [continue reading…]
Tagged as:
Adam Steele,
Guest Posts,
stat recap
{ }
by Bryan Frye
on November 17, 2021
As with the rest of these recaps, the ideas and analysis presented here are from Adam Steele. I’m just a dunce with admin rights.
We’ve seen a steady decline in quarterback play across the last month, and this week hit a new low. The unweighted average QBR for week ten qualifiers was a dismal 44.7. That would have ranked 27th in the league last year! This isn’t a surprise as offense tends to decline in the second half of every season as defenses jell and the weather starts to make an impact.
Here are this week’s numbers: [continue reading…]
Tagged as:
Adam Steele,
Guest Posts,
stat recap
{ }
by Bryan Frye
on November 10, 2021
Adam Steele is back, continuing to refine his methods in real time, and we get to benefit from it. Thank you Adam, for working it out publicly.
After tabulating the numbers for week nine I realized I needed to make one more tweak to the formula. Since EPA per play and QBR are both agnostic to volume, QB games with a low number of plays were disproportionately clustered at the top and bottom of the rankings. Obviously it’s harder to maintain an extreme performance over a larger sample than a smaller one. My solution was to regress EPA/P by adding 20 plays of 0.1 EPA (roughly league average) to everyone’s stat line before calculating their z-scores. This fix strikes a nice balance between efficiency and volume.
Onto this week results: [continue reading…]
Tagged as:
Adam Steele,
Guest Posts,
stat recap
{ }
by Bryan Frye
on November 3, 2021
Adam Steele is back with a brand new convention, and we thank him for keeping the site humming.
With the NFL trade deadline taking place this week, I decided to make a trade of my own. I’m ditching DYAR in favor of EPA per play. After Davis Mills placed seventh in DYAR by turning into Dan Marino down 38-0, I knew I had to switch to a metric that filters out garbage time.
Thanks to Ben Baldwin and his nifty site rbsdm.com, it’s easy to query EPA/P with various amounts of garbage time removed. After some experimentation I settled on a 4% filter; plays which occur when win probability is below 4% or above 96% are thrown out. The vast majority of plays are still counted but nonsense like the Davis Mills experience is rightfully ignored. To wit, Mills drops from -.149 to -.474 EPA/P with this filter applied.
Here are the week eight numbers: [continue reading…]
Tagged as:
Adam Steele,
Guest Posts,
stat recap
{ }
by Bryan Frye
on October 28, 2021
Guys, gals, and nonbinary pals, Adam Steele is back with his quarterback recap. And we thank him for it.
I’m going to keep the commentary short and sweet today, so here are the week seven rankings: [continue reading…]
Tagged as:
Adam Steele,
Guest Posts,
stat recap
{ }
by Bryan Frye
on October 20, 2021
After offenses lit up the scoreboard in week five, we were treated to the poorest quarterbacking of the year in week six. Both DYAR and QBR hit their low points in the 2021 season. What’s shocking is that this happened with the Jets on their bye week!
[continue reading…]
Tagged as:
Adam Steele,
Guest Posts,
stat recap
{ }
by Chase Stuart
on October 17, 2021
InIn one of the first posts at Football Perspective, I looked at the leaders in rushing yards over every 10-year period. The question asked in that article was who would ultimately lead the NFL in rushing yards from 2012 to 2021. We can now answer that question.
The answer may surprise you. I suggested that Trent Richardson was the obvious favorite. Among the names I offered as potential candidates were Mark Ingram, Dion Lewis, Jacquizz Rodgers, LeSean McCoy, Beanie Wells, DeMarco Murray, Doug Martin, David Wilson, Ronnie Hillman, Lamar Miller, Isaiah Pead, Kendall Hunter, and LaMichael James. I said that we could not rule out college stars like Marcus Lattimore or Michael Dyer or Montee Ball or Malcolm Brown or De’Anthony Thomas.
I said Ray Rice and Ryan Mathews, at 25-year-old in 2012, were probably too old to consider. That logic applied to 26-year-old stars Arian Foster and Marshawn Lynch. And while they may have been stud running backs, a quartet of 27-year-olds in Maurice Jones-Drew, Matt Forte, Adrian Peterson and Chris Johnson were clearly too old to consider.
I did not include Ezekiel Elliott or Derrick Henry, as both players were still in high school. As it turns out, barring injury in 2021, they will both finish in the top 5 of rushing yards from 2012 to 2021 despite both entering the league in 2016. Ingram, who was a 2nd-year player in 2012, will fall to 6th when Henry and Elliott pass him. The top 3? In a big surprise, the 27-year-old Peterson — then still recovering from a torn ACL — will wind up third on the list, and just over 300 yards away from the decade-lead. I named the 24-year-old McCoy one of the top candidates, and he will wind up 2nd on the list. But the leader in rushing yards from 2012 to 2021? [continue reading…]
Tagged as:
Frank Gore
{ }
by Bryan Frye
on October 13, 2021
Finally, a week in which the best QB games were more extreme than the worst. The league saw DYAR and ANY/A reach their high points for any week in 2021. Oddly, this was the second worst week for QBR despite the meteoric conventional stats. There seemed to be an unusual number of highlight reel catches and long completions on busted coverages, both of which are likely discounted in QBR.
Fittingly, old man Brady tops the chart in the same week he became the all time leader in total DYAR. Brady and Lamar Jackson had the two best games of the year according to DYAR but fared much worse in QBR. In Brady’s case it’s likely because he faced almost zero pressure vs Miami, while Jackson gets taken to the woodshed for his goal line fumble (another example of QBR overweighting running plays).
Josh Allen had the opposite result – dominant in QBR but merely good in DYAR. He was very successful on his runs, completed his average pass a whopping 13 yards downfield, and didn’t have enough plays to pump up his counting stats. [continue reading…]
Tagged as:
Adam Steele,
Guest Posts,
stat recap
{ }
by Bryan Frye
on October 7, 2021
With it being the (almost) quarter point of the 2021 season, I’m going to skip commentary on the week four games and focus on quarterback performance across the first month of the season. [continue reading…]
Tagged as:
Adam Steele,
Guest Posts,
stat recap
{ }
by Bryan Frye
on September 29, 2021
Adam Steele is back with his quarterback recap for week 3, 2021. Thank you, Adam, you beautiful man.
The theme of week three is the same as week two: terrible rookies. Remarkably, the eleven worst QB games this season have all been more extreme than the single best game. Anyone reading this is well aware of Justin Fields‘ spectacularly awful sack-fest performance against Cleveland. But according to DYAR, that wasn’t even the worst game this week!
Here are the week three numbers: [continue reading…]
Tagged as:
Adam Steele,
Guest Posts,
stat recap
{ }
by Chase Stuart
on September 26, 2021

The greatest kicker ever made the greatest kick ever. His team celebrated.
In the first fifty years of pro football, long kicks were more prayers than plans. The NFL in 1934 was very different than the one we watch today; back then, you could have a player like
Glenn Presnell play quarterback, tailback, defense, and kicker… and also choose his team’s colors, as
he and his wife did with the Detroit Lions and their
Honolulu blue and silver. A few months later, Presnell made a big in-game contribution for Detroit: with the wind at his back and in front of 8,000 fans, he connected
from 54 yards away to provide the sole points in a
3-0 win over rival Green Bay. It was the longest kick in the young history of the NFL.
Kicks over 50 yards were very rare over the ensuing two decades. A few of the top kickers like Lou Groza and Ben Agajanian would connect from long range time to time, but both players maxed out at 53 yards. In 1952, the Chicago Cardinals made just two field goals all season. That year, the Cleveland Browns used a first round pick on Tennessee defensive back and running back Bert Rechichar. As a rookie, Rechichar started every game and turned six interceptions; playing in Cleveland with Groza, the idea of Rechichar ever attempting a field goal would have been silly. But in 1953, the NFL expanded and brought football back to Baltimore. As a result, Rechichar found his way on the expansion Colts. In the second quarter of the opening game, he returned an interception for a touchdown to provide the first ever points for the new team. Teammate Buck McPhail, who was the Colts regular kicker in the preseason, hit the extra point to tie the game at seven apiece. [continue reading…]
{ }
by Bryan Frye
on September 21, 2021
The following post attributes authorship to Bryan Frye, but everything under the line comes from the mind of Adam Steele. We thank him for his contributions to the site and to football discussion.
For the second week in a row, the worst quarterbacks had more extreme performances than did the best. By absolute value, the eight worst games this season have been more extreme than the single best game. I don’t have a good explanation for this other than sheer randomness. [continue reading…]
Tagged as:
Adam Steele,
Guest Posts
{ }
by Bryan Frye
on September 18, 2021
Today’s article comes from friend of the site Pierce Conboy, whom you can find in the comments as pgc or on Twitter as @pgconb. Below the line are his words. Enjoy.
Pro Football Reference is undoubtedly one of my favorite websites, so initial apologies for what amounts to taking pot shots at Approximate Value (AV) in a way that they did not intend, though consistent with how it’s widely misused by football fans at large.
This project is fairly nebulous and has no actual rules aside from a general attempt to create an extremely high AV team that would get crushed by a low AV team. I held my offense and defense below 100 AV apiece which was my arbitrary self-imposed ceiling along with keeping the average era from each of the two teams relatively close.
Here are the squads I came up with, having also consulted with Bryan, Bipedal-Moose from Reddit and cribbing from Turney and Troup articles at Pro Football Journal. [continue reading…]
Tagged as:
approximate value,
Guest Posts,
Pierce Conboy
{ }
by Bryan Frye
on September 15, 2021
The following post attributes authorship to Bryan Frye, but everything under the line comes from the mind of Adam Steele. We thank him for his contributions to the site and to football discussion.
With Chase being such a busy man, I have taken over posting weekly passing reviews during the 2021 season. While the classic ANY/A formula has served its purpose over the years, I’m going to tap into a couple of more advanced metrics to rank quarterbacks on a weekly basis.
Each week, qualifying QB’s will be scored using Football Outsiders’ DYAR and ESPN’s QBR metrics. I think this will give us a nice balance between play-by-play and charting stats, as well as a balance between counting stats and pure efficiency. The qualifying players will have their z-score calculated for DYAR and QBR then averaged to create their overall score.
Here are the week 1 results: [continue reading…]
Tagged as:
Adam Steele,
Guest Posts
{ }
by Bryan Frye
on September 4, 2021
 We’ve come to the end of the line. After several posts ranking and reranking, thinking and rethinking, quarterbacks with Total Adjusted Yards per Play and its descendants, this is the one I imagine most readers really want to see. Today, we are looking at measured performance in the regular season and playoffs combined. This is where guys like Y.A. Tittle, who feasted in the regular season but nearly always faltered in the postseason, see their positions fall down the list. Where passers like Jim Plunkett, whose regular season performances left much to be desired but went full tilt bozo in the playoffs, rise up the ranks. As far as the NFL record book is concerned, the playoffs don’t count toward career stats or win-loss totals. While I understand not rewarding players for getting to participate in more games, I can see the argument that it is equally unfair not to reward them for playing well enough to continue the march toward a championship. In order to balance those ideas, I have only counted playoff performances that measured above average by TAY/P.
A quick word on the numbers I’m using. You can find more detail in previous articles in the series, but this should be sufficient to introduce the rookies and refresh the veterans. [continue reading…]
Tagged as:
Bryan Frye,
Guest Posts,
total adjusted yards
{ }
by Bryan Frye
on September 3, 2021

We’re back at it with quarterback rankings based on Total Adjusted Yards per Play and its abundant offspring. This time, we’re getting into combined regular and postseason stats for single seasons. For the purposes of this article, I will refer to this as a full season. None of the stats are new and have been explained in what I hope is sufficient detail in previous posts. As fun as it would be to call this “the greatest quarterback seasons in history!” or something like that, I seem to have a deeply held grudge against page views and web traffic, because I can’t get behind calling it anything of the sort. This is one measure of how much quarterbacks produced in a given full season. I believe it is the best measure when trying to compare across eras in which superior metrics don’t exist, but that’s about as far as I can go on the hubris tip. Anyway, these are my numbers. I hope you like them. [continue reading…]
Tagged as:
Bryan Frye,
Guest Posts,
total adjusted yards
{ }
by Bryan Frye
on September 2, 2021
 We have already looked at postseason performance in single games and single seasons. Today, we’re finally having a go at full playoff careers. All of the metrics I am using today have been explained, in great detail, in the previous four posts, so I am not going to belabor the point here. I will, however, remind the reader that Total Adjusted Yards per Play, and its many variants, is just one approach to measuring quarterback performance. It doesn’t account for weather, and it is not adjusted for the strength of opposing defenses (not yet, at least). Moreover, these numbers are based on box score stats and do not include more granular information, like time on the clock, field position, and yards to go on a set of downs. A four yard pass on 1st and 10 is much less valuable than a four yard pass on 3rd and 3, but TAY/P treats them equally. This is by design, because the goal of this metric is to do the best possible job of comparing quarterbacks across eras. I can’t do that with DVOA or EPA/P, because the play by play data just don’t go back far enough. However, when I looked into the correlations of TAY/P with more granular metrics, the r value tended to land between .93 and .94 (even for ESPN’s QBR, with its often wacky use of win probability). This suggests, to me, that most of these issues smooth themselves over in the long run. [continue reading…]
Tagged as:
Bryan Frye,
Guest Posts,
total adjusted yards
{ }
by Bryan Frye
on September 1, 2021
Yesterday, we looked at playoff performance in individual playoff games, as measured by Total Adjusted Yards per Play (and its copious derivatives). Today, I’m taking the next logical step and looking at performance over a full postseason in any given year. In other words, instead of examining who produced the most in the Super Bowl last year, I am determining who produced the most over the entire 2020 playoffs. By that, I mean who produced the most as measured by this particular set of numbers. They happen to be my preferred numbers for comparing across eras, but your mileage may vary.
For the uninitiated, here is a brief rundown of the metrics used:
Total Adjusted Yards per Play is like ANY/A with rushing included. It is (pass yards -sack yards + rush yards + 20*pass TDs + 20*rush TDs – 45*interceptions – 25*fumbles) / (passes + sacks + rushes). This version of TAY/P doesn’t include first downs, since I only have reliable first down data back to 1991 and want to make the playing field as level as possible when comparing back to 1936. [continue reading…]
Tagged as:
Bryan Frye,
Guest Posts,
total adjusted yards
{ }
by Bryan Frye
on August 31, 2021
Before the 2021 season starts, I figured I would try to add a little more to the Total Adjusted Yardage information I have been posting. Today, I want to discuss the same stats as before, as well as a few additions, for every postseason game in which a quarterback had at least five action plays. Not all information is complete, as sacks are unavailable prior to 1948. However, I’m working with what I have and not looking back. Because this is the postseason, it is inherently worth more with regard to both earning a championship and establishing one’s legacy. Therefore, I am going to include championship leverage in the discussion. I don’t have much to say, so let’s get to the numbers. [continue reading…]
Tagged as:
Bryan Frye,
Guest Posts,
total adjusted yards
{ }
by Bryan Frye
on August 24, 2021
Yesterday, we looked at the best (and worst) regular season performances, as measured by Total Adjusted Yards per Play and its many derivatives. Today, it’s time to look into total career values. Keep in mind, these figures don’t include the postseason, where many legends cemented or defined their legacies. We will get to that later, I promise.
Because I apparently hate driving traffic to the site, I will not title this anything to do with the greatest or best quarterback. Instead, I want to be honest about the fact that the results below are simply one measurement of career performance and are not meant to be definitive. I do believe it is the best approach I have seen when it comes to using numbers to compare quarterbacks across eras, but it isn’t perfect. When you see “Johnny Unitas,” what you are really seeing is Unitas, throwing to Raymond Berry, John Mackey, Lenny Moore, Jim Mutscheller, and Jimmy Orr, handing off to Alan Ameche, and standing behind Jim Parker and Bob Vogel, while glancing over at Weeb Ewbank and Don Shula standing on the sidelines. When you see “John Elway,” what you are really seeing is Elway throwing to a ragtag group of receivers, playing behind a ho hum offensive line, and under the tutelage of an unimaginative head coach during his prime, before getting basically the opposite of that late in his career. The average reader at Football Perspective has a good grip on both history and stat and should have little trouble contextualizing the numbers presented today. [continue reading…]
Tagged as:
Bryan Frye,
Guest Posts,
total adjusted yards
{ }
by Bryan Frye
on August 23, 2021
It has been a while since I published anything specifically relating to my niche homebrewed metric, Total Adjusted Yards per Play (TAY/P). It has been longer, still, since Chase has posted his latest entry into the corpus of his legendary QBGOAT series. I figured I would kill one bird and dizzy another with one stone. This post is specifically about TAY/P and its derivatives. It is not a treatise on the greatest quarterbacks of all time. Instead, it is a look at how several quarterbacks have fared in a few different variations of a single measurement since 1932. If you want to view it as a GOAT list, you are free to do so, though I would not encourage it. I believe statistics should be used to support your argument rather than serve as the entirety of your argument.
I am not under the delusion that this is the premier metric to use when evaluating quarterbacks. I prefer a holistic approach that includes everything from simple box score stats to convoluted algorithms and subjective grades. I consider EPA/P, DVOA, and Total QBR to be superior measurements. The only problem is that they don’t cover a large enough portion of NFL history to make comparisons. Thus, I continue to use TAY/P because it uses simple box score numbers to create a metric that can compare quarterbacks dating back as far as we have box scores. [continue reading…]
Tagged as:
Bryan Frye,
Guest Posts,
total adjusted yards
{ }
by Bryan Frye
on August 17, 2021
 Named in honor of Automatic Otto Graham, the Automatic Award goes to the most valuable player in the league each season. Given the value of passing for most of NFL (and AFL and AAFC) history, this award will almost always go to a quarterback. He touches the live ball more than any other player, has by far the largest impact on the outcome of his team’s success, and is arguably the most important position in team sports. By and large, I am going to give preference to players on successful teams, with the possibly flawed idea that a player may have been valuable on a bad team, but it’s hard to call him most valuable if he had a losing squad. I try my best to separate a player’s contributions from those of his teammates, but I still attempt to recognize historically dominant seasons that come on teams with other great players. After all, it is difficult to disentangle a quarterback from his receivers and protectors, a running back from his blockers, or any player from his coaches, and I don’t want to take away too much credit from a guy just because of his perceived advantages.
I have chosen most valuable players for every season back to 1920. However, given the paucity of recorded stats, as well as the nigh nonexistence of film to study, I decided to publish only the results dating back to 1946. At that point, we have nearly the same box score numbers that we have today, and there is enough game footage available to paint a fairly reliable picture of a player’s performance. Obviously, with less information the further back we go, I have less confidence in my selections with each additional year we travel into the past. At the same time, because I know it is more difficult to come to conclusions about those seasons, I’m less torn up about picking players in a tossup scenario. Today, with abundant information at my fingertips, I find myself going back and forth over two or three players almost every year, talking myself in and out of their respective qualifications to the point that words start to lose meaning and I shrink into myself like Demeter of myth.
[continue reading…]
Tagged as:
Bryan Frye,
Guest Posts
{ }
by Bryan Frye
on July 27, 2021
Adam Steele is back (sort of) with the results of the greatest team of all time installment of his Wisdom of Crowds project. He was busy and asked me to do the writeup, so I shall do my best to do it justice.
This wasn’t exactly the busiest ballot topic—we only received 14 ballots, 12 of which were accepted. So, with the caveat that the sample size is dreadfully small, the Football Perspective readers chose the 1985 Chicago Bears as the greatest team of all time. I don’t think that comes as much of a surprise to anyone. Also expected, the juggernaut 1991 Washington squad that probably gets underrated in most circles due to the lack of a Hall of Fame passer, took silver, and the dominant 1962 Packers snagged a bronze. [continue reading…]
{ }
by Bryan Frye
on July 12, 2021
After about 215000 words and nearly 400 pages, the Grand List is finally over. Before I get to updating the list to include the 2020 season, I want to consolidate some of the information from the project.
By design, there were five special teamers and six return men on the team. After that, I went with the players I felt were the best, irrespective of position. Without separating premodern from modern players, and counting two way players by their offensive positions, here is a positional breakdown of the list:
- 90 quarterbacks
- 118 running backs
- 10 blocking fullbacks
- 122 wide receivers or ends
- 41 tight ends
- 77 offensive tackles
- 72 offensive guards
- 44 offensive centers
- 75 defensive ends
- 83 defensive tackles
- 111 linebackers
- 65 cornerbacks
- 62 safeties
- 10 kickers
- 9 punters
Given the number of players at each position that occupy the field at the same time, which has fluctuated as the league has evolved, I don’t think the numbers are too far off from whatever the ideal is. The relative lack of defensive players is explained by the fact that the premodern players played on both side of the ball. So when I count Baugh as a quarterback, I am ignoring his work at safety to avoid double counting, though he obviously played on defense for much of his career. In theory, there should be about the same number of tackles and guards, and that number should be about twice as high as centers. However, it looks like centers are a little high, so I may have been too generous there, or not generous enough with guards and tackles. When looking at the older players, I remember having the impression that, for one reason or another, centers tended to be better on defense. That may explain some of the high number. I think I am a little low on defensive backs, and I will try to further examine my own thoughts on that as I continue to update the list as I gather new information.
When I update the list to include the 2020 seasons, as well as additional study I have done on older players in the time since I began writing the list, I have considered removing special teams players and giving them their own special section. It always felt weird putting even the best kickers on par with a Hall of Fame level defensive end or wide receiver. Hekker and Tucker were right between Tingelhoff and Dorsett on the original list, and I still feel conflicted about that. I believe they are the best ever at their roles, but they barely step foot on the field. I would much rather create a separate section just for guys like them, Hester, and Tasker so I can make room on the top 1000 for players like Joel Bitonio, Joe Thuney, Tre’Davious White, or Tyrann Mathieu. I’d love to hear the opinion of the Football Perspective readership, whom I consider one of the smartest I’ve had the pleasure of encountering. [continue reading…]
Tagged as:
Bryan Frye,
Grand List,
Guest Posts
{ }