≡ Menu

Great Defenses and Missing the Playoffs

Lewis finds out his quarterback is Kyle Boller

Lewis finds out his quarterback is Kyle Boller.

Ten years ago, the teams with three of the four best defenses in football missed the playoffs. The Buffalo Bills ranked 1st in Adjusted Net Yards per Attempt allowed and 2nd in Adjusted Yards per Carry allowed. That year, Sam Adams, Takeo Spikes, Terrence McGee, and Nate Clements made the Pro Bowl, while Aaron Schobel had 8 sacks and London Fletcher was London Fletcher but younger. The team ranked 1st in DVOA by a good margin, but finished 9-7, narrowly missing the playoffs.

That year, Baltimore ranked 4th in ANY/A allowed, 3rd in AYPC allowed, and 2nd in DVOA. The Ravens weren’t quite as good on defense as the ’00 or ’06 iterations, but still had Terrell Suggs, Ray Lewis, Adalius Thomas, Chris McAlister, and Ed Reed (not to mention a 37-year-old Deion Sanders). Of course, this was the Ravens team that was one of the most one-sided team in NFL history. Baltimore also finished 9-7 in a year where six AFC teams won double-digit games.

Over in the NFC, Washington’s defense ranked 1st in Adjusted YPC and 3rd in ANY/A in Joe Gibbs’ first season back in D.C. Marcus Washington was the team’s only Pro Bowler, but the defense featured a rookie Sean Taylor, Ryan Clark, Shawn Springs, Antonio Pierce, and Cornelius Griffin. Despite ranking 4th in defensive DVOA, the team won just six games.

So why today are we looking at these three teams, nearly ten years later? It’s not to remind you that Drew Bledsoe, Kyle Boller, and Mark Brunell failed to guide those teams to the playoffs. As it turns out, these are the last three teams to finish in the top five in both ANY/A allowed and AYPC allowed and still miss the playoffs. In fact, since 1970, just nine other teams have managed to pull off that feat.

  • In 2002, Miami ranked 5th in both ANY/A and AYPC allowed, while the Panthers ranked 4th in both categories. Carolina was a year away from a Super Bowl appearance, while the Dolphins were nearing the end of their Jason TaylorZach ThomasSam Madison run.
  • In 1999, a year before The Year, the Ravens ranked 2nd in both metrics but finished just 8-8.
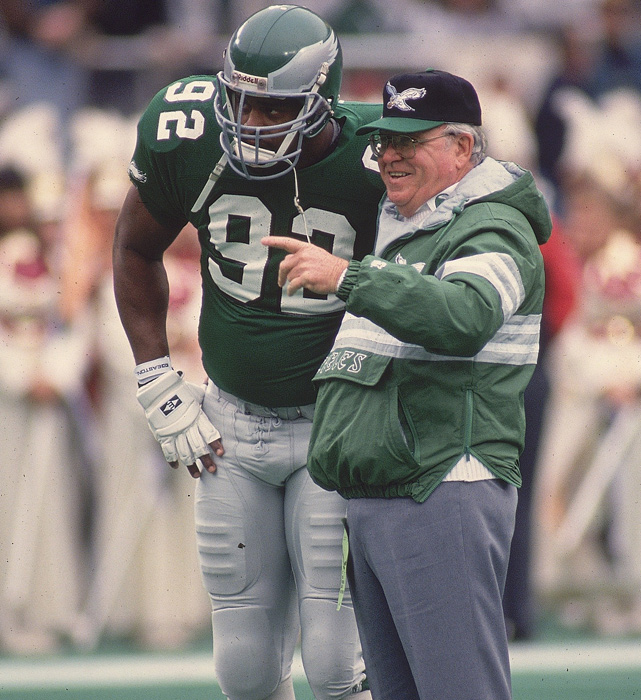
  • You know all about the 1991 Eagles, so of course they are on this list.
  • The 1987 Giants, a year after winning the Super Bowl, still produced a Super Bowl caliber defense behind Lawrence Taylor, Carl Banks, Pepper Johnson, and Harry Carson, but the team’s offensive line (3rd most sacks allowed, 2nd worst YPC average) torpedoed the offense.
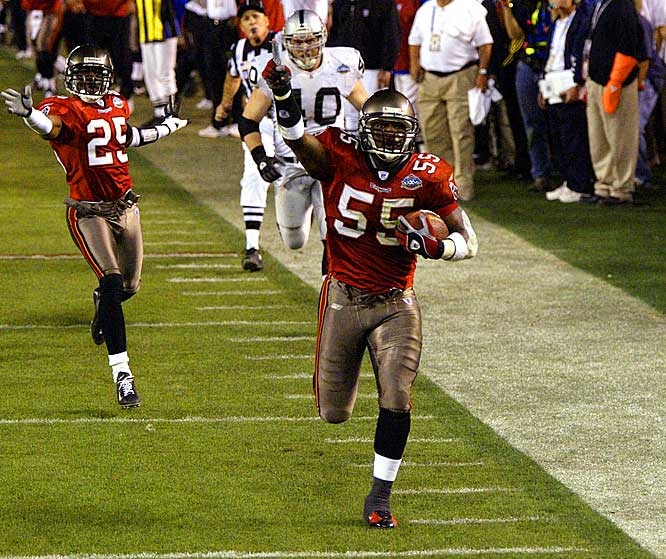
  • In 1978, a year before nearly carrying the team to the Super Bowl, Lee Roy Selmon and Dave Pear helped Tampa Bay rank 1st in AYPC allowed and 3rd in ANY/A allowed. But a miserable offense led to a losing record in the franchise’s third season.
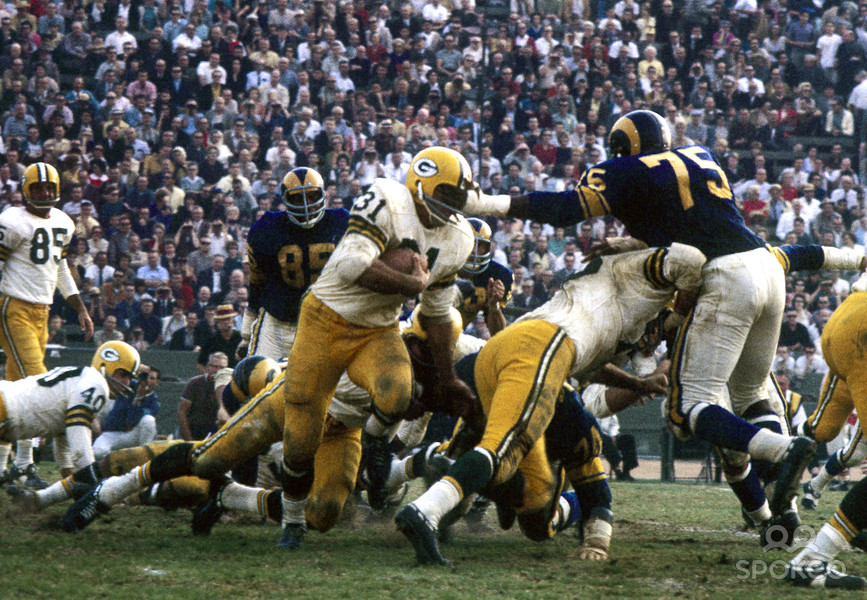
  • The 1974 Packers ranked 5th in both categories. The defense sent Ted Hendricks, Willie Buchanon, and Ken Ellis to the Pro Bowl, but if you think this is just a thinly-veiled reason to bring up John Hadl, you are a regular reader of this blog.

Since 2004, six teams have ranked 1st or 2nd in AYPC allowed but missed the playoffs. Two of those seasons occurred last year, with the Jets and Cardinals, respectively. The 2006 and 2007 Vikings also join that list, along with the 2007 Ravens (a year after a magnificent season) and the 2010 49ers (a year before a magnificent season).

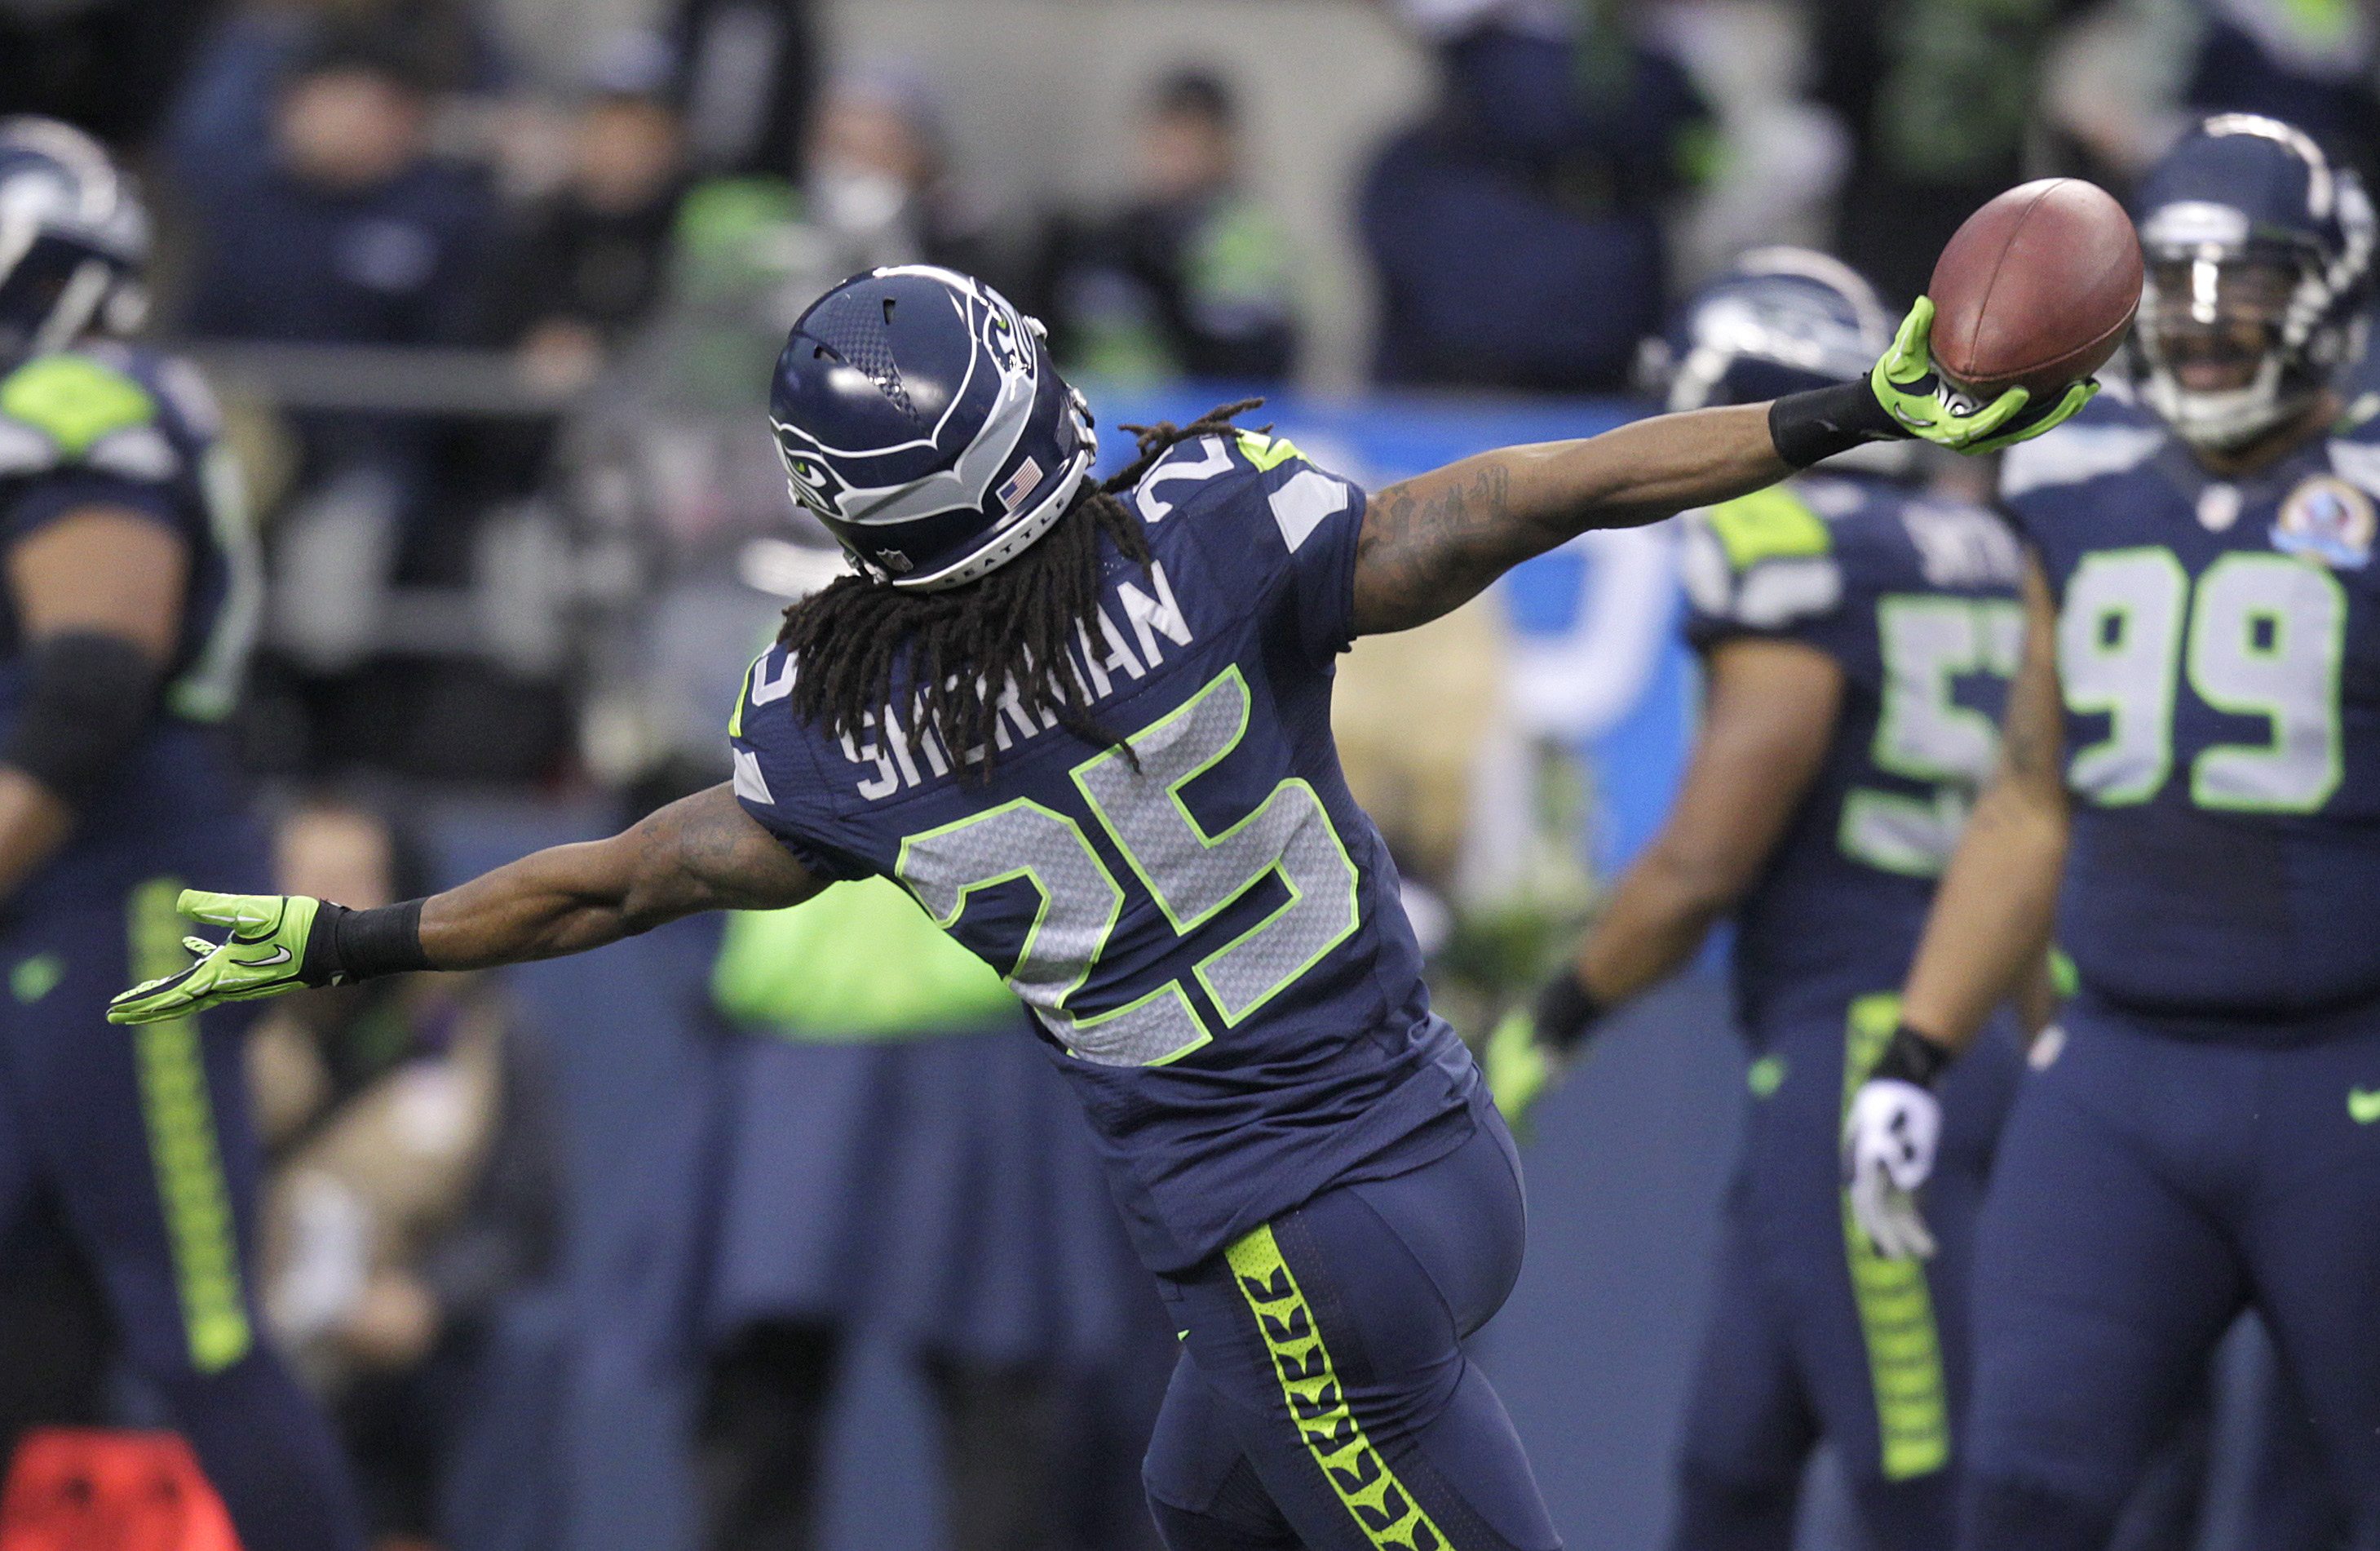
Having a dominant pass defense is even more likely to send a team to the playoffs. Since 2004, only one team — the 2012 Bears — ranked 1st in ANY/A allowed but missed the playoffs. The 2009 Bills are the only team to rank 2nd in ANY/A allowed and miss the playoffs, while the 2013 Bills, 2010 Chargers, and ’05 Jets are the only teams since ’04 to rank 3rd in ANY/A allowed and still fail to make it to January.

Too Long; Didn’t Read

  • The 2004 season was kind of crazy.
  • Since 2002, 24 teams have ranked in the top five in both pass defense and rush defense; five of those teams missed the playoffs, although the last 16 teams pull off this feat have made the postseason.
  • Of the 36 teams to rank in the top 3 in Adjusted Yards per Carry allowed since 2002, only 19 of those teams made the playoffs. Although it’s worth noting that eight of the 17 teams to miss the playoffs out of this group ranked 20th or worse in ANY/A allowed.
  • 28 of the 36 teams to rank in the top 3 in ANY/A allowed made the playoffs.
{ 4 comments }

Weekend Trivia: Sack Differential

White and Ryan helped lead a dominant Eagles pass rush

White and Ryan helped lead a dominant Eagles pass rush.

Last year, the Denver Broncos led the NFL in sack differential — that is, sacks recorded by the defense minus sacks allowed by the offense. Having Peyton Manning really helps, as the Broncos had essentially an average number of defensive sacks (41) but ranked first in offensive sacks (20). So Denver ranked 1st in 2013 at +21, with the Panthers and Rams tying for second at +17 each. The worst team was the Jaguars at -19, with the Dolphins (-16) and Bucs/Falcons (-12) not too far behind.

A few years ago, Mike Tanier wrote a great column on the 1986 Eagles, the team that obliterated the record for sacks allowed with 104. But since Philadelphia had 53 sacks of their own (having Reggie White tends to help), Philadelphia was able to pull into a tie for worst sack differential of all time. That honor of -51 is shared with the 1961 Minnesota Vikings, an expansion team led by our good pal Fran Tarkenton. Minnesota’s defense recorded an absurdly low 16 sacks that season (the 14-team league average, including Minnesota, was 38), and led the league by a substantial margin with 67 sacks, most of them attributed to Tarkenton. Back then, expansion teams were not very good, although the team would turn things around soon.

What about the teams with the best sack differential? Four teams have recorded 40 or more sacks than they’ve allowed. [continue reading…]

{ 9 comments }

Longest Streaks Without Allowing a 100-Yard Rusher

Taylor was a Rams killer

Taylor was a Rams killer.

Last year, I looked at the longest streaks by teams without producing a 100-yard rusher. Today, the reverse: the run defenses that didn’t allow any opposing backs to hit the century mark week after week, year after year (note: all streaks are regular season only, unless otherwise specified). Two teams have gone 50+ straight games without allowing an opposing player to hit 100 rushing yards, and neither defense will surprise you.

The Fearsome Foursome Rams of Merlin Olsen and Deacon Jones fame went 51 straight weeks without allowing a 100-yard rusher. In the final week of the 1964 season, Jim Taylor rushed 17 times for 165 yards against the Rams (he also picked up 56 receiving yards). Over the next three years, no opponent rushed for over 100 yards against Los Angeles. That held true for the first nine weeks of the 1968 season, too, until San Francisco’s Ken Willard broke that mark with a 128-yard performance. That was the only time from 1965 through 1968 that the Rams allowed a 100-yard rusher. Incredibly, there was a stretch of 93 games where the Rams allowed a 100-yard back just five times… and three of them came at the feet of Jim Taylor! [1]In addition to Willard, Baltimore’s Tom Matte also accomplished that feat. And Matte did put up a 99-yard performance in 1965 against LA, too. By 1969, the Rams were positively pedestrian … Continue reading

In 1989, Gerald Riggs, then with Washington, rushed for an incredible 221 yards yards in week two against Philadelphia. That was noteworthy, because for the next 53 games, no opponent rushed for 100 yards against Reggie White, Jerome Brown, and the Philadelphia Eagles defense. We know how dominant the 1991 defense was, but the rush defense was pretty stringy in the surrounding years, too. It wasn’t until Emmitt Smith broke through with a 30-carry, 163-yard day in November 1992 that the streak was snapped. [continue reading…]

References

References
1 In addition to Willard, Baltimore’s Tom Matte also accomplished that feat. And Matte did put up a 99-yard performance in 1965 against LA, too. By 1969, the Rams were positively pedestrian against the run by their standards, allowing both Gale Sayers and Tom Woodeshick to hit the 100-yard mark. Then nobody did it again for 27 games.
{ 11 comments }

The Best Scoring Defenses In NFL History

Head of the LOB

Head of the LOB.

Congratulations to the Seattle Seahawks and their fans on winning Super Bowl XLVIII. With the win, Seattle has confirmed its status as one of the greatest defenses in NFL history. The Seahawks defense produced a game for the ages on Sunday: facing Peyton Manning, Demaryius Thomas, and one of the greatest offenses ever, Seattle’s defense outscored Denver’s offense, 9-8. Led by Malcolm Smith, Cliff Avril, Kam Chancellor, Earl Thomas and Richard Sherman, the Seahawks stamped their claim with the ’85 Bears, ’00 Ravens, and ’02 Bucs as one of the greatest defenses of the last 30 years.

But today, I want to look at which defenses were the best in regular season history, and see where Seattle stacks up. Bill Barnwell had an interesting post during Super Bowl week. He used the statistical measurement known as the Z-Score to show that Seattle was the tenth best defensive scoring team in NFL history. Don’t be too confused by the idea of a Z-score: in English, this just means that Seattle’s defense — and yes, I am going to conflate the concepts of defense and points allowed throughout this post — was 2.2 standard deviations above average in points allowed, one of just ten teams to ever produce such a result.

So how do we get there? Well, Seattle allowed 14.4 points per game during the regular season. The league average was 23.4 points, which means that Seattle’s defense was 9.0 PPG better than average. The standard deviation of points per game among the 32 NFL defenses in 2013 was 4.08 points per game; therefore, Seattle has a Z-score of 2.20, because the Seahawks allowed points at a rate that was 2.20 standard deviations better than the mean.

Today, I wanted to do the same analysis but adjust for strength of schedule, by deriving offensive and defensive SRS grades. Of course, Pro-Football-Reference has published offensive and defensive SRS grades for awhile, but I decided to crunch the numbers on my own and see if they matched up with what Neil and Mike did (they did). For the uninitiated, SRS stands for Simple Rating System, which is simple to understand but a bit complicated to derive. The SRS is simply margin of victory (or, in the case of offenses and defenses, margin of production above league average) adjusted for strength of schedule. The key is using an iterative process, where, in Excel, we adjust the ratings hundreds of times; after all, to adjust for SOS, you have to adjust for the SOS of each opponent, and the SOS of each opponent’s opponent, and so on.

The table below shows the top 200 scoring defenses since 1932. Here’s how to read the 2002 Bucs line. That season, Tampa Bay allowed 9.4 points per game less than league average. The average defense the Bucs faced — using the iterative method to derive SOS grades — was 0.4 points above average. Therefore, Tampa Bay is credited with an adjusted rating of 9.8 PPG better average. The standard deviation of defensive ratings in the NFL in 2002 was 3.45, giving the Buccaneers a Z-score of 2.83, the highest ever. The table below is fully sortable and searchable, and shows the top 200 defenses. [continue reading…]

{ 35 comments }
Still number one.

Still number one.

After 15 weeks, I wrote that Seattle’s pass defense looked to be one of the most dominant since the merger. With the regular season now over, and the Seahawks getting ready for their first playoff game, I wanted to revisit this question and slightly tweak the methodology.

We begin with the base statistic to measure pass defenses, Adjusted Net Yards per Attempt.  Team passing yards and team passing yards allowed, unlike individual passing yards, count sack yards lost against a team’s passing yards total. So to calculate ANY/A on the team level, we use the formula (Passing Yards + 20*TD – 45*INT) divided by (Attempts + Sacks).  The Seahawks allowed just 3.19 ANY/A this year, which was 1.20 ANY/A better than any other defense this season.  In fact, it was so good that it enabled Seattle to easily post the best ANY/A differential (offensive ANY/A minus defensive ANY/A) in the league, too.  The Seahawks 3.19 average is the 4th best average in the least 20 years (behind only the 1996 Packers, 2002 Bucs, and 2008 Steelers). But what makes Seattle’s accomplishment more impressive is the passing environment of the NFL in 2013.

When I graded the Seahawks three weeks ago, I defined the league average ANY/A in the customary way: the ANY/A average of the passing totals of the league as a whole. This time around, I decided it would be more appropriate to (1) exclude each team’s own pass defense when calculating the league average, and (2) take an average of the other team’s ANY/A ratings, as opposed to taking an average of the totals. In 2013, the other 31 pass defenses allowed an average of 5.98 Adjusted Net Yards per Attempt. That means Seattle allowed 2.79 fewer ANY/A than the average team this year: that’s better than every defense since 1990 other than the 2002 Bucs.

Next, I calculated the Z-Score for each pass defense. The Z-Score simply tells us how many standard deviations from average a pass defense was. The standard deviation of the 32 pass defenses in 2013 was 0.95, which means the Seahawks were 2.93 standard deviations above average. That’s the 4th best of any defense since 1950.
[continue reading…]

{ 12 comments }

Can Ware excel as a defensive end?

Can Ware excel as a defensive end?

Depending on whom you ask, Tom Landry either revolutionized or invented the 4-3 front. When he became head coach of the expansion Cowboys, Landry’s teams always fielded four down linemen. And by the time he was forced out, the 3-4 fad that dominated the ’80s had subsided, resulting in Dallas running a 4-3 front every season from 1960 to 2004.

In 2005, several key changes happened in Dallas. Bill Parcells was hired as head coach in ’03, but he didn’t implement a scheme shift right way. After Dallas ranked 27th in points allowed in ’04, though, changes were necessary. With two first round picks, the Cowboys selected 3-4 outside linebacker DeMarcus Ware and 3-4 defensive end Marcus Spears. Dallas also signed Jason Ferguson, who had played nose tackle for Parcells with the Jets. With the pieces in place, Dallas ran a 3-4 defense each of the last eight seasons. Ware has become one of, if not the, greatest 3-4 outside linebackers of all time. But after eight years of Parcells, Wade Phillips, and Rob Ryan, Dallas is returning to its 4-3 roots under Monte Kiffin.

Kiffin, of course, is most famous for the outstanding defenses that he and Tony Dungy created in Tampa Bay; the Tampa-2, after all, has became part of football nomenclature. But I don’t want to go into whether the Cowboys are well-positioned to switch fronts (they’re not) or who will play what role in 2013 (Ware and Anthony Spencer are moving to defensive end, Jay Ratliff will move from NT to DT, and newly rich Sean Lee will play as a true middle linebacker, and he might be even more valuable in this system). Instead, I want to take a 30,000 foot view.

In 1974, the 3-4 defense was introduced to the NFL by Bum Phillips in Houston, Lou Saban in Buffalo, and Chuck Fairbanks and Hank Bullough in New England. I thought it would be interesting to see how teams that switched fronts fared in their first season. On caveat: I wanted to exclude schizophrenic teams like the current Bills (4-3 defense in 2009, 3-4 in 2010, 4-3 in 2011 and 2012, and now a 3-4 again in 2013).  According to my records, 74 teams in NFL history have switched from a 4-3 to a 3-4, or vice versa, after running the same front for the three prior years.
[continue reading…]

{ 6 comments }

For eleven straight years, I’ve written an article called “Defensive Team By Committee.” This year’s version is up at Footballguys.com (subscriber only).

Fantasy defenses are inconsistent from year to year, making it difficult to predict which defenses and special teams (D/STs) will excel. And, at least in theory, the teams available at the ends of your drafts should provide less rewards. So how do you get great production out of the position while saving your most important draft picks?

We spend countless hours analyzing team offenses, and relatively few thinking about team defenses. But an average defense against a bad offense will do just as well as a great defense against an average offense. The key to the DTBC system is to find two teams available late in your draft whose combined schedule features predominantly weak offenses. By starting your defense based on matchups, your D/ST will generally face a weak offense, meaning your D/ST position will score lots of fantasy points.

You can read my two picks, along with a ranking of all 496 combinations, here.

For you iPad users our there, I’ll also recommend the $4.99 Footballguys Fantasy Football Magazine Draft Kit, an awesome resource at a super cheap cost. That includes the Draft GM Kit, which you can separately order if (like me) you don’t have an iPad but do have an iPhone. Both products will also be available on Android very soon, if not already by the time you read this. You can receive all Footballguys updates by signing up on the Free Footballguys Daily E-mail list.

{ 0 comments }

Best Games by Fantasy Defenses

Richard Sherman exhibits the proper form for 'You Mad Bro?' in sign language.

Bill Barnwell wrote yesterday about the dominant fantasy performance by the Seahawks defense against Arizona on Sunday. The Seahawks scored two touchdowns, forced 8 turnovers, recorded three sacks, and pitched a shutout. That made me wonder: which defense produced the best fantasy in NFL history?

I used Footballguys.com’s scoring system in the Footballguys Players Championship to calculate every performance by a fantasy D/ST since 1940. Here it is:

    Team Defense/Special Teams

  • 1 point – Every sack
  • 2 points – Every team takeaway (interception or fumble recovery)
  • 6 points – Every TD (via interception return, fumble return, punt or kickoff return, blocked FG return, missed FG return, blocked punt return)
  • 5 points – Every safety
  • 12 points – Every shutout
  • 8 points – Allowing between 1- 6 points
  • 5 points – Allowing between 7 – 10 points

Because I decided to use the official scoring designation for every play and chose not to rewatch every game in NFL history, there is one error that will come up in every few hundred games. Occasionally, an offense will score a touchdown on its own fumble recovery and that goes down in the gamebooks as a fumble recovery just like a defensive touchdown. So, be warned, these are unofficial fantasy scores.

As it turns out, Seattle’s game against Arizona comes in tied for 10th place. Incredibly, the best performance by a fantasy defense — a whopping 52 points — came in a Steelers-Browns game but wasn’t delivered by Pittsburgh. The came in the 1989 season opener, and after losing 41-10 the following week, Pittsburgh rebounded to finish 9-7 and make the playoffs. In 1950, the New York Giants also scored 52 fantasy points against the Steelers. New York scored 18 points in that game — 2 safeties, two fumble return touchdowns — and forced 9 turnovers and 7 sacks. The table below lists the best performances by a fantasy defense:
[continue reading…]

{ 5 comments }

I broke down each of the NFL and AFL champions since 1950 into three categories:

  • Pass Efficiency, measured by a modified version of ANY/A. The formula was (Passing Yards + 10*TD – 22.5*INT – Sack Yards)/(Pass Attempts + Sacks). This strikes a middle ground between traditional ANY/A and NY/A.
  • Rushing Success, according to the following formula: (Rushing Yards + 10*RTD + 5*Rushing1stDowns)/(Carries).
  • Defensive Rating, based on the number of offensive touchdowns scored by their opponents.

There are ways to quibble with those categories, and I won’t begrudge anyone who does. After giving each team a rating in each category, I calculated how they compared to the league average in each season. In all cases, the average is 100%, and a number higher than 100% means better.

Here’s what each of the columns mean, from left to right. In 2011, the New York Giants won the Super Bowl; they allowed 43 touchdowns to opposing offenses, averaged 7.6 in my modified version of ANY/A, and averaged 4.9 adjusted yards per carry. The next three columns show how New York ranked relative to league average. By allowing 43 scores, the Giants D was well below average, putting them at 83% of the average mark; they were 25% better than average at passing, but only 86% of league average efficiency in the running game. Since the Giants highest rating came in the passing category, they are listed in the Identity column as a Passing team.
[continue reading…]

{ 8 comments }

[Note: I’m scheduled to appear on The Bobby Curran Show on ESPN 1420 at just after 2:00 today. If you’re interested, you can listen here.]

Not Dick LeBeau.

Rex Ryan is the Tim Tebow of coaches: whatever he says tends to get magnified. I was sitting a few feet from Ryan when he made his latest controversial comment. Keyshawn Johnson asked Ryan if having a former head coach in Tony Sparano now coaching the offense would allow him to focus more on the defense. Ryan said it would, although Ryan previously vowed to also be more involved with the offense. The next question asked about Ryan’s confidence, and he said he had a lot of confidence in himself and his coaching staff. He went on:

Now, I wasn’t even in the defensive meeting last night, but I have complete faith and trust in the coaches we have. As I said, it’s easy for me to say I’m the best defensive coach in football. Now that’s saying something, because Dick LeBeau’s pretty (darn) good, Bill Belichick is pretty good. But that’s the way I’ve always believed. And you know what, I believe it because of the guys I coach with, there’s no doubt about that, and the guys that I’ve coached. That’s the truth, and that’s how I feel. I’m going to be more involved over there, calling games or whatever. Obviously, Mike Pettine, that’s my right hand guy, he’s always been my right hand guy and that’s the way it’s always going to be.

Not that inflammatory, is it? In any event, Ryan also issued a call to the media on Saturday, and if you’ve ever read this blog, you know he got my attention with what he said:

I’m still waiting to see somebody put the stats up there, because I know I’m crazy, but go ahead and just put them out there one day, since I’ve been a coordinator and head coach, I dunno where I’d rank…I really don’t even know the answer…Now watch Dick LeBeau get me.

Well, Rex, I’ll put the stats out there for you. Presumably we want to compare Ryan to all current head coaches (with defensive backgrounds) and defensive coordinators in the league. There are only 25 defensive coordinators to examine, as sevens teams do not have coordinators with any relevant track record. Both Missouri teams are actually without defensive coordinators this year: In Kansas City, Romeo Crennel will be head coach and defensive coordinator, while in St. Louis, the Rams are going with a committee approach to replace the suspended Gregg Williams. In addition, five men will be first-time defensive coordinators in 2012: Matt Patricia in New England, Kevin Coyle in Miami, Alan Williams in Minnesota, Jason Tarver in Oakland and John Pagano in San Diego.
[continue reading…]

{ 2 comments }

Thirty years ago, the NFL began officially recording defensive player sacks. Prior to 1982, all teams kept their own individual sack data, but those records (with few exceptions) have never been verified. As a result, it’s an unfortunate reality that for much of NFL history, we simply do not have reliable sack data for individual defensive players.

Three times, Deacon Jones produced 20+ unofficial sacks in the 1960s. [1]According to research done by John Turney. In 1967, Raiders defensive end Ben Davidson Ike Lassiter had 17 sacks [2]Source. in the AFL. Jack Youngblood and Jim Katcavage both led the league in sacks on two different occasions in the pre-1982 era. [3]Source: Turney/Webster Cincinnati Bengal Coy Bacon has been credited with 21.5 unofficial sacks during in 1976. The first team to record 60 sacks in a season was the ’57 Bears, and we can be sure that Doug Atkins recorded more than his fair share of that number. For players like Gino Marchetti, Norm Willey, and Len Ford, even unofficial records weren’t kept during their time, leaving us unsure as to who is the true sack king.

It’s important to remember that just because we don’t have official sack data before 1982 doesn’t mean there were great sack artists before then. But that’s a topic for another today. So while we can’t precisely measure how the forefathers of the game played, we do have official data for the last 30 years. So who has been the best pass rusher of the last three decades?

Brett, are you SURE you're okay?

Using total sacks isn’t a fair method to current players, or to those players who chose to retire instead of sticking around to compile six-sack seasons. So if we want to measure sack dominance, we can’t simply look at total sacks any more than we can grade running backs by looking at career rushing yards. One method I like that I’ve used before is sacks over one-half sack per game. This makes 8 sacks in a 16-game season the bar; a player only gets credit for their production over that level. This means that 12 sacks in a 16-game season brings a value of +4.00, while 16 sacks is twice as valuable at +8.00.There’s no great reason to choose 8 over 6 or 10 or any other number. I chose 8 because it feels right, but I don’t claim that it’s based on anything other than my personal, subjective preference.

[continue reading…]

References

References
1 According to research done by John Turney.
2 Source.
3 Source: Turney/Webster
{ 12 comments }

[You can find lots of websites previewing each team as we head towards the 2012 season. You won’t find that at FootballPerspective.com, but instead, I’ll share some random thoughts on each franchise based on well, whatever springs to mind. We’ll kick things off with look at the San Francisco 49ers.]

The 49ers are an interesting team to me because they seem like the ideal candidate to regress. Generally, teams that make huge jumps in one season are better candidates to fall back to the pack than elite teams with a history of success. Additionally, defensive teams are generally less likely to retain their success than offensive teams. But since I don’t expect you to just believe me…

I looked at all teams since the AFL-NFL merger in 1970 that won at least 75% of their games (San Francisco went 13-3 last year) and then separated them based on their records in the prior season (the 2010 49ers went 6-10). There were 155 of them, and how they performed in the year before (Year N-1) their elite season was relevant in determining their record in the year (Year N+1) after that big season. The table below breaks down the teams based on their winning percentages in Year N-1 (for our purposes, that’s 2010 for the 49ers) and then shows how well they performed in Year N+1 (for our purposes, the 2012 49ers):

Year N-1# of TmsN-1 Win%N Win %N+1 Win %
Over 80%2486.3%79.7%67.2%
70-80%3274.2%81.5%70.2%
60-70%3965.1%80.6%62.6%
50-60%3553.8%79.6%63.2%
<50%2536.8%79%53.6%
Total15563.1%80.2%63.5%

Just so we’re all on the same page, the top row of that table informs us that of the 155 teams to win at least 75% of their games, 24 of them won over 80% of their games in Year N-1. On average, those teams won 86.3% of their games in Year N-1, 79.7% of their games in Year N, and then 67.2% in Year N+1. The 49ers would represent a team in the bottom row. There have been 25 teams like the 2011 49ers who won at least 75% of their games after having a losing record the prior year (on average, those teams won just 37% of their games – just like the 2010 49ers); in the following year (e.g., the 2012 49ers) those teams won just 53.6% of their games.

[continue reading…]

{ 5 comments }
Next Posts